000110123912/312021Q2FALSETRUETRUE30300011012392021-01-012021-06-300001101239us-gaap:CommonClassAMember2021-01-012021-06-300001101239eqix:ZeroPointTwoFiveZeroSeniorNotesDueTwoThousandTwentySevenMember2021-01-012021-06-300001101239eqix:OnePointZeroZeroZeroSeniorNotesDueTwoThousandThirtyThreeMember2021-01-012021-06-30xbrli:shares00011012392021-07-29iso4217:USD00011012392021-06-3000011012392020-12-31iso4217:USDxbrli:shares00011012392021-04-012021-06-3000011012392020-04-012020-06-3000011012392020-01-012020-06-3000011012392019-12-3100011012392020-06-30eqix:center0001101239eqix:BellDataCentersMember2020-10-010001101239eqix:BellDataCentersMember2020-11-020001101239eqix:AxtelMember2020-01-08xbrli:pure0001101239eqix:MetronodeMember2021-01-012021-06-3000011012392021-07-012021-06-3000011012392023-07-012021-06-30iso4217:CAD0001101239eqix:BellDataCentersMember2020-11-022020-11-020001101239eqix:PacketHostInc.Member2020-03-022020-03-020001101239eqix:PacketHostInc.Member2020-01-012020-03-310001101239eqix:PacketHostInc.Member2020-03-020001101239eqix:AxtelMember2020-01-082020-01-080001101239eqix:BellDataCentersMemberus-gaap:CustomerRelationshipsMember2020-10-012020-10-01eqix:acquisition00011012392020-01-012021-06-300001101239eqix:PacketHostInc.Memberus-gaap:TradeNamesMember2020-03-022020-03-020001101239eqix:PacketHostInc.Memberus-gaap:TechnologyBasedIntangibleAssetsMember2020-03-022020-03-020001101239eqix:PacketHostInc.Memberus-gaap:CustomerRelationshipsMember2020-03-022020-03-020001101239us-gaap:CustomerRelationshipsMembereqix:AxtelMember2020-01-082020-01-080001101239eqix:BellDataCentersMemberus-gaap:MeasurementInputDiscountRateMemberus-gaap:CustomerRelationshipsMember2020-10-010001101239eqix:PacketHostInc.Memberus-gaap:MeasurementInputDiscountRateMemberus-gaap:CustomerRelationshipsMember2020-03-020001101239us-gaap:MeasurementInputDiscountRateMemberus-gaap:CustomerRelationshipsMembereqix:AxtelMember2020-01-080001101239eqix:PacketHostInc.Membereqix:MeasurementInputRoyaltyRateMemberus-gaap:TradeNamesMember2020-03-020001101239eqix:PacketHostInc.Memberus-gaap:MeasurementInputDiscountRateMemberus-gaap:TradeNamesMember2020-03-020001101239eqix:GPXIndiaAcquisitionMembersrt:ScenarioForecastMember2021-09-300001101239eqix:GPXIndiaAcquisitionMembersrt:ScenarioForecastMember2021-07-012021-09-300001101239eqix:GICPrivateLimitedMembereqix:GICSingaporeSovereignWealthFundMembereqix:EMEA2JointVentureMember2021-06-300001101239eqix:EMEA2JointVentureMember2021-06-300001101239eqix:DB5DataCenterAndAssetsToBeSoldToEMEA2JVMemberus-gaap:DisposalGroupHeldForSaleOrDisposedOfBySaleNotDiscontinuedOperationsMember2021-06-300001101239us-gaap:EquityMethodInvestmentNonconsolidatedInvesteeOrGroupOfInvesteesMembereqix:EMEA1JointVentureMember2021-06-300001101239us-gaap:EquityMethodInvestmentNonconsolidatedInvesteeOrGroupOfInvesteesMembereqix:EMEA1JointVentureMember2020-12-310001101239us-gaap:EquityMethodInvestmentNonconsolidatedInvesteeOrGroupOfInvesteesMembereqix:AsiaPacificJointVentureMember2021-06-300001101239us-gaap:EquityMethodInvestmentNonconsolidatedInvesteeOrGroupOfInvesteesMembereqix:AsiaPacificJointVentureMember2020-12-310001101239us-gaap:EquityMethodInvestmentNonconsolidatedInvesteeOrGroupOfInvesteesMembereqix:JointVentureMember2021-06-300001101239us-gaap:EquityMethodInvestmentNonconsolidatedInvesteeOrGroupOfInvesteesMembereqix:JointVentureMember2020-12-310001101239eqix:EMEA1JointVentureMember2021-06-300001101239eqix:EquityContributionCommitmentMembereqix:EMEA1JointVentureMember2021-06-300001101239eqix:AsiaPacificJointVentureMemberus-gaap:VariableInterestEntityNotPrimaryBeneficiaryMember2020-12-170001101239eqix:AsiaPacificJointVentureMemberus-gaap:VariableInterestEntityNotPrimaryBeneficiaryMember2021-06-300001101239eqix:AsiaPacificJointVentureMemberus-gaap:VariableInterestEntityNotPrimaryBeneficiaryMember2021-04-012021-06-300001101239eqix:AsiaPacificJointVentureMemberus-gaap:VariableInterestEntityNotPrimaryBeneficiaryMember2021-01-012021-06-300001101239eqix:AsiaPacificJointVentureMembereqix:JointVentureCreditFacilityAgreementMemberus-gaap:VariableInterestEntityNotPrimaryBeneficiaryMember2020-12-310001101239eqix:AsiaPacificJointVentureMembereqix:EquityContributionCommitmentMemberus-gaap:VariableInterestEntityNotPrimaryBeneficiaryMember2021-06-300001101239us-gaap:CorporateJointVentureMembereqix:EMEA1JointVentureMember2021-06-300001101239us-gaap:FairValueInputsLevel3Memberus-gaap:CorporateJointVentureMembereqix:EMEA1JointVentureMember2021-06-300001101239us-gaap:FairValueInputsLevel3Memberus-gaap:CorporateJointVentureMembereqix:EMEA1JointVentureMember2020-12-310001101239us-gaap:CorporateJointVentureMembereqix:SubleaseEquinixsLondon102DataCenterMembereqix:EMEA1JointVentureMember2021-01-012021-06-300001101239us-gaap:CorporateJointVentureMembereqix:SubleaseEquinixsLondon102DataCenterMembereqix:EMEA1JointVentureMember2021-04-012021-06-300001101239us-gaap:CorporateJointVentureMembereqix:SubleaseEquinixsLondon102DataCenterMembereqix:EMEA1JointVentureMember2020-04-012020-06-300001101239us-gaap:CorporateJointVentureMembereqix:SubleaseEquinixsLondon102DataCenterMembereqix:EMEA1JointVentureMember2020-01-012020-06-300001101239us-gaap:CorporateJointVentureMembereqix:SubleaseEquinixsLondon102DataCenterMembereqix:EMEA1JointVentureMember2021-06-300001101239us-gaap:CorporateJointVentureMembereqix:SubleaseEquinixsLondon102DataCenterMembereqix:EMEA1JointVentureMember2020-12-310001101239us-gaap:CorporateJointVentureMembereqix:EMEA1JointVentureMember2020-12-310001101239us-gaap:CorporateJointVentureMembereqix:EMEA1JointVentureMember2021-04-012021-06-300001101239us-gaap:CorporateJointVentureMembereqix:EMEA1JointVentureMember2021-01-012021-06-300001101239us-gaap:CorporateJointVentureMembereqix:EMEA1JointVentureMember2020-04-012020-06-300001101239us-gaap:CorporateJointVentureMembereqix:EMEA1JointVentureMember2020-01-012020-06-300001101239us-gaap:CorporateJointVentureMembereqix:EMEA1JointVentureMembereqix:Frankfurt2DataCenterSiteLandMember2021-06-300001101239us-gaap:DesignatedAsHedgingInstrumentMemberus-gaap:NetInvestmentHedgingMember2021-06-300001101239us-gaap:DesignatedAsHedgingInstrumentMemberus-gaap:NetInvestmentHedgingMember2020-12-310001101239us-gaap:DesignatedAsHedgingInstrumentMemberus-gaap:CrossCurrencyInterestRateContractMember2021-06-300001101239us-gaap:DesignatedAsHedgingInstrumentMemberus-gaap:CrossCurrencyInterestRateContractMember2020-12-310001101239us-gaap:NetInvestmentHedgingMemberus-gaap:DesignatedAsHedgingInstrumentMemberus-gaap:ForeignExchangeForwardMember2021-06-300001101239us-gaap:NetInvestmentHedgingMemberus-gaap:DesignatedAsHedgingInstrumentMemberus-gaap:ForeignExchangeForwardMember2020-12-310001101239eqix:ForeignCurrencyDebtMemberus-gaap:NetInvestmentHedgingMember2021-04-012021-06-300001101239eqix:ForeignCurrencyDebtMemberus-gaap:NetInvestmentHedgingMember2020-04-012020-06-300001101239eqix:ForeignCurrencyDebtMemberus-gaap:NetInvestmentHedgingMember2021-01-012021-06-300001101239eqix:ForeignCurrencyDebtMemberus-gaap:NetInvestmentHedgingMember2020-01-012020-06-300001101239us-gaap:CurrencySwapMemberus-gaap:NetInvestmentHedgingMember2021-04-012021-06-300001101239us-gaap:CurrencySwapMemberus-gaap:NetInvestmentHedgingMember2020-04-012020-06-300001101239us-gaap:CurrencySwapMemberus-gaap:NetInvestmentHedgingMember2021-01-012021-06-300001101239us-gaap:CurrencySwapMemberus-gaap:NetInvestmentHedgingMember2020-01-012020-06-300001101239eqix:ForeignCurrencyForwardContractMemberus-gaap:NetInvestmentHedgingMember2021-04-012021-06-300001101239eqix:ForeignCurrencyForwardContractMemberus-gaap:NetInvestmentHedgingMember2020-04-012020-06-300001101239eqix:ForeignCurrencyForwardContractMemberus-gaap:NetInvestmentHedgingMember2021-01-012021-06-300001101239eqix:ForeignCurrencyForwardContractMemberus-gaap:NetInvestmentHedgingMember2020-01-012020-06-300001101239us-gaap:NetInvestmentHedgingMember2021-04-012021-06-300001101239us-gaap:NetInvestmentHedgingMember2020-04-012020-06-300001101239us-gaap:NetInvestmentHedgingMember2021-01-012021-06-300001101239us-gaap:NetInvestmentHedgingMember2020-01-012020-06-300001101239us-gaap:CurrencySwapMemberus-gaap:NetInvestmentHedgingMemberus-gaap:InterestExpenseMember2021-04-012021-06-300001101239us-gaap:CurrencySwapMemberus-gaap:NetInvestmentHedgingMemberus-gaap:InterestExpenseMember2020-04-012020-06-300001101239us-gaap:CurrencySwapMemberus-gaap:NetInvestmentHedgingMemberus-gaap:InterestExpenseMember2021-01-012021-06-300001101239us-gaap:CurrencySwapMemberus-gaap:NetInvestmentHedgingMemberus-gaap:InterestExpenseMember2020-01-012020-06-300001101239eqix:ForeignCurrencyForwardContractMemberus-gaap:NetInvestmentHedgingMemberus-gaap:InterestExpenseMember2021-04-012021-06-300001101239eqix:ForeignCurrencyForwardContractMemberus-gaap:NetInvestmentHedgingMemberus-gaap:InterestExpenseMember2020-04-012020-06-300001101239eqix:ForeignCurrencyForwardContractMemberus-gaap:NetInvestmentHedgingMemberus-gaap:InterestExpenseMember2021-01-012021-06-300001101239eqix:ForeignCurrencyForwardContractMemberus-gaap:NetInvestmentHedgingMemberus-gaap:InterestExpenseMember2020-01-012020-06-300001101239us-gaap:ForeignExchangeContractMemberus-gaap:CashFlowHedgingMember2021-06-300001101239us-gaap:ForeignExchangeContractMemberus-gaap:CashFlowHedgingMember2020-12-310001101239us-gaap:CashFlowHedgingMemberus-gaap:InterestRateLockCommitmentsMember2021-06-300001101239us-gaap:CashFlowHedgingMemberus-gaap:InterestRateLockCommitmentsMember2020-12-310001101239us-gaap:CashFlowHedgingMemberus-gaap:InterestRateLockCommitmentsMember2021-01-012021-06-300001101239us-gaap:ForeignExchangeContractMemberus-gaap:CashFlowHedgingMember2021-04-012021-06-300001101239us-gaap:ForeignExchangeContractMemberus-gaap:CashFlowHedgingMember2020-04-012020-06-300001101239us-gaap:ForeignExchangeContractMemberus-gaap:CashFlowHedgingMember2021-01-012021-06-300001101239us-gaap:ForeignExchangeContractMemberus-gaap:CashFlowHedgingMember2020-01-012020-06-300001101239us-gaap:ForeignExchangeOptionMemberus-gaap:CashFlowHedgingMember2021-04-012021-06-300001101239us-gaap:ForeignExchangeOptionMemberus-gaap:CashFlowHedgingMember2020-04-012020-06-300001101239us-gaap:ForeignExchangeOptionMemberus-gaap:CashFlowHedgingMember2021-01-012021-06-300001101239us-gaap:ForeignExchangeOptionMemberus-gaap:CashFlowHedgingMember2020-01-012020-06-300001101239us-gaap:CashFlowHedgingMemberus-gaap:InterestRateLockCommitmentsMember2021-04-012021-06-300001101239us-gaap:CashFlowHedgingMemberus-gaap:InterestRateLockCommitmentsMember2020-04-012020-06-300001101239us-gaap:CashFlowHedgingMemberus-gaap:InterestRateLockCommitmentsMember2020-01-012020-06-300001101239us-gaap:CashFlowHedgingMember2021-04-012021-06-300001101239us-gaap:CashFlowHedgingMember2020-04-012020-06-300001101239us-gaap:CashFlowHedgingMember2021-01-012021-06-300001101239us-gaap:CashFlowHedgingMember2020-01-012020-06-300001101239us-gaap:CashFlowHedgingMemberus-gaap:SalesMemberus-gaap:ForeignExchangeForwardMember2021-04-012021-06-300001101239us-gaap:CashFlowHedgingMemberus-gaap:SalesMemberus-gaap:ForeignExchangeForwardMember2020-04-012020-06-300001101239us-gaap:CashFlowHedgingMemberus-gaap:SalesMemberus-gaap:ForeignExchangeForwardMember2021-01-012021-06-300001101239us-gaap:CashFlowHedgingMemberus-gaap:SalesMemberus-gaap:ForeignExchangeForwardMember2020-01-012020-06-300001101239us-gaap:CashFlowHedgingMembereqix:CostOfSalesAndOperatingExpensesMemberus-gaap:ForeignExchangeForwardMember2021-04-012021-06-300001101239us-gaap:CashFlowHedgingMembereqix:CostOfSalesAndOperatingExpensesMemberus-gaap:ForeignExchangeForwardMember2020-04-012020-06-300001101239us-gaap:CashFlowHedgingMembereqix:CostOfSalesAndOperatingExpensesMemberus-gaap:ForeignExchangeForwardMember2021-01-012021-06-300001101239us-gaap:CashFlowHedgingMembereqix:CostOfSalesAndOperatingExpensesMemberus-gaap:ForeignExchangeForwardMember2020-01-012020-06-300001101239us-gaap:CashFlowHedgingMemberus-gaap:InterestRateLockCommitmentsMemberus-gaap:InterestExpenseMember2021-04-012021-06-300001101239us-gaap:CashFlowHedgingMemberus-gaap:InterestRateLockCommitmentsMemberus-gaap:InterestExpenseMember2020-04-012020-06-300001101239us-gaap:CashFlowHedgingMemberus-gaap:InterestRateLockCommitmentsMemberus-gaap:InterestExpenseMember2021-01-012021-06-300001101239us-gaap:CashFlowHedgingMemberus-gaap:InterestRateLockCommitmentsMemberus-gaap:InterestExpenseMember2020-01-012020-06-300001101239us-gaap:CashFlowHedgingMemberus-gaap:ForeignExchangeOptionMemberus-gaap:SalesMember2021-04-012021-06-300001101239us-gaap:CashFlowHedgingMemberus-gaap:ForeignExchangeOptionMemberus-gaap:SalesMember2020-04-012020-06-300001101239us-gaap:CashFlowHedgingMemberus-gaap:ForeignExchangeOptionMemberus-gaap:SalesMember2021-01-012021-06-300001101239us-gaap:CashFlowHedgingMemberus-gaap:ForeignExchangeOptionMemberus-gaap:SalesMember2020-01-012020-06-300001101239eqix:ForeignCurrencyForwardContractMemberus-gaap:NondesignatedMember2021-06-300001101239eqix:ForeignCurrencyForwardContractMemberus-gaap:NondesignatedMember2020-12-310001101239us-gaap:EmbeddedDerivativeFinancialInstrumentsMemberus-gaap:SalesMember2021-04-012021-06-300001101239us-gaap:EmbeddedDerivativeFinancialInstrumentsMemberus-gaap:SalesMember2020-04-012020-06-300001101239us-gaap:EmbeddedDerivativeFinancialInstrumentsMemberus-gaap:SalesMember2021-01-012021-06-300001101239us-gaap:EmbeddedDerivativeFinancialInstrumentsMemberus-gaap:SalesMember2020-01-012020-06-300001101239eqix:EmbeddedDerivativeEconomicHedgeMemberus-gaap:SalesMember2021-04-012021-06-300001101239eqix:EmbeddedDerivativeEconomicHedgeMemberus-gaap:SalesMember2020-04-012020-06-300001101239eqix:EmbeddedDerivativeEconomicHedgeMemberus-gaap:SalesMember2021-01-012021-06-300001101239eqix:EmbeddedDerivativeEconomicHedgeMemberus-gaap:SalesMember2020-01-012020-06-300001101239eqix:ForeignCurrencyForwardContractMemberus-gaap:OtherOperatingIncomeExpenseMember2021-04-012021-06-300001101239eqix:ForeignCurrencyForwardContractMemberus-gaap:OtherOperatingIncomeExpenseMember2020-04-012020-06-300001101239eqix:ForeignCurrencyForwardContractMemberus-gaap:OtherOperatingIncomeExpenseMember2021-01-012021-06-300001101239eqix:ForeignCurrencyForwardContractMemberus-gaap:OtherOperatingIncomeExpenseMember2020-01-012020-06-300001101239us-gaap:ForeignExchangeContractMemberus-gaap:DesignatedAsHedgingInstrumentMemberus-gaap:FairValueMeasurementsRecurringMember2021-06-300001101239us-gaap:ForeignExchangeContractMemberus-gaap:DesignatedAsHedgingInstrumentMemberus-gaap:FairValueMeasurementsRecurringMember2020-12-310001101239us-gaap:CurrencySwapMemberus-gaap:DesignatedAsHedgingInstrumentMemberus-gaap:FairValueMeasurementsRecurringMember2021-06-300001101239us-gaap:CurrencySwapMemberus-gaap:DesignatedAsHedgingInstrumentMemberus-gaap:FairValueMeasurementsRecurringMember2020-12-310001101239eqix:ForeignCurrencyForwardContractMemberus-gaap:DesignatedAsHedgingInstrumentMemberus-gaap:FairValueMeasurementsRecurringMember2021-06-300001101239eqix:ForeignCurrencyForwardContractMemberus-gaap:DesignatedAsHedgingInstrumentMemberus-gaap:FairValueMeasurementsRecurringMember2020-12-310001101239us-gaap:DesignatedAsHedgingInstrumentMemberus-gaap:FairValueMeasurementsRecurringMember2021-06-300001101239us-gaap:DesignatedAsHedgingInstrumentMemberus-gaap:FairValueMeasurementsRecurringMember2020-12-310001101239us-gaap:NondesignatedMemberus-gaap:EmbeddedDerivativeFinancialInstrumentsMemberus-gaap:FairValueMeasurementsRecurringMember2021-06-300001101239us-gaap:NondesignatedMemberus-gaap:EmbeddedDerivativeFinancialInstrumentsMemberus-gaap:FairValueMeasurementsRecurringMember2020-12-310001101239eqix:EmbeddedDerivativeEconomicHedgeMemberus-gaap:NondesignatedMemberus-gaap:FairValueMeasurementsRecurringMember2021-06-300001101239eqix:EmbeddedDerivativeEconomicHedgeMemberus-gaap:NondesignatedMemberus-gaap:FairValueMeasurementsRecurringMember2020-12-310001101239eqix:ForeignCurrencyForwardContractMemberus-gaap:NondesignatedMemberus-gaap:FairValueMeasurementsRecurringMember2021-06-300001101239eqix:ForeignCurrencyForwardContractMemberus-gaap:NondesignatedMemberus-gaap:FairValueMeasurementsRecurringMember2020-12-310001101239us-gaap:NondesignatedMemberus-gaap:FairValueMeasurementsRecurringMember2021-06-300001101239us-gaap:NondesignatedMemberus-gaap:FairValueMeasurementsRecurringMember2020-12-310001101239us-gaap:FairValueMeasurementsRecurringMember2021-06-300001101239us-gaap:FairValueMeasurementsRecurringMember2020-12-310001101239us-gaap:MoneyMarketFundsMemberus-gaap:FairValueMeasurementsRecurringMember2021-06-300001101239us-gaap:FairValueInputsLevel1Memberus-gaap:MoneyMarketFundsMemberus-gaap:FairValueMeasurementsRecurringMember2021-06-300001101239us-gaap:FairValueInputsLevel2Memberus-gaap:MoneyMarketFundsMemberus-gaap:FairValueMeasurementsRecurringMember2021-06-300001101239us-gaap:MoneyMarketFundsMemberus-gaap:FairValueMeasurementsRecurringMember2020-12-310001101239us-gaap:FairValueInputsLevel1Memberus-gaap:MoneyMarketFundsMemberus-gaap:FairValueMeasurementsRecurringMember2020-12-310001101239us-gaap:FairValueInputsLevel2Memberus-gaap:MoneyMarketFundsMemberus-gaap:FairValueMeasurementsRecurringMember2020-12-310001101239us-gaap:FairValueInputsLevel1Memberus-gaap:FairValueMeasurementsRecurringMember2021-06-300001101239us-gaap:FairValueInputsLevel2Memberus-gaap:FairValueMeasurementsRecurringMember2021-06-300001101239us-gaap:FairValueInputsLevel1Memberus-gaap:FairValueMeasurementsRecurringMember2020-12-310001101239us-gaap:FairValueInputsLevel2Memberus-gaap:FairValueMeasurementsRecurringMember2020-12-310001101239us-gaap:CertificatesOfDepositMemberus-gaap:FairValueMeasurementsRecurringMember2021-06-300001101239us-gaap:CertificatesOfDepositMemberus-gaap:FairValueInputsLevel1Memberus-gaap:FairValueMeasurementsRecurringMember2021-06-300001101239us-gaap:FairValueInputsLevel2Memberus-gaap:CertificatesOfDepositMemberus-gaap:FairValueMeasurementsRecurringMember2021-06-300001101239us-gaap:CertificatesOfDepositMemberus-gaap:FairValueMeasurementsRecurringMember2020-12-310001101239us-gaap:CertificatesOfDepositMemberus-gaap:FairValueInputsLevel1Memberus-gaap:FairValueMeasurementsRecurringMember2020-12-310001101239us-gaap:FairValueInputsLevel2Memberus-gaap:CertificatesOfDepositMemberus-gaap:FairValueMeasurementsRecurringMember2020-12-310001101239eqix:SiliconValley8DataCenterMember2021-01-012021-03-31eqix:option0001101239eqix:SiliconValley8DataCenterMember2021-03-310001101239eqix:HongKong3DataCenterMember2021-01-012021-03-310001101239eqix:HongKong3DataCenterMember2021-03-310001101239eqix:HongKong3DataCenterMemberus-gaap:BuildingMember2021-03-310001101239eqix:HongKong3DataCenterMemberus-gaap:LandMember2021-03-310001101239eqix:Osaka3DataCenterAndOfficeLeaseMember2021-06-300001101239srt:MinimumMember2021-01-012021-06-300001101239srt:MaximumMember2021-01-012021-06-300001101239eqix:TermLoanFacilityMember2021-06-300001101239eqix:TermLoanFacilityMember2020-12-310001101239eqix:MortgagePayableAndOtherLoansPayableMember2021-06-300001101239eqix:MortgagePayableAndOtherLoansPayableMember2020-12-310001101239us-gaap:MortgagesMember2021-06-300001101239us-gaap:MortgagesMember2020-12-310001101239us-gaap:LineOfCreditMember2017-12-310001101239us-gaap:RevolvingCreditFacilityMemberus-gaap:LineOfCreditMember2017-12-310001101239us-gaap:LineOfCreditMemberus-gaap:UnsecuredDebtMember2017-12-310001101239eqix:JPYUnsecuredTermLoanMemberus-gaap:LineOfCreditMemberus-gaap:UnsecuredDebtMember2017-12-310001101239eqix:SEKUnsecuredTermLoanMemberus-gaap:UnsecuredDebtMember2021-05-172021-05-170001101239eqix:JPYUnsecuredTermLoanMemberus-gaap:UnsecuredDebtMember2021-05-172021-05-170001101239us-gaap:LineOfCreditMemberus-gaap:UnsecuredDebtMember2021-06-300001101239us-gaap:LineOfCreditMemberus-gaap:UnsecuredDebtMember2020-12-31eqix:credit0001101239us-gaap:LetterOfCreditMemberus-gaap:LineOfCreditMember2021-06-300001101239us-gaap:RevolvingCreditFacilityMemberus-gaap:LineOfCreditMember2021-06-300001101239us-gaap:SeniorNotesMembereqix:FivePointZeroPercentInfomartSeniorNotesMember2021-06-300001101239us-gaap:SeniorNotesMembereqix:FivePointZeroPercentInfomartSeniorNotesMember2020-12-310001101239eqix:TwoPointSixTwoFiveSeniorNotesDueInTwoThousandTwentyFourMemberus-gaap:SeniorNotesMember2021-06-300001101239eqix:TwoPointSixTwoFiveSeniorNotesDueInTwoThousandTwentyFourMemberus-gaap:SeniorNotesMember2020-12-310001101239eqix:OnePointTwoFiveZeroPercentSeniorNotesDueTwoThousandTwentyFiveMemberus-gaap:SeniorNotesMember2021-06-300001101239eqix:OnePointTwoFiveZeroPercentSeniorNotesDueTwoThousandTwentyFiveMemberus-gaap:SeniorNotesMember2020-12-310001101239eqix:OnePointZeroZeroZeroPercentSeniorNotesDueTwentyTwentyFiveMemberus-gaap:SeniorNotesMember2021-06-300001101239eqix:OnePointZeroZeroZeroPercentSeniorNotesDueTwentyTwentyFiveMemberus-gaap:SeniorNotesMember2020-12-310001101239eqix:TwoPointNineZeroZeroSeniorNotesDueTwoThousandTwentySixMemberus-gaap:SeniorNotesMember2021-06-300001101239eqix:TwoPointNineZeroZeroSeniorNotesDueTwoThousandTwentySixMemberus-gaap:SeniorNotesMember2020-12-310001101239us-gaap:SeniorNotesMembereqix:TwoPointEightSevenFivePercentEuroSeniorNotesDueTwoThousandTwentySixMember2021-06-300001101239us-gaap:SeniorNotesMembereqix:TwoPointEightSevenFivePercentEuroSeniorNotesDueTwoThousandTwentySixMember2020-12-310001101239us-gaap:SeniorNotesMembereqix:OnePointFourFiveZeroPercentSeniorNotesDueTwoThousandTwentySixMember2021-06-300001101239us-gaap:SeniorNotesMembereqix:OnePointFourFiveZeroPercentSeniorNotesDueTwoThousandTwentySixMember2020-12-310001101239eqix:ZeroPointTwoFiveZeroPercentEuroSeniorNotesDueTwoThousandTwentySevenMemberus-gaap:SeniorNotesMember2021-06-300001101239eqix:ZeroPointTwoFiveZeroPercentEuroSeniorNotesDueTwoThousandTwentySevenMemberus-gaap:SeniorNotesMember2020-12-310001101239eqix:OnePointEightPercentSeniorNotesDueTwoThousandTwentySevenMemberus-gaap:SeniorNotesMember2021-06-300001101239eqix:OnePointEightPercentSeniorNotesDueTwoThousandTwentySevenMemberus-gaap:SeniorNotesMember2020-12-310001101239eqix:FivePointThreeSevenFivePercentSeniorNotesDueTwoThousandTwentySevenMemberus-gaap:SeniorNotesMember2021-06-300001101239eqix:FivePointThreeSevenFivePercentSeniorNotesDueTwoThousandTwentySevenMemberus-gaap:SeniorNotesMember2020-12-310001101239us-gaap:SeniorNotesMembereqix:OnePointFiveFiveZeroPercentNotesDueTwoThousandTwentyEightMember2021-06-300001101239us-gaap:SeniorNotesMembereqix:OnePointFiveFiveZeroPercentNotesDueTwoThousandTwentyEightMember2020-12-310001101239eqix:TwoPointZeroZeroZeroPercentSeniorNotesDueTwoThousandTwentyEightMemberus-gaap:SeniorNotesMember2021-06-300001101239eqix:TwoPointZeroZeroZeroPercentSeniorNotesDueTwoThousandTwentyEightMemberus-gaap:SeniorNotesMember2020-12-310001101239eqix:ThreePointTwoZeroZeroPercentSeniorNotesDueInTwoThousandTwentyNineMemberus-gaap:SeniorNotesMember2021-06-300001101239eqix:ThreePointTwoZeroZeroPercentSeniorNotesDueInTwoThousandTwentyNineMemberus-gaap:SeniorNotesMember2020-12-310001101239us-gaap:SeniorNotesMembereqix:TwoPointOneFiveZeroPercentSeniorNotesDueTwoThousandThirtyMember2021-06-300001101239us-gaap:SeniorNotesMembereqix:TwoPointOneFiveZeroPercentSeniorNotesDueTwoThousandThirtyMember2020-12-310001101239us-gaap:SeniorNotesMembereqix:TwoPointFiveZeroZeroPercentSeniorNotesDueTwoThousandThirtyOneMember2021-06-300001101239us-gaap:SeniorNotesMembereqix:TwoPointFiveZeroZeroPercentSeniorNotesDueTwoThousandThirtyOneMember2020-12-310001101239us-gaap:SeniorNotesMembereqix:OnePointZeroZeroZeroPercentEuroSeniorNotesDueTwoThousandThirtyThreeMember2021-06-300001101239us-gaap:SeniorNotesMembereqix:OnePointZeroZeroZeroPercentEuroSeniorNotesDueTwoThousandThirtyThreeMember2020-12-310001101239us-gaap:SeniorNotesMembereqix:ThreePointZeroPercentSeniorNotesDueTwoThousandFiftyMember2021-06-300001101239us-gaap:SeniorNotesMembereqix:ThreePointZeroPercentSeniorNotesDueTwoThousandFiftyMember2020-12-310001101239us-gaap:SeniorNotesMembereqix:TwoPointNineFiveZeroPercentSeniorNotesDueTwoThousandFiftyOneMember2021-06-300001101239us-gaap:SeniorNotesMembereqix:TwoPointNineFiveZeroPercentSeniorNotesDueTwoThousandFiftyOneMember2020-12-310001101239us-gaap:SeniorNotesMembereqix:ThreePointFourZeroZeroPercentSeniorNotesDueTwoThousandFiftyTwoMember2021-06-300001101239us-gaap:SeniorNotesMembereqix:ThreePointFourZeroZeroPercentSeniorNotesDueTwoThousandFiftyTwoMember2020-12-310001101239us-gaap:SeniorNotesMember2021-06-300001101239us-gaap:SeniorNotesMember2020-12-310001101239eqix:ZeroPointTwoFiveZeroPercentEuroSeniorNotesDueTwoThousandTwentySevenMemberus-gaap:SeniorNotesMember2021-03-100001101239us-gaap:SeniorNotesMembereqix:OnePointZeroZeroZeroPercentEuroSeniorNotesDueTwoThousandThirtyThreeMember2021-03-10iso4217:EUR0001101239eqix:ZeroPointTwoFiveZeroPercentEuroSeniorNotesDueTwoThousandTwentySevenMemberus-gaap:SeniorNotesMember2021-03-150001101239us-gaap:SeniorNotesMembereqix:OnePointZeroZeroZeroPercentEuroSeniorNotesDueTwoThousandThirtyThreeMember2021-03-150001101239us-gaap:SeniorNotesMembereqix:TwoPointEightSevenFivePercentEuroSeniorNotesDueTwoThousandTwentySixMember2021-03-240001101239us-gaap:SeniorNotesMembereqix:TwoPointEightSevenFivePercentEuroSeniorNotesDueTwoThousandTwentySixMember2021-03-242021-03-240001101239us-gaap:SeniorNotesMembereqix:TwoPointEightSevenFivePercentEuroSeniorNotesDueTwoThousandTwentySixMember2021-01-012021-03-310001101239us-gaap:SeniorNotesMembereqix:OnePointFourFiveZeroPercentSeniorNotesDueTwoThousandTwentySixMember2021-05-170001101239eqix:TwoPointZeroZeroZeroPercentSeniorNotesDueTwoThousandTwentyEightMemberus-gaap:SeniorNotesMember2021-05-170001101239us-gaap:SeniorNotesMembereqix:TwoPointFiveZeroZeroPercentSeniorNotesDueTwoThousandThirtyOneMember2021-05-170001101239us-gaap:SeniorNotesMembereqix:ThreePointFourZeroZeroPercentSeniorNotesDueTwoThousandFiftyTwoMember2021-05-170001101239us-gaap:SeniorNotesMembereqix:OnePointFourFiveZeroPercentSeniorNotesDueTwoThousandTwentySixMember2021-05-150001101239eqix:TwoPointZeroZeroZeroPercentSeniorNotesDueTwoThousandTwentyEightMemberus-gaap:SeniorNotesMember2021-05-150001101239us-gaap:SeniorNotesMembereqix:TwoPointFiveZeroZeroPercentSeniorNotesDueTwoThousandThirtyOneMember2021-05-150001101239us-gaap:SeniorNotesMembereqix:ThreePointFourZeroZeroPercentSeniorNotesDueTwoThousandFiftyTwoMember2021-05-150001101239eqix:FivePointThreeSevenFivePercentSeniorNotesDueTwoThousandTwentySevenMemberus-gaap:SeniorNotesMember2021-06-020001101239eqix:FivePointThreeSevenFivePercentSeniorNotesDueTwoThousandTwentySevenMemberus-gaap:SeniorNotesMember2021-06-022021-06-020001101239us-gaap:CapitalAdditionsMember2021-06-300001101239eqix:MiscellaneousPurchaseCommitmentsMember2021-06-300001101239us-gaap:IndemnificationGuaranteeMember2021-06-300001101239eqix:IndemnificationAgreementTwoMember2021-06-300001101239eqix:IndemnificationAgreementThreeMember2021-06-300001101239eqix:ServiceLevelCreditsAgreementMember2021-06-300001101239us-gaap:CommonStockMember2020-12-310001101239us-gaap:TreasuryStockMember2020-12-310001101239us-gaap:AdditionalPaidInCapitalMember2020-12-310001101239us-gaap:AccumulatedDistributionsInExcessOfNetIncomeMember2020-12-310001101239us-gaap:AccumulatedOtherComprehensiveIncomeMember2020-12-310001101239us-gaap:RetainedEarningsMember2020-12-310001101239us-gaap:ParentMember2020-12-310001101239us-gaap:NoncontrollingInterestMember2020-12-310001101239us-gaap:RetainedEarningsMember2021-01-012021-03-310001101239us-gaap:ParentMember2021-01-012021-03-310001101239us-gaap:NoncontrollingInterestMember2021-01-012021-03-3100011012392021-01-012021-03-310001101239us-gaap:AccumulatedOtherComprehensiveIncomeMember2021-01-012021-03-310001101239us-gaap:CommonStockMember2021-01-012021-03-310001101239us-gaap:TreasuryStockMember2021-01-012021-03-310001101239us-gaap:AdditionalPaidInCapitalMember2021-01-012021-03-310001101239us-gaap:AccumulatedDistributionsInExcessOfNetIncomeMember2021-01-012021-03-310001101239us-gaap:CommonStockMember2021-03-310001101239us-gaap:TreasuryStockMember2021-03-310001101239us-gaap:AdditionalPaidInCapitalMember2021-03-310001101239us-gaap:AccumulatedDistributionsInExcessOfNetIncomeMember2021-03-310001101239us-gaap:AccumulatedOtherComprehensiveIncomeMember2021-03-310001101239us-gaap:RetainedEarningsMember2021-03-310001101239us-gaap:ParentMember2021-03-310001101239us-gaap:NoncontrollingInterestMember2021-03-3100011012392021-03-310001101239us-gaap:RetainedEarningsMember2021-04-012021-06-300001101239us-gaap:ParentMember2021-04-012021-06-300001101239us-gaap:NoncontrollingInterestMember2021-04-012021-06-300001101239us-gaap:AccumulatedOtherComprehensiveIncomeMember2021-04-012021-06-300001101239us-gaap:CommonStockMember2021-04-012021-06-300001101239us-gaap:TreasuryStockMember2021-04-012021-06-300001101239us-gaap:AdditionalPaidInCapitalMember2021-04-012021-06-300001101239eqix:ATMProgramMemberus-gaap:CommonStockMember2021-04-012021-06-300001101239eqix:ATMProgramMemberus-gaap:AdditionalPaidInCapitalMember2021-04-012021-06-300001101239eqix:ATMProgramMemberus-gaap:ParentMember2021-04-012021-06-300001101239eqix:ATMProgramMember2021-04-012021-06-300001101239us-gaap:AccumulatedDistributionsInExcessOfNetIncomeMember2021-04-012021-06-300001101239us-gaap:CommonStockMember2021-06-300001101239us-gaap:TreasuryStockMember2021-06-300001101239us-gaap:AdditionalPaidInCapitalMember2021-06-300001101239us-gaap:AccumulatedDistributionsInExcessOfNetIncomeMember2021-06-300001101239us-gaap:AccumulatedOtherComprehensiveIncomeMember2021-06-300001101239us-gaap:RetainedEarningsMember2021-06-300001101239us-gaap:ParentMember2021-06-300001101239us-gaap:NoncontrollingInterestMember2021-06-300001101239us-gaap:CommonStockMember2019-12-310001101239us-gaap:TreasuryStockMember2019-12-310001101239us-gaap:AdditionalPaidInCapitalMember2019-12-310001101239us-gaap:AccumulatedDistributionsInExcessOfNetIncomeMember2019-12-310001101239us-gaap:AccumulatedOtherComprehensiveIncomeMember2019-12-310001101239us-gaap:RetainedEarningsMember2019-12-310001101239us-gaap:ParentMember2019-12-310001101239us-gaap:NoncontrollingInterestMember2019-12-310001101239us-gaap:RetainedEarningsMembersrt:CumulativeEffectPeriodOfAdoptionAdjustmentMember2019-12-310001101239us-gaap:ParentMembersrt:CumulativeEffectPeriodOfAdoptionAdjustmentMember2019-12-310001101239srt:CumulativeEffectPeriodOfAdoptionAdjustmentMember2019-12-310001101239us-gaap:RetainedEarningsMember2020-01-012020-03-310001101239us-gaap:ParentMember2020-01-012020-03-310001101239us-gaap:NoncontrollingInterestMember2020-01-012020-03-3100011012392020-01-012020-03-310001101239us-gaap:AccumulatedOtherComprehensiveIncomeMember2020-01-012020-03-310001101239us-gaap:CommonStockMember2020-01-012020-03-310001101239us-gaap:TreasuryStockMember2020-01-012020-03-310001101239us-gaap:AdditionalPaidInCapitalMember2020-01-012020-03-310001101239eqix:ATMProgramMemberus-gaap:CommonStockMember2020-01-012020-03-310001101239eqix:ATMProgramMemberus-gaap:AdditionalPaidInCapitalMember2020-01-012020-03-310001101239eqix:ATMProgramMemberus-gaap:ParentMember2020-01-012020-03-310001101239eqix:ATMProgramMember2020-01-012020-03-310001101239us-gaap:AccumulatedDistributionsInExcessOfNetIncomeMember2020-01-012020-03-310001101239us-gaap:CommonStockMember2020-03-310001101239us-gaap:TreasuryStockMember2020-03-310001101239us-gaap:AdditionalPaidInCapitalMember2020-03-310001101239us-gaap:AccumulatedDistributionsInExcessOfNetIncomeMember2020-03-310001101239us-gaap:AccumulatedOtherComprehensiveIncomeMember2020-03-310001101239us-gaap:RetainedEarningsMember2020-03-310001101239us-gaap:ParentMember2020-03-310001101239us-gaap:NoncontrollingInterestMember2020-03-3100011012392020-03-310001101239us-gaap:RetainedEarningsMember2020-04-012020-06-300001101239us-gaap:ParentMember2020-04-012020-06-300001101239us-gaap:NoncontrollingInterestMember2020-04-012020-06-300001101239us-gaap:AccumulatedOtherComprehensiveIncomeMember2020-04-012020-06-300001101239us-gaap:CommonStockMember2020-04-012020-06-300001101239us-gaap:TreasuryStockMember2020-04-012020-06-300001101239us-gaap:AdditionalPaidInCapitalMember2020-04-012020-06-300001101239eqix:PublicOfferingMemberus-gaap:CommonStockMember2020-04-012020-06-300001101239eqix:PublicOfferingMemberus-gaap:AdditionalPaidInCapitalMember2020-04-012020-06-300001101239us-gaap:ParentMembereqix:PublicOfferingMember2020-04-012020-06-300001101239eqix:PublicOfferingMember2020-04-012020-06-300001101239us-gaap:AccumulatedDistributionsInExcessOfNetIncomeMember2020-04-012020-06-300001101239us-gaap:CommonStockMember2020-06-300001101239us-gaap:TreasuryStockMember2020-06-300001101239us-gaap:AdditionalPaidInCapitalMember2020-06-300001101239us-gaap:AccumulatedDistributionsInExcessOfNetIncomeMember2020-06-300001101239us-gaap:AccumulatedOtherComprehensiveIncomeMember2020-06-300001101239us-gaap:RetainedEarningsMember2020-06-300001101239us-gaap:ParentMember2020-06-300001101239us-gaap:NoncontrollingInterestMember2020-06-300001101239us-gaap:AccumulatedTranslationAdjustmentMember2020-12-310001101239us-gaap:AccumulatedTranslationAdjustmentMember2021-01-012021-06-300001101239us-gaap:AccumulatedTranslationAdjustmentMember2021-06-300001101239us-gaap:AccumulatedGainLossNetCashFlowHedgeParentMember2020-12-310001101239us-gaap:AccumulatedGainLossNetCashFlowHedgeParentMember2021-01-012021-06-300001101239us-gaap:AccumulatedGainLossNetCashFlowHedgeParentMember2021-06-300001101239eqix:AccumulatedForeignCurrencyGainLossNetInvestmentHedgesAttributabletoParentMember2020-12-310001101239eqix:AccumulatedForeignCurrencyGainLossNetInvestmentHedgesAttributabletoParentMember2021-01-012021-06-300001101239eqix:AccumulatedForeignCurrencyGainLossNetInvestmentHedgesAttributabletoParentMember2021-06-300001101239us-gaap:AccumulatedDefinedBenefitPlansAdjustmentNetUnamortizedGainLossMember2020-12-310001101239us-gaap:AccumulatedDefinedBenefitPlansAdjustmentNetUnamortizedGainLossMember2021-01-012021-06-300001101239us-gaap:AccumulatedDefinedBenefitPlansAdjustmentNetUnamortizedGainLossMember2021-06-300001101239us-gaap:AccumulatedOtherComprehensiveIncomeMember2021-01-012021-06-30eqix:planeqix:country0001101239eqix:A2020ATMProgramMember2020-10-310001101239eqix:A2020ATMProgramMember2021-01-012021-06-300001101239eqix:A2020ATMProgramMember2021-06-300001101239eqix:LegacyATMProgramMember2020-04-012020-06-300001101239eqix:LegacyATMProgramMember2020-01-012020-06-3000011012392020-05-012020-05-310001101239us-gaap:RestrictedStockUnitsRSUMember2021-01-012021-06-300001101239us-gaap:CostOfSalesMember2021-04-012021-06-300001101239us-gaap:CostOfSalesMember2020-04-012020-06-300001101239us-gaap:CostOfSalesMember2021-01-012021-06-300001101239us-gaap:CostOfSalesMember2020-01-012020-06-300001101239us-gaap:SellingAndMarketingExpenseMember2021-04-012021-06-300001101239us-gaap:SellingAndMarketingExpenseMember2020-04-012020-06-300001101239us-gaap:SellingAndMarketingExpenseMember2021-01-012021-06-300001101239us-gaap:SellingAndMarketingExpenseMember2020-01-012020-06-300001101239us-gaap:GeneralAndAdministrativeExpenseMember2021-04-012021-06-300001101239us-gaap:GeneralAndAdministrativeExpenseMember2020-04-012020-06-300001101239us-gaap:GeneralAndAdministrativeExpenseMember2021-01-012021-06-300001101239us-gaap:GeneralAndAdministrativeExpenseMember2020-01-012020-06-30eqix:segment0001101239srt:AmericasMembereqix:ColocationMember2021-04-012021-06-300001101239us-gaap:EMEAMembereqix:ColocationMember2021-04-012021-06-300001101239srt:AsiaPacificMembereqix:ColocationMember2021-04-012021-06-300001101239eqix:ColocationMember2021-04-012021-06-300001101239srt:AmericasMembereqix:ColocationMember2021-01-012021-06-300001101239us-gaap:EMEAMembereqix:ColocationMember2021-01-012021-06-300001101239srt:AsiaPacificMembereqix:ColocationMember2021-01-012021-06-300001101239eqix:ColocationMember2021-01-012021-06-300001101239srt:AmericasMembereqix:InterconnectionMember2021-04-012021-06-300001101239us-gaap:EMEAMembereqix:InterconnectionMember2021-04-012021-06-300001101239srt:AsiaPacificMembereqix:InterconnectionMember2021-04-012021-06-300001101239eqix:InterconnectionMember2021-04-012021-06-300001101239srt:AmericasMembereqix:InterconnectionMember2021-01-012021-06-300001101239us-gaap:EMEAMembereqix:InterconnectionMember2021-01-012021-06-300001101239srt:AsiaPacificMembereqix:InterconnectionMember2021-01-012021-06-300001101239eqix:InterconnectionMember2021-01-012021-06-300001101239srt:AmericasMembereqix:ManagedInfrastructureMember2021-04-012021-06-300001101239us-gaap:EMEAMembereqix:ManagedInfrastructureMember2021-04-012021-06-300001101239srt:AsiaPacificMembereqix:ManagedInfrastructureMember2021-04-012021-06-300001101239eqix:ManagedInfrastructureMember2021-04-012021-06-300001101239srt:AmericasMembereqix:ManagedInfrastructureMember2021-01-012021-06-300001101239us-gaap:EMEAMembereqix:ManagedInfrastructureMember2021-01-012021-06-300001101239srt:AsiaPacificMembereqix:ManagedInfrastructureMember2021-01-012021-06-300001101239eqix:ManagedInfrastructureMember2021-01-012021-06-300001101239us-gaap:ServiceOtherMembersrt:AmericasMember2021-04-012021-06-300001101239us-gaap:EMEAMemberus-gaap:ServiceOtherMember2021-04-012021-06-300001101239us-gaap:ServiceOtherMembersrt:AsiaPacificMember2021-04-012021-06-300001101239us-gaap:ServiceOtherMember2021-04-012021-06-300001101239us-gaap:ServiceOtherMembersrt:AmericasMember2021-01-012021-06-300001101239us-gaap:EMEAMemberus-gaap:ServiceOtherMember2021-01-012021-06-300001101239us-gaap:ServiceOtherMembersrt:AsiaPacificMember2021-01-012021-06-300001101239us-gaap:ServiceOtherMember2021-01-012021-06-300001101239srt:AmericasMembereqix:RecurringRevenuesMember2021-04-012021-06-300001101239us-gaap:EMEAMembereqix:RecurringRevenuesMember2021-04-012021-06-300001101239srt:AsiaPacificMembereqix:RecurringRevenuesMember2021-04-012021-06-300001101239eqix:RecurringRevenuesMember2021-04-012021-06-300001101239srt:AmericasMembereqix:RecurringRevenuesMember2021-01-012021-06-300001101239us-gaap:EMEAMembereqix:RecurringRevenuesMember2021-01-012021-06-300001101239srt:AsiaPacificMembereqix:RecurringRevenuesMember2021-01-012021-06-300001101239eqix:RecurringRevenuesMember2021-01-012021-06-300001101239eqix:NonRecurringRevenuesMembersrt:AmericasMember2021-04-012021-06-300001101239us-gaap:EMEAMembereqix:NonRecurringRevenuesMember2021-04-012021-06-300001101239eqix:NonRecurringRevenuesMembersrt:AsiaPacificMember2021-04-012021-06-300001101239eqix:NonRecurringRevenuesMember2021-04-012021-06-300001101239eqix:NonRecurringRevenuesMembersrt:AmericasMember2021-01-012021-06-300001101239us-gaap:EMEAMembereqix:NonRecurringRevenuesMember2021-01-012021-06-300001101239eqix:NonRecurringRevenuesMembersrt:AsiaPacificMember2021-01-012021-06-300001101239eqix:NonRecurringRevenuesMember2021-01-012021-06-300001101239srt:AmericasMember2021-04-012021-06-300001101239us-gaap:EMEAMember2021-04-012021-06-300001101239srt:AsiaPacificMember2021-04-012021-06-300001101239srt:AmericasMember2021-01-012021-06-300001101239us-gaap:EMEAMember2021-01-012021-06-300001101239srt:AsiaPacificMember2021-01-012021-06-300001101239srt:AmericasMembereqix:ColocationMember2020-04-012020-06-300001101239us-gaap:EMEAMembereqix:ColocationMember2020-04-012020-06-300001101239srt:AsiaPacificMembereqix:ColocationMember2020-04-012020-06-300001101239eqix:ColocationMember2020-04-012020-06-300001101239srt:AmericasMembereqix:ColocationMember2020-01-012020-06-300001101239us-gaap:EMEAMembereqix:ColocationMember2020-01-012020-06-300001101239srt:AsiaPacificMembereqix:ColocationMember2020-01-012020-06-300001101239eqix:ColocationMember2020-01-012020-06-300001101239srt:AmericasMembereqix:InterconnectionMember2020-04-012020-06-300001101239us-gaap:EMEAMembereqix:InterconnectionMember2020-04-012020-06-300001101239srt:AsiaPacificMembereqix:InterconnectionMember2020-04-012020-06-300001101239eqix:InterconnectionMember2020-04-012020-06-300001101239srt:AmericasMembereqix:InterconnectionMember2020-01-012020-06-300001101239us-gaap:EMEAMembereqix:InterconnectionMember2020-01-012020-06-300001101239srt:AsiaPacificMembereqix:InterconnectionMember2020-01-012020-06-300001101239eqix:InterconnectionMember2020-01-012020-06-300001101239srt:AmericasMembereqix:ManagedInfrastructureMember2020-04-012020-06-300001101239us-gaap:EMEAMembereqix:ManagedInfrastructureMember2020-04-012020-06-300001101239srt:AsiaPacificMembereqix:ManagedInfrastructureMember2020-04-012020-06-300001101239eqix:ManagedInfrastructureMember2020-04-012020-06-300001101239srt:AmericasMembereqix:ManagedInfrastructureMember2020-01-012020-06-300001101239us-gaap:EMEAMembereqix:ManagedInfrastructureMember2020-01-012020-06-300001101239srt:AsiaPacificMembereqix:ManagedInfrastructureMember2020-01-012020-06-300001101239eqix:ManagedInfrastructureMember2020-01-012020-06-300001101239us-gaap:ServiceOtherMembersrt:AmericasMember2020-04-012020-06-300001101239us-gaap:EMEAMemberus-gaap:ServiceOtherMember2020-04-012020-06-300001101239us-gaap:ServiceOtherMembersrt:AsiaPacificMember2020-04-012020-06-300001101239us-gaap:ServiceOtherMember2020-04-012020-06-300001101239us-gaap:ServiceOtherMembersrt:AmericasMember2020-01-012020-06-300001101239us-gaap:EMEAMemberus-gaap:ServiceOtherMember2020-01-012020-06-300001101239us-gaap:ServiceOtherMembersrt:AsiaPacificMember2020-01-012020-06-300001101239us-gaap:ServiceOtherMember2020-01-012020-06-300001101239srt:AmericasMembereqix:RecurringRevenuesMember2020-04-012020-06-300001101239us-gaap:EMEAMembereqix:RecurringRevenuesMember2020-04-012020-06-300001101239srt:AsiaPacificMembereqix:RecurringRevenuesMember2020-04-012020-06-300001101239eqix:RecurringRevenuesMember2020-04-012020-06-300001101239srt:AmericasMembereqix:RecurringRevenuesMember2020-01-012020-06-300001101239us-gaap:EMEAMembereqix:RecurringRevenuesMember2020-01-012020-06-300001101239srt:AsiaPacificMembereqix:RecurringRevenuesMember2020-01-012020-06-300001101239eqix:RecurringRevenuesMember2020-01-012020-06-300001101239eqix:NonRecurringRevenuesMembersrt:AmericasMember2020-04-012020-06-300001101239us-gaap:EMEAMembereqix:NonRecurringRevenuesMember2020-04-012020-06-300001101239eqix:NonRecurringRevenuesMembersrt:AsiaPacificMember2020-04-012020-06-300001101239eqix:NonRecurringRevenuesMember2020-04-012020-06-300001101239eqix:NonRecurringRevenuesMembersrt:AmericasMember2020-01-012020-06-300001101239us-gaap:EMEAMembereqix:NonRecurringRevenuesMember2020-01-012020-06-300001101239eqix:NonRecurringRevenuesMembersrt:AsiaPacificMember2020-01-012020-06-300001101239eqix:NonRecurringRevenuesMember2020-01-012020-06-300001101239srt:AmericasMember2020-04-012020-06-300001101239us-gaap:EMEAMember2020-04-012020-06-300001101239srt:AsiaPacificMember2020-04-012020-06-300001101239srt:AmericasMember2020-01-012020-06-300001101239us-gaap:EMEAMember2020-01-012020-06-300001101239srt:AsiaPacificMember2020-01-012020-06-300001101239srt:AmericasMember2021-06-300001101239srt:AmericasMember2020-12-310001101239us-gaap:EMEAMember2021-06-300001101239us-gaap:EMEAMember2020-12-310001101239srt:AsiaPacificMember2021-06-300001101239srt:AsiaPacificMember2020-12-310001101239us-gaap:SubsequentEventMember2021-07-282021-07-280001101239eqix:DB5DataCenterMemberus-gaap:SubsequentEventMemberus-gaap:CorporateJointVentureMembereqix:EMEA1JointVentureMember2021-07-072021-07-07
UNITED STATES
SECURITIES AND EXCHANGE COMMISSION
Washington, D.C. 20549
FORM 10-Q
| | | | | |
| ☒ | QUARTERLY REPORT PURSUANT TO SECTION 13 OR 15(d) OF THE SECURITIES EXCHANGE ACT OF 1934 |
For the quarterly period ended June 30, 2021
OR
| | | | | |
| ☐ | TRANSITION REPORT PURSUANT TO SECTION 13 OR 15(d) OF THE SECURITIES EXCHANGE ACT OF 1934 |
For the transition period from to
Commission File Number 000-31293
EQUINIX, INC.
(Exact name of registrant as specified in its charter)
| | | | | | | | |
| Delaware | | 77-0487526 |
| (State of incorporation) | | (I.R.S. Employer Identification No.) |
One Lagoon Drive, Redwood City, California 94065
(Address of principal executive offices, including ZIP code)
(650) 598-6000
(Registrant's telephone number, including area code)
Securities registered pursuant to Section 12(b) of the Act:
| | | | | | | | | | | | | | |
| Title of each class | | Trading symbol | | Name of each exchange on which registered |
| Common Stock, $0.001 | | EQIX | | The Nasdaq Stock Market LLC |
| 0.250% Senior Notes due 2027 | | | | The Nasdaq Stock Market LLC |
| 1.000% Senior Notes due 2033 | | | | The Nasdaq Stock Market LLC |
Indicate by check mark whether the registrant (1) has filed all reports required to be filed by Section 13 or 15(d) of the Securities Exchange Act of 1934 during the preceding 12 months (or for such shorter period that the registrant was required to file such reports) and (2) has been subject to such filing requirements for the past 90 days. Yes ☒ No ☐
Indicate by check mark whether the registrant has submitted electronically and posted on its corporate Web site, if any, every Interactive Data File required to be submitted and posted pursuant to Rule 405 of Regulation S-T during the preceding 12 months (or for such shorter period that the registrant was required to submit and post such files). Yes ☒ No ☐
Indicate by check mark whether the registrant is a large accelerated filer, an accelerated filer, a non-accelerated filer, a smaller reporting company or an emerging growth company. See definitions of "large accelerated filer," "accelerated filer," "smaller reporting company," and "emerging growth company" in Rule 12b-2 of the Exchange Act. (Check one):
| | | | | | | | | | | |
| Large accelerated filer | ☒ | Accelerated filer | ☐ |
| | | |
| Non-accelerated filer | ☐ | Smaller reporting company | ☐ |
| | | |
| | Emerging growth company | ☐ |
If an emerging growth company, indicate by check mark if the registrant has elected not to use the extended transition period for complying with any new or revised financial accounting standards provided pursuant to Section 13(a) of the Exchange Act. ☐
Indicate by check mark whether the registrant is a shell company (as defined in Rule 12b-2 of the Exchange Act). Yes ☐ No ☒
The number of shares outstanding of the registrant's Common Stock as of July 29, 2021 was 89,750,207.
EQUINIX, INC.
INDEX
| | | | | | | | |
| Page
No. |
| | |
| | |
| | |
| |
| | |
| Item 1. | | |
| | |
| | |
| | |
| | |
| | |
| | |
| | |
| | |
| | |
| | |
| | |
| Item 2. | | |
| | |
| Item 3. | | |
| | |
| Item 4. | | |
| |
| |
| | |
| Item 1. | | |
| | |
| Item 1A. | | |
| | |
| Item 2. | | |
| | |
| Item 3. | | |
| | |
| Item 4. | | |
| | |
| Item 5. | | |
| | |
| Item 6. | | |
| |
| |
| |
| |
Summary of Risk Factors
Our business is subject to numerous risks and uncertainties that make an investment in our securities speculative or risky, any one of which could materially adversely affect our results of operations, financial condition or business. These risks include, but are not limited to, those listed below. This list is not complete, and should be read together with the section titled “Risk Factors” in this Quarterly Report on Form 10-Q, as well as the other information in this Quarterly Report on Form 10-Q and the other filings that we make with the U.S. Securities and Exchange Commission (the “SEC”).
Risks Related to Our Business and Our Operations
•The ongoing COVID-19 pandemic could have a negative effect on our business, results of operations and financial condition.
•We experienced an information technology security breach in the past and may be vulnerable to future security breaches, which could disrupt our operations and have a material adverse effect on our business, results of operation and financial condition.
•Terrorist activity, or other acts of violence, including violence stemming from the current climate of political and economic uncertainty, could adversely impact our business.
•Our offerings have a long sales cycle that may harm our revenue and results of operations.
•Any failure of our physical infrastructure or negative impact on our ability to meet our obligations to our customers or damage to customer infrastructure within our IBX data centers, could lead to significant costs and disruptions that could reduce our revenue and harm our business reputation and financial condition.
•We are currently making significant investments in our back-office information technology systems and processes. Difficulties from or disruptions to these efforts may interrupt our normal operations and adversely affect our business and results of operations.
•The level of insurance coverage that we purchase may prove to be inadequate.
•The use of high power density equipment may limit our ability to fully utilize our older IBX data centers.
•If we are unable to implement our evolving organizational structure or if we are unable to recruit or retain key executives and qualified personnel, our business could be harmed.
•We may not be able to compete successfully against current and future competitors.
•If we cannot continue to develop, acquire, market and provide new offerings or enhancements to existing offerings that meet customer requirements and differentiate us from our competitors, our results of operations could suffer.
•Our results of operations may fluctuate.
•Our days sales outstanding ("DSO") may be negatively impacted by process and system upgrades and acquisitions.
•We may incur goodwill and other intangible asset impairment charges, or impairment charges to our property, plant and equipment, which could result in a significant reduction to our earnings.
•We have incurred substantial losses in the past and may incur additional losses in the future.
•The failure to obtain favorable terms when we renew our IBX data center leases, or the failure to renew such leases, could harm our business and results of operations.
•We depend on a number of third parties to provide internet connectivity to our IBX data centers; if connectivity is interrupted or terminated, our results of operations and cash flow could be materially and adversely affected.
•We have government customers, which subjects us to risks including early termination, audits, investigations, sanctions and penalties.
•Because we depend on the development and growth of a balanced customer base, including key magnet customers, failure to attract, grow and retain this base of customers could harm our business and results of operations.
•Industry consolidation may have a negative impact on our business model.
•Our business could be harmed by prolonged power outages, shortages or capacity constraints.
Risks Related to Our Expansion Plans
•Our construction of new IBX data centers or IBX data center expansions could involve significant risks to our business.
•Acquisitions present many risks, and we may not realize the financial or strategic goals that were contemplated at the time of any transaction.
•The anticipated benefits of our joint ventures with GIC Private Limited, Singapore’s sovereign wealth fund (“GIC”), may not be fully realized or take longer to realize than expected.
•Joint venture investments, such as our joint ventures with GIC, could expose us to risks and liabilities in connection with the formation of the new joint ventures, the operation of such joint ventures without sole decision-making authority, and our reliance on joint venture partners who may have economic and business interests that are inconsistent with our business interests.
•If we cannot effectively manage our international operations, and successfully implement our international expansion plans, or comply with evolving laws and regulations, our revenues may not increase, and our business and results of operations would be harmed.
•We are continuing to invest in our expansion efforts but may not have sufficient customer demand in the future to realize expected returns on these investments.
Risks Related to Our Capital Needs and Capital Strategy
•Our substantial debt could adversely affect our cash flows and limit our flexibility to raise additional capital.
•The phase-out of the London Interbank Offered Rate (“LIBOR”), and uncertainty as to its replacement, may adversely affect our business.
•Sales or issuances of shares of our common stock may adversely affect the market price of our common stock.
•If we are not able to generate sufficient operating cash flows or obtain external financing, our ability to fund incremental expansion plans may be limited.
•Fluctuations in foreign currency exchange rates in the markets in which we operate internationally could harm our results of operations.
•Our derivative transactions expose us to counterparty credit risk.
Risks Related to Environmental Laws and Climate Change Impacts
•Environmental regulations may impose upon us new or unexpected costs.
•Our business may be adversely affected by climate change and responses to it.
Risks Related to Certain Regulations and Laws, Including Tax Laws
•Changes in U.S. or foreign tax laws, regulations, or interpretations thereof, including changes to tax rates, may adversely affect our financial statements and cash taxes.
•Government regulation or failure to comply with laws and regulations may adversely affect our business.
Risks Related to Our Taxation as a REIT
•We have a number of risks related to our taxation as a REIT, including the risk that we may not be able to maintain our qualification as a REIT which could expose us to substantial corporate income tax and have a materially adverse effect on our business, financial condition, and results of operations.
PART I - FINANCIAL INFORMATION
Item 1. Condensed Consolidated Financial Statements
EQUINIX, INC.
CONDENSED CONSOLIDATED BALANCE SHEETS
(in thousands, except share and per share data)
| | | | | | | | | | | |
| June 30,
2021 | | December 31,
2020 |
| | (Unaudited) |
| Assets | | | |
| Current assets: | | | |
| Cash and cash equivalents | $ | 1,799,727 | | | $ | 1,604,869 | |
| Short-term investments | — | | | 4,532 | |
Accounts receivable, net of allowance of $10,779 and $10,677 | 726,382 | | | 676,738 | |
| Other current assets | 394,880 | | | 323,016 | |
| Assets held for sale | 227,073 | | | — | |
| Total current assets | 3,148,062 | | | 2,609,155 | |
| | | |
| Property, plant and equipment, net | 15,143,898 | | | 14,503,084 | |
| Operating lease right-of-use assets | 1,371,794 | | | 1,475,057 | |
| Goodwill | 5,411,123 | | | 5,472,553 | |
| Intangible assets, net | 2,047,515 | | | 2,170,945 | |
| Other assets | 807,970 | | | 776,047 | |
| Total assets | $ | 27,930,362 | | | $ | 27,006,841 | |
| Liabilities and Stockholders' Equity | | | |
| Current liabilities: | | | |
| Accounts payable and accrued expenses | $ | 767,963 | | | $ | 844,862 | |
| Accrued property, plant and equipment | 304,333 | | | 301,155 | |
| Current portion of operating lease liabilities | 149,103 | | | 154,207 | |
| Current portion of finance lease liabilities | 148,320 | | | 137,683 | |
| Current portion of mortgage and loans payable | 42,580 | | | 82,289 | |
| Current portion of senior notes | — | | | 150,186 | |
| Other current liabilities | 271,072 | | | 354,368 | |
| | | |
| Total current liabilities | 1,683,371 | | | 2,024,750 | |
| Operating lease liabilities, less current portion | 1,191,676 | | | 1,308,627 | |
| Finance lease liabilities, less current portion | 2,000,006 | | | 1,784,816 | |
| Mortgage and loans payable, less current portion | 611,441 | | | 1,287,254 | |
| Senior notes, less current portion | 11,027,243 | | | 9,018,277 | |
| Other liabilities | 770,153 | | | 948,999 | |
| Total liabilities | 17,283,890 | | | 16,372,723 | |
Commitments and contingencies (Note 11) | | | |
| Equinix stockholders' equity | | | |
Common stock, $0.001 par value per share: 300,000,000 shares authorized; 90,065,200 issued and 89,750,177 outstanding in 2021 and 89,462,304 issued and 89,134,252 outstanding in 2020 | 90 | | | 89 | |
| Additional paid-in capital | 15,360,726 | | | 15,028,357 | |
Treasury stock, at cost; 315,023 shares in 2021 and 328,052 shares in 2020 | (117,270) | | | (122,118) | |
| Accumulated dividends | (5,640,963) | | | (5,119,274) | |
| Accumulated other comprehensive loss | (941,114) | | | (913,368) | |
| Retained earnings | 1,985,003 | | | 1,760,302 | |
| Total Equinix stockholders' equity | 10,646,472 | | | 10,633,988 | |
Non-controlling interests | — | | | 130 | |
| Total stockholders' equity | 10,646,472 | | | 10,634,118 | |
| Total liabilities and stockholders' equity | $ | 27,930,362 | | | $ | 27,006,841 | |
See accompanying notes to condensed consolidated financial statements.
EQUINIX, INC.
CONDENSED CONSOLIDATED STATEMENTS OF OPERATIONS
(in thousands, except per share data)
| | | | | | | | | | | | | | | | | | | | | | | |
| Three Months Ended
June 30, | | Six Months Ended
June 30, |
| | 2021 | | 2020 | | 2021 | | 2020 |
| | (Unaudited) |
| Revenues | $ | 1,657,919 | | | $ | 1,470,121 | | | $ | 3,253,983 | | | $ | 2,914,663 | |
| Costs and operating expenses: | | | | | | | |
| Cost of revenues | 865,120 | | | 739,344 | | | 1,676,337 | | | 1,475,626 | |
| Sales and marketing | 185,610 | | | 178,124 | | | 368,437 | | | 358,574 | |
| General and administrative | 322,005 | | | 256,890 | | | 623,461 | | | 518,487 | |
| Transaction costs | 6,985 | | | 13,617 | | | 8,167 | | | 25,147 | |
| | | | | | | |
| (Gain) loss on asset sales | (455) | | | (342) | | | 1,265 | | | 857 | |
| Total costs and operating expenses | 1,379,265 | | | 1,187,633 | | | 2,677,667 | | | 2,378,691 | |
| Income from operations | 278,654 | | | 282,488 | | | 576,316 | | | 535,972 | |
| Interest income | 374 | | | 1,685 | | | 1,103 | | | 5,958 | |
| Interest expense | (87,231) | | | (108,480) | | | (176,912) | | | (215,818) | |
| Other income (expense) | (39,377) | | | 4,278 | | | (46,327) | | | 9,448 | |
| Loss on debt extinguishment | (102,460) | | | (1,868) | | | (115,518) | | | (8,309) | |
Income before income taxes | 49,960 | | | 178,103 | | | 238,662 | | | 327,251 | |
| Income tax (expense) benefit | 18,527 | | | (44,753) | | | (14,101) | | | (74,944) | |
| Net income | 68,487 | | | 133,350 | | | 224,561 | | | 252,307 | |
Net (income) loss attributable to non-controlling interests | (148) | | | (46) | | | 140 | | | (211) | |
| Net income attributable to Equinix | $ | 68,339 | | | $ | 133,304 | | | $ | 224,701 | | | $ | 252,096 | |
| Earnings per share ("EPS") attributable to Equinix: | | | | | | | |
| Basic EPS | $ | 0.76 | | | $ | 1.53 | | | $ | 2.51 | | | $ | 2.92 | |
| Weighted-average shares for basic EPS | 89,648 | | | 87,303 | | | 89,490 | | | 86,427 | |
| Diluted EPS | $ | 0.76 | | | $ | 1.52 | | | $ | 2.50 | | | $ | 2.90 | |
| Weighted-average shares for diluted EPS | 90,104 | | | 87,901 | | | 90,024 | | | 87,065 | |
See accompanying notes to condensed consolidated financial statements.
EQUINIX, INC.
CONDENSED CONSOLIDATED STATEMENTS OF COMPREHENSIVE INCOME (LOSS)
(in thousands)
| | | | | | | | | | | | | | | | | | | | | | | |
| Three Months Ended
June 30, | | Six Months Ended
June 30, |
| | 2021 | | 2020 | | 2021 | | 2020 |
| | (Unaudited) |
| Net income | $ | 68,487 | | | $ | 133,350 | | | $ | 224,561 | | | $ | 252,307 | |
| Other comprehensive income (loss), net of tax: | | | | | | | |
Foreign currency translation adjustment ("CTA") gain (loss), net of tax effects of $0, $0, $0 and $0 | 110,466 | | | 181,286 | | | (184,680) | | | (232,506) | |
Net investment hedge CTA gain (loss), net of tax effect of $0, $0, $0 and $0 | (37,036) | | | (97,058) | | | 133,139 | | | 47,888 | |
| | | | | | | |
Unrealized gain (loss) on cash flow hedges, net of tax effects of $(447), $4,772, $(8,339) and $(1,595) | (5,700) | | | (17,868) | | | 23,778 | | | (21,124) | |
Net actuarial gain on defined benefit plans, net of tax effects of $(3), $(6), $(8) and $3 | 15 | | | 20 | | | 27 | | | 55 | |
| Total other comprehensive income (loss), net of tax | 67,745 | | | 66,380 | | | (27,736) | | | (205,687) | |
| Comprehensive income, net of tax | 136,232 | | | 199,730 | | | 196,825 | | | 46,620 | |
| Net (income) loss attributable to non-controlling interests | (148) | | | (46) | | | 140 | | | (211) | |
| Other comprehensive (income) loss attributable to non-controlling interests | (11) | | | (2) | | | (10) | | | 9 | |
| Comprehensive income attributable to Equinix | $ | 136,073 | | | $ | 199,682 | | | $ | 196,955 | | | $ | 46,418 | |
See accompanying notes to condensed consolidated financial statements.
EQUINIX, INC.
CONDENSED CONSOLIDATED STATEMENTS OF CASH FLOWS
(in thousands)
| | | | | | | | | | | |
| Six Months Ended
June 30, |
| | 2021 | | 2020 |
| | (Unaudited) |
| Cash flows from operating activities: | | | |
| Net income | $ | 224,561 | | | $ | 252,307 | |
| Adjustments to reconcile net income to net cash provided by operating activities: | | | |
| Depreciation | 706,184 | | | 586,609 | |
| Stock-based compensation | 172,685 | | | 140,343 | |
| Amortization of intangible assets | 105,074 | | | 97,853 | |
| Amortization of debt issuance costs and debt discounts and premiums | 8,370 | | | 7,904 | |
| Provision for credit loss allowance | 5,751 | | | 11,496 | |
| | | |
| Loss on asset sales | 1,265 | | | 857 | |
| | | |
| Loss on debt extinguishment | 115,518 | | | 8,309 | |
| Other items | 17,545 | | | 10,654 | |
| Changes in operating assets and liabilities: | | | |
| Accounts receivable | (57,329) | | | (14,233) | |
| Income taxes, net | (65,935) | | | 11,861 | |
| Other assets | (57,280) | | | (60,019) | |
| Operating lease right-of-use assets | 61,775 | | | 76,292 | |
| Operating lease liabilities | (100,328) | | | (72,091) | |
| Accounts payable and accrued expenses | (57,201) | | | (25,564) | |
| Other liabilities | (90,300) | | | 58,938 | |
| Net cash provided by operating activities | 990,355 | | | 1,091,516 | |
| Cash flows from investing activities: | | | |
| Purchases of investments | (25,001) | | | (52,415) | |
| Sales of investments | 4,057 | | | 12,134 | |
| Business acquisitions, net of cash and restricted cash acquired | — | | | (478,248) | |
| Purchases of real estate | (87,637) | | | (82,567) | |
| Purchases of other property, plant and equipment | (1,255,830) | | | (882,889) | |
| | | |
| Net cash used in investing activities | (1,364,411) | | | (1,483,985) | |
| Cash flows from financing activities: | | | |
| Proceeds from employee equity awards | 40,034 | | | 30,391 | |
| Payment of dividends | (521,092) | | | (469,487) | |
| Proceeds from public offering of common stock, net of issuance costs | 99,599 | | | 1,784,898 | |
| Proceeds from senior notes, net of debt discounts | 3,878,662 | | | 2,585,736 | |
| Proceeds from mortgage and loans payable | — | | | 750,790 | |
| Repayments of finance lease liabilities | (98,877) | | | (42,681) | |
| Repayments of mortgage and loans payable | (696,059) | | | (789,178) | |
| Repayment of senior notes | (1,990,650) | | | (493,711) | |
| Debt extinguishment costs | (99,185) | | | (4,619) | |
| Debt issuance costs | (25,102) | | | (26,266) | |
| | | |
| Net cash provided by financing activities | 587,330 | | | 3,325,873 | |
Effect of foreign currency exchange rates on cash, cash equivalents and restricted cash | (17,054) | | | (12,876) | |
| | | |
| Net increase in cash, cash equivalents and restricted cash | 196,220 | | | 2,920,528 | |
| Cash, cash equivalents and restricted cash at beginning of period | 1,625,695 | | | 1,886,613 | |
| Cash, cash equivalents and restricted cash at end of period | $ | 1,821,915 | | | $ | 4,807,141 | |
| | | |
| Cash and cash equivalents | $ | 1,799,727 | | | $ | 4,785,050 | |
| Current portion of restricted cash included in other current assets | 12,994 | | | 13,293 | |
| Non-current portion of restricted cash included in other assets | 9,194 | | | 8,798 | |
Total cash, cash equivalents, and restricted cash shown in the condensed consolidated statement of cash flows | $ | 1,821,915 | | | $ | 4,807,141 | |
See accompanying notes to condensed consolidated financial statements.
EQUINIX, INC.
NOTES TO CONDENSED CONSOLIDATED FINANCIAL STATEMENTS
(Unaudited)
1. Basis of Presentation and Significant Accounting Policies
Basis of Presentation
The accompanying unaudited condensed consolidated financial statements have been prepared by Equinix, Inc. (collectively with its consolidated subsidiaries referred to as "Equinix," the "Company," "we," "our," or "us") and reflect all adjustments, consisting only of normal recurring adjustments, which in the opinion of management are necessary to fairly state the financial position and the results of operations for the interim periods presented. In the preparation of our condensed consolidated financial statements, we have considered potential impacts of the COVID-19 pandemic on our critical and significant accounting estimates. There was no significant impact to our condensed consolidated financial statements. We will continue to evaluate the nature and extent of the potential impacts to our business and our condensed consolidated financial statements.
Our condensed consolidated balance sheet data as of December 31, 2020 has been derived from audited consolidated financial statements as of that date. Our condensed consolidated financial statements have been prepared in accordance with the regulations of the Securities and Exchange Commission ("SEC"), but omit certain information and footnote disclosure necessary to present the statements in accordance with generally accepted accounting principles in the United States of America ("U.S. GAAP"). For further information, refer to the Consolidated Financial Statements and Notes thereto included in our Form 10-K as filed with the SEC on February 19, 2021. Results for the interim periods are not necessarily indicative of results for the entire fiscal year.
Consolidation
The accompanying unaudited condensed consolidated financial statements include our acquisitions of 12 data center sites across Canada from BCE Inc. ("Bell") from October 1, 2020 and one additional data center site from November 2, 2020, Packet Host, Inc. (“Packet”) from March 2, 2020, and three data centers in Mexico acquired from Axtel S.A.B. de C.V ("Axtel") from January 8, 2020. All intercompany accounts and transactions have been eliminated in consolidation.
Income Taxes
We elected to be taxed as a real estate investment trust for U.S. federal income tax purposes ("REIT") beginning with our 2015 taxable year. As a result, we may deduct the distributions made to our stockholders from taxable income generated by our REIT and qualified REIT subsidiaries ("QRSs"). Our dividends paid deduction generally eliminates the U.S. federal taxable income of our REIT and QRSs, resulting in no U.S. federal income tax due. However, our domestic taxable REIT subsidiaries ("TRSs") are subject to U.S. corporate income taxes on any taxable income generated by them. In addition, our foreign operations are subject to local income taxes regardless of whether the foreign operations are operated as QRSs or TRSs.
We provide for income taxes during interim periods based on the estimated effective tax rate for the year. The effective tax rate is subject to change in the future due to various factors such as our operating performance, tax law changes and future business acquisitions.
Our effective tax rates were 5.9% and 22.9% for the six months ended June 30, 2021 and 2020, respectively. The decrease in the effective tax rate for the six months ended June 30, 2021 as compared to the same period in 2020 is primarily due to the favorable resolution of uncertain tax positions of approximately $72.0 million resulting from the settlement of various tax audits in the United Kingdom ("UK"), Germany, and Australia, partially offset by $11.0 million resulting from the revaluation of our deferred tax liabilities due to the UK corporate tax rate increase from 19% to 25% enacted in the current period.
Of the unrecognized tax benefits being realized in the current period, $33.6 million is related to the uncertain tax position inherited from the Metronode Acquisition. The uncertain tax position was covered by an indemnification agreement with the Seller. The realization of the unrecognized tax benefits resulted in an impairment of the indemnification asset for the same amount, which has been included in Other Income (Expense) on the Condensed Consolidated Statements of Operations.
EQUINIX, INC.
NOTES TO CONDENSED CONSOLIDATED FINANCIAL STATEMENTS - (Continued)
(Unaudited)
Recent Accounting Pronouncements
Accounting Standards Not Yet Adopted
In August 2020, the Financial Accounting Standards Board ("FASB") issued Accounting Standards Update ("ASU") 2020-06: Debt-Debt with Conversion and Other Options (Subtopic 470-20) and Derivatives and Hedging-Contracts in Entity’s Own Equity (Subtopic 815-40). The ASU simplifies the accounting for convertible instruments by reducing the number of accounting models for convertible debt instruments and convertible preferred stock and modifies the disclosure requirement for the convertible instruments. Additionally, this ASU improves the consistency of EPS calculations by eliminating the use of the treasury stock method to calculate diluted EPS for convertible instruments and clarifies certain areas under the current EPS guidance. The ASU is effective for fiscal years, and interim periods within those fiscal years, beginning after December 15, 2021, with early adoption permitted at the beginning of the fiscal year after December 15, 2020. We are currently evaluating the extent of the impact of this ASU, but do not expect the adoption of this standard to have a significant impact on our condensed consolidated financial statements.
Accounting Standards Adopted
In December 2019, FASB issued ASU 2019-12, Income Taxes ("Topic 740"): Simplifying the Accounting for Income Taxes. The ASU simplifies accounting for income taxes by removing certain exceptions to the general principles in Topic 740. The ASU also improves consistent application of and simplifies generally accepted accounting principles ("GAAP") for other areas of Topic 740 by clarifying and amending existing guidance. The ASU is effective for fiscal years, and interim periods within those fiscal years, beginning after December 15, 2020, with early adoption permitted including adoption in any interim period for periods for which financial statements have not yet been issued. On January 1, 2021, we adopted this ASU on a prospective basis and the adoption of this standard did not have an impact on our condensed consolidated financial statements.
In March 2020, FASB issued ASU 2020-04, Reference Rate Reform ("Topic 848"): Facilitation of the Effects of Reference Rate Reform on Financial Reporting. In addition, FASB issued ASU 2021-01, Reference Rate Reform ("Topic 848"), which clarifies the scope of Topic 848. Collectively, the guidance provides optional expedients and exceptions for applying GAAP to contracts, hedging relationships, and other transactions affected by reference rate reform if certain criteria are met. ASU 2020-04 was effective for all entities as of March 12, 2020 through December 31, 2022 and ASU 2021-01 is effective upon issuance. We adopted these ASUs upon their respective issuances and there was no impact on our condensed consolidated financial statements as a result of adopting the guidance. We will evaluate our debt, derivative and lease contracts that may become eligible for modification relief and may apply the elections prospectively as needed.
2. Revenue
Contract Balances
The following table summarizes the opening and closing balances of our accounts receivable, net; contract assets, current; contract assets, non-current; deferred revenue, current; and deferred revenue, non-current (in thousands):
| | | | | | | | | | | | | | | | | | | | | | | | | | | | | |
| Accounts receivable, net (1) | | Contract assets, current | | Contract assets, non-current | | Deferred revenue, current | | Deferred revenue, non-current |
Beginning balances as of January 1, 2021 | $ | 676,738 | | | $ | 13,534 | | | $ | 54,050 | | | $ | 101,258 | | | $ | 71,242 | |
Closing balances as of June 30, 2021 | 726,382 | | | 33,614 | | | 53,137 | | | 104,568 | | | 68,992 | |
| Increase (Decrease) | $ | 49,644 | | | $ | 20,080 | | | $ | (913) | | | $ | 3,310 | | | $ | (2,250) | |
(1) The net change in our allowance for credit losses was insignificant during the six months ended June 30, 2021.
EQUINIX, INC.
NOTES TO CONDENSED CONSOLIDATED FINANCIAL STATEMENTS - (Continued)
(Unaudited)
The difference between the opening and closing balances of our accounts receivable, net, contract assets and deferred revenues primarily results from revenue growth and the timing difference between the satisfaction of our performance obligation and the customer's payment. The amount of revenue recognized during the six months ended June 30, 2021 from the opening deferred revenue balance as of January 1, 2021 was $57.7 million.
Remaining performance obligations
As of June 30, 2021, approximately $8.5 billion of total revenues, including deferred installation revenues, are expected to be recognized in future periods. Most of our revenue contracts have an initial term varying from one to three years, and thereafter, automatically renew in one-year increments. Included in the remaining performance obligations are contracts that are either under the initial term or under one-year renewal periods. We expect to recognize approximately 70% of our remaining performance obligations as revenues over the next two years, with more revenues expected to be recognized in the first year due to the impact of contracts renewal. The remainder of the balance is generally expected to be recognized over the next three to five years. We estimate our remaining performance obligations at a point in time. Actual amounts and timing of revenue recognition may differ from these estimates due to changes in actual deployments dates, contract modifications, renewals and/or terminations.
The remaining performance obligations do not include variable consideration related to unsatisfied performance obligations such as the usage of metered power, service fees from xScaleTM data centers, which are calculated based on future events or actual costs incurred in the future, or any contracts that could be terminated without any significant penalties such as the majority of interconnection revenues. The remaining performance obligations above include revenues to be recognized in the future related to arrangements where we are considered the lessor.
3. Earnings Per Share
The following table sets forth the computation of basic and diluted earnings per share ("EPS") for the periods presented (in thousands, except per share amounts):
| | | | | | | | | | | | | | | | | | | | | | | |
| Three Months Ended
June 30, | | Six Months Ended
June 30, |
| | 2021 | | 2020 | | 2021 | | 2020 |
| Net income | $ | 68,487 | | | $ | 133,350 | | | $ | 224,561 | | | $ | 252,307 | |
Net (income) loss attributable to non-controlling interests | (148) | | | (46) | | | 140 | | | (211) | |
| Net income attributable to Equinix | $ | 68,339 | | | $ | 133,304 | | | $ | 224,701 | | | $ | 252,096 | |
| | | | | | | |
| Weighted-average shares used to calculate basic EPS | 89,648 | | | 87,303 | | | 89,490 | | | 86,427 | |
| Effect of dilutive securities: | | | | | | | |
| Employee equity awards | 456 | | | 598 | | | 534 | | | 638 | |
| Weighted-average shares used to calculate diluted EPS | 90,104 | | | 87,901 | | | 90,024 | | | 87,065 | |
| | | | | | | |
| EPS attributable to Equinix: | | | | | | | |
| Basic EPS | $ | 0.76 | | | $ | 1.53 | | | $ | 2.51 | | | $ | 2.92 | |
| Diluted EPS | $ | 0.76 | | | $ | 1.52 | | | $ | 2.50 | | | $ | 2.90 | |
We have excluded common stock related to employee equity awards in the diluted EPS calculation above of approximately 248,000 shares and 31,000 shares for the three months ended June 30, 2021 and 2020, respectively, and approximately 199,000 and 23,000 shares for the six months ended June 30, 2021 and 2020, because their effect would be anti-dilutive.
EQUINIX, INC.
NOTES TO CONDENSED CONSOLIDATED FINANCIAL STATEMENTS - (Continued)
(Unaudited)
4. Acquisitions
2020 Acquisitions
Acquisition of Bell Data Centers (the "Bell Acquisition")
On October 1, 2020, we completed the acquisition of 12 data center sites across Canada from Bell, with one additional data center in Ottawa Canada acquired on November 2, 2020, for a total combined purchase consideration of approximately C$934.3 million, or $704.0 million at the exchange rates in effect on those dates. The acquisition supports our ongoing expansion to meet customer demand in Canada.
Acquisition of Packet (the "Packet Acquisition")
On March 2, 2020, we acquired all outstanding shares and equity awards of Packet Host, Inc. (“Packet”), a leading bare metal automation platform for a total purchase consideration of approximately $290.3 million in cash. In addition, we paid $16.1 million in cash to accelerate the vesting of unvested Packet equity awards for certain Packet employees, which was recorded as stock-based compensation expense during the three months ended March 31, 2020. In connection with the acquisition, we also issued restricted stock awards with an aggregated fair value of $30.2 million and a three-year vesting period, which will be recognized as stock-based compensation costs over the vesting period. The acquisition, combined with Equinix MetalTM, is expected to accelerate our strategy to help enterprises deploy hybrid multicloud architectures on our data center platform.
Acquisition of data centers from Axtel (the "Axtel Acquisition")
On January 8, 2020, we completed the acquisition of three data centers in Mexico from Axtel S.A.B. de C.V. (“Axtel”) for a total purchase consideration of approximately $189.0 million, including $175.0 million in cash and $14.0 million we paid to the seller for recoverable value-added taxes ("VAT") incurred prior to the acquisition, which related to a corresponding VAT receivable acquired upon acquisition. The acquisition supports our ongoing expansion to meet customer demand in our Americas region.
Purchase price allocation
Each of these acquisitions constitute a business under the accounting standard for business combinations and, therefore, were accounted for as business combinations using the acquisition method of accounting. Under the acquisition method of accounting, the total purchase price is allocated to the assets acquired and liabilities assumed measured at fair value on the date of acquisition.
As of June 30, 2021, we had completed the detailed valuation analysis to derive the fair value of assets acquired and liabilities assumed from the Bell acquisition and finalized the allocation of purchase price.
EQUINIX, INC.
NOTES TO CONDENSED CONSOLIDATED FINANCIAL STATEMENTS - (Continued)
(Unaudited)
A summary of the allocation of total purchase consideration is presented as follows (in thousands):
| | | | | | | | | | | | | | | | | |
| Bell (1) | | Packet | | Axtel |
| Final |
| Cash and cash equivalents | $ | — | | | $ | 1,068 | | | $ | — | |
| Accounts receivable | — | | | 5,098 | | | — | |
| Other current assets | 696 | | | 299 | | | 14,048 | |
| Property, plant and equipment | 538,717 | | | 27,945 | | | 76,407 | |
| Operating lease right-of-use assets | 14,359 | | | 1,519 | | | 1,646 | |
| Intangible assets | 75,857 | | | 58,500 | | | 22,750 | |
| Goodwill | 172,387 | | | 230,620 | | | 78,902 | |
| Deferred tax and other assets | 722 | | | 138 | | | — | |
Total assets acquired | 802,738 | | | 325,187 | | | 193,753 | |
| Accounts payable and accrued liabilities | (895) | | | (1,275) | | | (238) | |
| Other current liabilities | — | | | (860) | | | — | |
| Operating lease liabilities | (13,340) | | | (1,519) | | | (1,586) | |
| Finance lease liabilities | (80,026) | | | (27,945) | | | — | |
| Deferred tax and other liabilities | (4,495) | | | (3,290) | | | (2,911) | |
Net assets acquired | $ | 703,982 | | | $ | 290,298 | | | $ | 189,018 | |
(1)For the Bell Acquisition, the purchase price allocation adjustments since the provisional amounts reported as of December 31, 2020 were not significant. As of June 30, 2021, the purchase price allocation was final.
Property, plant and equipment - The fair values of property, plant and equipment acquired from these three acquisitions were estimated by applying the cost approach, with the exception of land, which we estimated by applying the market approach. The key assumptions of the cost approach include replacement cost new, physical deterioration, functional and economic obsolescence, economic useful life, remaining useful life, age and effective age.
Intangible assets - The following table presents certain information on the acquired intangible assets (in thousands):
| | | | | | | | | | | | | | | | | | | | |
| Intangible Assets | | Fair Value | | Estimated Useful Lives (Years) | | Weighted-average Estimated Useful Lives (Years) |
| Bell: | | | | | | |
| Customer relationships | | $ | 75,857 | | | 15.0 | | 15.0 |
| Packet: | | | | | | |
| Trade names | | 1,300 | | | 3.0 | | 3.0 |
| Existing technology | | 5,100 | | | 3.0 | | 3.0 |
| Customer relationships | | 52,100 | | | 10.0 | | 10.0 |
| Axtel: | | | | | | |
| Customer relationships | | 22,750 | | | 15.0 | | 15.0 |
The fair values of customer relationships acquired from these acquisitions were estimated from applying an income approach, by calculating the present value of estimated future operating cash flows generated from existing customers less costs to realize the revenue. We applied a discount rate of 8.0% for Bell, 8.0% for Packet and 13.3% for Axtel, which reflects the nature of the assets as they relate to the risk and uncertainty of the estimated future operating cash flows, as well as the risk of the country within which the acquired business operates.
EQUINIX, INC.
NOTES TO CONDENSED CONSOLIDATED FINANCIAL STATEMENTS - (Continued)
(Unaudited)
The fair value of the Packet trade name was estimated using the relief from royalty method under the income approach. We applied a relief from royalty rate of 1.0% and a discount rate of 8.0%. The fair value of existing technology was estimated under the cost approach by projecting the cost to recreate a new asset with an equivalent utility of the existing technology. The key assumptions of the cost approach include total cost, time to recreate and functional obsolescence.
Goodwill
Goodwill represents the excess of the purchase price over the fair value of the net tangible and intangible assets acquired and liabilities assumed. Goodwill is attributable to the workforce of the acquired business and the projected revenue increase expected to arise from future customers after these acquisitions. Goodwill from these acquisitions is attributable to our Americas region. Goodwill from the Bell Acquisition is expected to be deductible for local tax purposes while goodwill from the Packet and Axtel Acquisitions are not amortizable for local tax purposes.
Pending Acquisition of GPX India
On August 7, 2020, we entered into an agreement to purchase the India operations of GPX Global Systems, Inc. ("GPX India"), representing two data centers in Mumbai, India for approximately $161.0 million in an all-cash transaction (the “GPX India Acquisition”). The GPX India Acquisition is expected to close in the third quarter of 2021, subject to customary closing conditions including regulatory approval. Upon the close of the acquisition, the operating results of the acquired business will be reported in our Asia-Pacific region.
5. Assets Held for Sale
In June 2021, we entered into an agreement to form our third joint venture in the form of a limited liability partnership with GIC, Singapore's sovereign wealth fund ("GIC"), to develop and operate additional xScaleTM data centers in Europe and the Americas (the “EMEA 2 Joint Venture”). xScale data centers are engineered to meet the technical and operational requirements and price points of core hyperscale workload deployments and also offer access to our comprehensive suite of interconnection and edge services. Upon closing, GIC will contribute cash in exchange for an 80% partnership interest in the EMEA 2 Joint Venture. We agreed to sell certain data center sites and facilities located in Frankfurt, Helsinki, Madrid, Milan, Paris, Sao Paolo and Warsaw, with the intention to add additional sites post-closing, in exchange for a 20% partnership interest in the EMEA 2 Joint Venture and cash proceeds. The transaction is expected to close in phases over the course of two years, pending regulatory approval and other closing conditions. The assets and liabilities of the data center sites that are expected to be sold within a year, which are currently included within our EMEA and Americas regions, were classified as held for sale as of June 30, 2021.
In May 2021, we entered into an agreement to sell the Dublin 5 ("DB5") data center site, which is currently under construction, to the EMEA 1 Joint Venture (as defined in note 6 below). The assets and liabilities of the DB5 data center, which are currently included within our EMEA region, were classified as held for sale as of June 30, 2021. The transaction closed in July 2021 (see note 14 below).
All assets and liabilities classified as held for sale are reported at the lower of their carrying amounts or fair values less costs to sell. The following table summarizes the assets and liabilities that were classified as assets and liabilities held for sale in the condensed consolidated balance sheet as of June 30, 2021 (in thousands):
EQUINIX, INC.
NOTES TO CONDENSED CONSOLIDATED FINANCIAL STATEMENTS - (Continued)
(Unaudited)
| | | | | |
| June 30,
2021 |
| Other current assets | $ | 12,399 | |
| Operating lease right-of-use assets | 19,873 | |
| Property, plant and equipment | 191,230 | |
| Other assets | 3,571 | |
| Total assets held for sale | $ | 227,073 | |
| |
| Current portion of operating lease liabilities | $ | 1,142 | |
| Operating lease liabilities, less current portion | 619 | |
| Accrued property, plant and equipment | 31,222 | |
Total liabilities held for sale (1) | $ | 32,983 | |
| |
(1)Liabilities held for sale were included within other current liabilities on the condensed consolidated balance sheet.
6. Equity Method Investments
The following table summarizes the equity method investments (in thousands):
| | | | | | | | | | | | | | | | | | | | |
| Investee | | Ownership Percentage | | June 30, 2021 | | December 31, 2020 |
| EMEA 1 Joint Venture with GIC | | 20% | | $ | 105,081 | | | $ | 101,892 | |
| Asia-Pacific Joint Venture with GIC | | 20% | | 48,992 | | | 43,432 | |
| Other | | Various | | 20,127 | | | 17,747 | |
| Total | | | | $ | 174,200 | | | $ | 163,071 | |
| | | | | | |
EMEA 1 Joint Venture
In 2019, we entered into a joint venture in the form of a limited liability partnership with GIC (the "EMEA 1 Joint Venture"), to develop and operate xScale data centers in Europe. The EMEA 1 Joint Venture is not a variable interest entity ("VIE") because its equity investors have the characteristics of a controlling financial interest and it is sufficiently capitalized to sustain its operations, requiring additional funding from its partners only when expanding operations. During the six months ended June 30, 2021, we made equity contributions of $7.1 million to the EMEA 1 Joint Venture. Our share of income and losses of equity method investments from this joint venture was insignificant for the three and six months ended June 30, 2021 and 2020 and was included in other income (expense) on the condensed consolidated statement of operations.
We committed to make future equity contributions to the EMEA 1 Joint Venture for funding its future development. As of June 30, 2021, we had future equity contribution commitments of $25.1 million.
Variable Interest Entity
Asia-Pacific Joint Venture
On December 17, 2020, we entered into a second joint venture with GIC (the "Asia-Pacific Joint Venture") to develop and operate xScale data centers in Asia-Pacific. We provide certain management services to the Asia-Pacific Joint Venture operations and earn fees for the performance of such services. The Asia-Pacific Joint Venture does not have sufficient funds from operations to be self-sustained, thus is considered a VIE. In addition, the power to direct the activities of the Asia-Pacific Joint Venture that most significantly impact economic performance is shared equally between GIC and us. These activities include data center construction and operations, sales and marketing, financing, and real estate purchases or sales. Decisions about these activities require the consent of both GIC and us. We concluded that neither party is deemed to have predominant control over the Asia-Pacific Joint Venture and neither party is its primary beneficiary. Upon closing the Asia-Pacific Joint Venture, we recorded our
EQUINIX, INC.
NOTES TO CONDENSED CONSOLIDATED FINANCIAL STATEMENTS - (Continued)
(Unaudited)
initial 20% partnership interest at fair value of $42.6 million in total at the exchange rate in effect on December 17, 2020. During the six months ended June 30, 2021, we made additional equity contributions of $11.2 million to the Asia-Pacific Joint Venture. Our share of income and losses of equity method investments from this joint venture was insignificant for the three and six months ended June 30, 2021 and was included in other income (expense) on the condensed consolidated statement of operations.
In addition to the investment in the Asia-Pacific Joint Venture, we also had $16.7 million of receivables from the Asia-Pacific Joint Venture relating to purchase price adjustments on the sale of data center assets as well as amounts due under commercial service agreements, which were presented within accounts receivable, net on the condensed consolidated balance sheet as of June 30, 2021. During the three and six months ended June 30, 2021, the total revenue recorded from these services was $12.2 million and $14.4 million, respectively.
Concurrent with the closing of the Asia-Pacific Joint Venture, the Asia-Pacific Joint Venture entered into a credit facility agreement and a bond agreement with a group of lenders for secured debt facilities of $305.2 million in total at the exchange rate in effect on December 31, 2020. The Asia-Pacific Joint Venture’s debt is secured by the net assets of the Asia-Pacific Joint Venture without recourse to its partners. Under the Asia-Pacific Joint Venture agreement and pursuant to the credit facility and bond agreements, the joint venture partners are required to make additional equity contributions proportionately upon certain occurrences, such as a shortfall in capital necessary to complete certain construction phases or make interest payments on its outstanding debt. As of June 30, 2021, we had future equity contribution commitments of $6.8 million.
Our maximum exposure to loss related to the Asia-Pacific Joint Venture is limited to our equity investments, outstanding receivables including any unpaid service and performance fees earned, and future funding commitments including those that may be required pursuant to the credit facility and bond agreements. As of June 30, 2021, our maximum exposure to loss related to the Asia-Pacific Joint Venture was $72.4 million.
Other Related Party Transactions
In connection with the sale of the PA9 data center to the EMEA 1 Joint Venture, we have a commitment to the EMEA 1 Joint Venture to complete a residual portion of the PA9 data center for an estimated cost of $22.6 million in total, which is reimbursable in full upon completion. As of June 30, 2021, we had contract assets, current of $18.5 million, in relation to the progress in completing this commitment.
We received contingent consideration from the sales of xScale data centers to the EMEA 1 Joint Venture, which become receivable upon completion of certain performance milestones, primarily contingent on the local regulatory approvals for certain sites. The contingent consideration are considered derivatives and are remeasured at fair value each reporting period using inputs such as probabilities of payment, discount rates, foreign currency forward rates and projected payment dates. The fair value measurements were based on significant inputs that are not observable in the market and thus represent Level 3 measurements. The contingencies were partially met during the three months ended June 30, 2021 upon achieving the performance milestone for one of the sites. As of June 30, 2021 and December 31, 2020, the total fair value of the remaining contingent consideration was $15.6 million and $44.2 million, respectively, which was included in other current assets on the condensed consolidated balance sheets. Changes in the fair value of the contingent consideration were recorded in gain (loss) on asset sales on the condensed consolidated statement of operations.
We also have a sub-lease agreement with the EMEA 1 Joint Venture to sub-lease a portion of London ("LD") 10-2 data center or former LD10 data center, for a total of 15 years. For the three and six months ended June 30, 2021, we recorded approximately $4.2 million and $8.7 million, respectively, of rent expense for the LD10-2 data center. For the three and six months ended June 30, 2020, we recorded approximately $3.5 million and $6.9 million, respectively, of rent expense for the LD10-2 data center. As of June 30, 2021 and December 31, 2020, we had finance lease right of use ("ROU") assets of $126.0 million and $127.2 million, respectively and a finance lease ROU liability of $130.9 million and $130.8 million, respectively.
EQUINIX, INC.
NOTES TO CONDENSED CONSOLIDATED FINANCIAL STATEMENTS - (Continued)
(Unaudited)
We provide various services to the EMEA 1 Joint Venture through multiple agreements, including sales and marketing, development management, facilities management, and asset management services. As of June 30, 2021 and December 31, 2020, we had $6.0 million and $6.5 million, respectively, of total receivables from the EMEA 1 Joint Venture. For the three and six months ended June 30, 2021, total revenues from these contracts were $13.2 million and $18.8 million, respectively. For the three and six months ended June 30, 2020, total revenues from these contracts were $4.0 million and $8.5 million, respectively. The transactions with the EMEA 1 Joint Venture are generally considered to have been negotiated arm's length.
Additionally, we have an agreement to lease to the EMEA 1 Joint Venture a portion of land for the Frankfurt 9 xScale data center and a new building that is under construction on the land. As of June 30, 2021, the lease has not commenced yet and we recorded approximately $16.9 million of other liabilities in connection with the construction of the Frankfurt 9 xScale data center.
As previously described above, we provide various services to the Asia-Pacific Joint Venture, including portfolio management, sales and marketing, development, and facilities management services, which give rise to receivables. The transactions with the Asia-Pacific Joint Venture are generally considered to have been negotiated arm's length.
7. Derivatives and Hedging Activities
Derivatives Designated as Hedging Instruments
Net Investment Hedges. We are exposed to the impact of foreign exchange rate fluctuations on the value of investments in our foreign subsidiaries whose functional currencies are other than the U.S. Dollar. In order to mitigate the impact of foreign currency exchange rates, we have entered into various foreign currency debt obligations, which are designated as hedges against our net investments in foreign subsidiaries. As of June 30, 2021 and December 31, 2020, the total principal amounts of foreign currency debt obligations designated as net investment hedges were $1.5 billion and $1.9 billion, respectively.
We also use cross-currency interest rate swaps, which convert a portion of our U.S. dollar-denominated fixed-rate debt to foreign currency-denominated fixed-rate debt, to hedge the currency exposure associated with a portion of our net investment in our foreign subsidiaries. As of June 30, 2021 and December 31, 2020, we had cross-currency interest rate swaps outstanding with notional amounts of $4.0 billion and $3.3 billion respectively, with maturity dates ranging through 2026.
EQUINIX, INC.
NOTES TO CONDENSED CONSOLIDATED FINANCIAL STATEMENTS - (Continued)
(Unaudited)
From time to time, we use foreign currency forward contracts to hedge against the effect of foreign exchange rate fluctuations on a portion of our net investment in our foreign subsidiaries. As of both June 30, 2021 and December 31, 2020, the total notional amount of foreign currency forward contracts designated as net investment hedges was $355.6 million.
The effect of net investment hedges on accumulated other comprehensive income and the condensed consolidated statements of operations for the three and six months ended June 30, 2021 and 2020 was as follows (in thousands):
| | | | | | | | | | | | | | | | | | | | | | | | | | | | | |
| Amount of gain or (loss) recognized in accumulated other comprehensive income: |
| | | Three Months Ended
June 30, | | Six Months Ended
June 30, |
| | | 2021 | | 2020 | | 2021 | | 2020 |
| Foreign currency debt | | $ | (23,758) | | | $ | (85,215) | | | $ | 44,982 | | | $ | 13,887 | |
Cross-currency interest rate swaps (included component) (1) | | (23,124) | | | (10,333) | | | 118,104 | | | 3,807 | |
Cross-currency interest rate swaps (excluded component) (2) | | 15,112 | | | (1,510) | | | (25,417) | | | 30,194 | |
Foreign currency forward contracts (included component) (1) | | (5,264) | | | — | | | (4,556) | | | — | |
Foreign currency forward contracts (excluded component) (3) | | (2) | | | — | | | 26 | | | — | |
Total | | $ | (37,036) | | | $ | (97,058) | | | $ | 133,139 | | | $ | 47,888 | |
| | | | | | | | | |
| Amount of gain or (loss) recognized in earnings: | | | | |
| Location of gain or (loss) | | Three Months Ended
June 30, | | Six Months Ended
June 30, |
| | 2021 | | 2020 | | 2021 | | 2020 |
Cross-currency interest rate swaps (excluded component) (2) | Interest expense | | $ | 10,566 | | | $ | 5,459 | | | $ | 20,615 | | | $ | 10,548 | |
Foreign currency forward contracts (excluded component) (3) | Interest expense | | 40 | | | — | | | 204 | | | — | |
Total | | | $ | 10,606 | | | $ | 5,459 | | | $ | 20,819 | | | $ | 10,548 | |
| | | | | | | | | |
| | | | |
| | | | | |
| | | | | | | | |
| | | | | | | | | |
| | | | | | | | | |
(1)Included component represents foreign exchange spot rates.
(2)Excluded component represents cross-currency basis spread and interest rates.
(3)Excluded component represents foreign currency forward points.
Cash Flow Hedges. We hedge our foreign currency transaction exposure for forecasted revenues and expenses in our EMEA region between the U.S. Dollar and the British Pound, Euro, Swedish Krona and Swiss Franc. The foreign currency forward and option contracts that we use to hedge this exposure are designated as cash flow hedges. As of June 30, 2021 and December 31, 2020, the total notional amounts of these foreign exchange contracts were $966.5 million and $912.9 million, respectively.
As of June 30, 2021, our foreign currency cash flow hedge instruments had maturity dates ranging from July 2021 to June 2023 and a net loss of $21.3 million was recorded within accumulated other comprehensive income (loss) relating to these foreign exchange contracts that will be reclassified to revenues and expenses as they mature in the next 12 months. As of December 31, 2020, our foreign currency cash flow hedge instruments had maturity dates ranging from January 2021 to December 2022 and a net loss of $35.4 million was recorded within accumulated other comprehensive income (loss) relating to cash flow hedges that will be reclassified to revenues and expenses as they mature in the next 12 months.
We enter into intercompany hedging instruments ("intercompany derivatives") with our wholly-owned subsidiaries in order to hedge certain forecasted revenues and expenses denominated in currencies other than the U.S. Dollar. Simultaneously, we enter into derivative contracts with unrelated third parties to externally hedge the net exposure created by such intercompany derivatives.
EQUINIX, INC.
NOTES TO CONDENSED CONSOLIDATED FINANCIAL STATEMENTS - (Continued)
(Unaudited)
We hedge the interest rate exposure created by anticipated fixed rate debt issuances through the use of treasury locks and swap locks (collectively, interest rate locks), which are designated as cash flow hedges. As of both June 30, 2021 and December 31, 2020, we had no interest rate locks outstanding. During the six months ended June 30, 2021, interest rate locks with a combined aggregate notional amount of $1.3 billion were settled related to the issuance of senior notes in the quarter. When interest rate locks are settled, any gain or loss from the transactions is deferred and included as a component of other comprehensive income (loss) and is amortized to interest expense over the term of the forecasted hedged transaction which is equivalent to the term of the interest rate locks. As of June 30, 2021 and December 31, 2020, we had a net loss of $4.4 million and $4.1 million, respectively, recorded within accumulated other comprehensive income (loss) to be reclassified to interest expense in the next 12 months for interest rate locks.
The effect of cash flow hedges on accumulated other comprehensive income and the condensed consolidated statements of operations for the three and six months ended June 30, 2021 and 2020 was as follows (in thousands):
| | | | | | | | | | | | | | | | | | | | | | | | | | | | | |
| Amount of gain or (loss) recognized in accumulated other comprehensive income: |
| | | Three Months Ended
June 30, | | Six Months Ended
June 30, |
| | | 2021 | | 2020 | | 2021 | | 2020 |
Foreign currency forward and option contracts (included component) (1) | | $ | 1,833 | | | $ | (22,347) | | | $ | 33,207 | | | $ | 5,678 | |
Foreign currency option contracts (excluded component) (2) | | (45) | | | 358 | | | 151 | | | 1,676 | |
Interest rate locks | | (7,040) | | | (650) | | | (1,239) | | | (26,882) | |
Total | | $ | (5,252) | | | $ | (22,639) | | | $ | 32,119 | | | $ | (19,528) | |
|
| Amount of gain or (loss) reclassified from accumulated other comprehensive income to income: |
| | | Three Months Ended
June 30, | | Six Months Ended
June 30, |
| Location of gain or (loss) | | 2021 | | 2020 | | 2021 | | 2020 |
Foreign currency forward contracts | Revenues | | $ | (16,565) | | | $ | 20,558 | | | $ | (29,534) | | | $ | 41,777 | |
Foreign currency forward contracts | Costs and operating expenses | | 8,583 | | | (10,498) | | | 15,787 | | | (21,498) | |
Interest rate locks | Interest Expense | | (1,049) | | | 90 | | | (1,854) | | | 258 | |
Total | | | $ | (9,031) | | | $ | 10,150 | | | $ | (15,601) | | | $ | 20,537 | |
| | | | | | | | | |
| Amount of gain or (loss) excluded from effectiveness testing included in income: |
| | | Three Months Ended
June 30, | | Six Months Ended
June 30, |
| Location of gain or (loss) | | 2021 | | 2020 | | 2021 | | 2020 |
| | | | | | | | | |
Foreign currency option contracts (excluded component) (2) | Revenues | | $ | (63) | | | $ | (503) | | | $ | (244) | | | $ | (1,024) | |
Total | | | $ | (63) | | | $ | (503) | | | $ | (244) | | | $ | (1,024) | |
(1)Included component represents foreign exchange spot rates.
(2)Excluded component represents option's time value.
EQUINIX, INC.
NOTES TO CONDENSED CONSOLIDATED FINANCIAL STATEMENTS - (Continued)
(Unaudited)
Derivatives Not Designated as Hedging Instruments
Embedded Derivatives. We are deemed to have foreign currency forward contracts embedded in certain of our customer agreements that are priced in currencies different from the functional or local currencies of the parties involved. These embedded derivatives are separated from their host contracts and carried on our balance sheet at their fair value. The majority of these embedded derivatives arise as a result of our foreign subsidiaries pricing their customer contracts in U.S. Dollars.
Economic Hedges of Embedded Derivatives. We use foreign currency forward contracts to manage the foreign exchange risk associated with our customer agreements that are priced in currencies different from the functional or local currencies of the parties involved ("economic hedges of embedded derivatives"). Foreign currency forward contracts represent agreements to exchange the currency of one country for the currency of another country at an agreed-upon price on an agreed-upon settlement date.
Foreign Currency Forward Contracts. We also use foreign currency forward contracts to manage the foreign exchange risk associated with certain foreign currency-denominated monetary assets and liabilities. As a result of foreign currency fluctuations, the U.S. Dollar equivalent values of our foreign currency-denominated monetary assets and liabilities change. Gains and losses on these contracts are included in other income (expense), on a net basis, along with the foreign currency gains and losses of the related foreign currency-denominated monetary assets and liabilities associated with these foreign currency forward contracts. As of June 30, 2021 and December 31, 2020, the total notional amounts of these foreign currency contracts were $5.0 billion and $3.4 billion, respectively.
The following table presents the effect of derivatives not designated as hedging instruments in our condensed consolidated statements of operations (in thousands):
| | | | | | | | | | | | | | | | | | | | | | | | | | | | | |
| Amount of gain or (loss) recognized in earnings: | | | | | | | | |
| | | Three Months Ended
June 30, | | Six Months Ended
June 30, |
| Location of gain or (loss) | | 2021 | | 2020 | | 2021 | | 2020 |
Embedded derivatives | Revenues | | $ | 650 | | | $ | (2,741) | | | $ | 5,145 | | | $ | 4,710 | |
Economic hedge of embedded derivatives | Revenues | | (279) | | | 2,301 | | | (4,492) | | | (5,601) | |
Foreign currency forward contracts | Other income (expense) | | 7,975 | | | (113,016) | | | 64,775 | | | 20,808 | |
Total | | | $ | 8,346 | | | $ | (113,456) | | | $ | 65,428 | | | $ | 19,917 | |
EQUINIX, INC.
NOTES TO CONDENSED CONSOLIDATED FINANCIAL STATEMENTS - (Continued)
(Unaudited)
Fair Value of Derivative Instruments
The following table presents the fair value of derivative instruments recognized in our condensed consolidated balance sheets as of June 30, 2021 and December 31, 2020 (in thousands):
| | | | | | | | | | | | | | | | | | | | | | | |
| June 30, 2021 | | December 31, 2020 |
| Assets (1) | | Liabilities (2) | | Assets (1) | | Liabilities (2) |
| Designated as hedging instruments: | | | | | | | |
Cash flow hedges | | | | | | | |
Foreign currency forward and option contracts | $ | 8,422 | | | $ | 27,742 | | | $ | 351 | | | $ | 52,804 | |
| | | | | | | |
Net investment hedges | | | | | | | |
Cross-currency interest rate swaps | 9,180 | | | 109,432 | | | — | | | 192,939 | |
| Foreign currency forward contracts | — | | | 27,237 | | | — | | | 17,041 | |
Total designated as hedging | 17,602 | | | 164,411 | | | 351 | | | 262,784 | |
| | | | | | | |
| Not designated as hedging instruments: | | | | | | | |
| Embedded derivatives | 5,676 | | | 1,320 | | | 3,255 | | | 3,858 | |
Economic hedges of embedded derivatives | — | | | 2,411 | | | 4,372 | | | 12 | |
Foreign currency forward contracts | 53,867 | | | 13,979 | | | 3,721 | | | 133,805 | |
Total not designated as hedging | 59,543 | | | 17,710 | | | 11,348 | | | 137,675 | |
| Total Derivatives | $ | 77,145 | | | $ | 182,121 | | | $ | 11,699 | | | $ | 400,459 | |
(1)As presented in our condensed consolidated balance sheets within other current assets and other assets.
(2)As presented in our condensed consolidated balance sheets within other current liabilities and other liabilities.
Offsetting Derivative Assets and Liabilities
We enter into master netting agreements with our counterparties for transactions other than embedded derivatives to mitigate credit risk exposure to any single counterparty. Master netting agreements allow for individual derivative contracts with a single counterparty to offset in the event of default. For presentation on the condensed consolidated balance sheets, we do not offset fair value amounts recognized for derivative instruments or the accrued interest related to cross-currency interest rate swaps under master netting arrangements. The following table presents information related to these offsetting arrangements as of June 30, 2021 and December 31, 2020 (in thousands):
| | | | | | | | | | | | | | | | | | | | | | | | | | | | | |
| Gross Amounts Offset in
Consolidated Balance Sheet | | | | |
| Gross Amounts | | Gross Amounts Offset in the Balance Sheet | | Net Amounts | | Gross Amounts not Offset in the Balance Sheet | | Net |
| June 30, 2021 | | | | | | | | | |
Derivative assets | $ | 106,488 | | | $ | — | | | $ | 106,488 | | | $ | (86,576) | | | $ | 19,912 | |
| Derivative liabilities | 197,620 | | | — | | | 197,620 | | | (86,576) | | | 111,044 | |
| | | | | | | | | |
| December 31, 2020 | | | | | | | | | |
Derivative assets | $ | 38,447 | | | $ | — | | | $ | 38,447 | | | $ | (35,100) | | | $ | 3,347 | |
| Derivative liabilities | 415,628 | | | — | | | 415,628 | | | (35,100) | | | 380,528 | |
EQUINIX, INC.
NOTES TO CONDENSED CONSOLIDATED FINANCIAL STATEMENTS - (Continued)
(Unaudited)
8. Fair Value Measurements
We perform fair value measurements in accordance with ASC 820, Fair Value Measurement, which establishes three levels of inputs that we use to measure fair value:
•Level 1: quoted prices in active markets for identical assets or liabilities.
•Level 2: observable inputs (e.g. spot rates and other data from the third-party pricing vendors for our derivative instruments) other than quoted market prices included within Level 1 that are observable, either directly or indirectly, for the assets or liabilities.
•Level 3: unobservable inputs to the valuation methodology that are significant to the measurement of the fair value of assets or liabilities.
Our financial assets and liabilities measured at fair value on a recurring basis as of June 30, 2021 and December 31, 2020 were as follows (in thousands):
| | | | | | | | | | | | | | | | | | | | | | | | | | | | | | | | | | | | | | |
| | As of June 30, 2021 | | As of December 31, 2020 |
| | | Fair Value | | Fair Value
Measurement Using | | Fair Value | | Fair Value
Measurement Using |
| | | Level 1 | | Level 2 | | | Level 1 | | Level 2 |
| Assets: | | | | | | | | | | | | |
| Money market and deposit accounts | | $ | 604,404 | | | $ | 604,404 | | | $ | — | | | $ | 611,071 | | | $ | 611,071 | | | $ | — | |
| Publicly traded equity securities | | — | | | — | | | — | | | 159 | | | 159 | | | — | |
| Certificates of deposit | | — | | | — | | | — | | | 4,373 | | | — | | | 4,373 | |
Derivative instruments (1) | | 77,145 | | | — | | | 77,145 | | | 11,699 | | | — | | | 11,699 | |
Total | | $ | 681,549 | | | $ | 604,404 | | | $ | 77,145 | | | $ | 627,302 | | | $ | 611,230 | | | $ | 16,072 | |
| Liabilities: | | | | | | | | | | | | |
Derivative instruments (1) | | $ | 182,121 | | | $ | — | | | $ | 182,121 | | | $ | 400,459 | | | $ | — | | | $ | 400,459 | |
| | | | | | | | | | | | |
(1)Amounts are included within other current assets, other assets, others current liabilities and other liabilities in the condensed consolidated balance sheets.
We did not have any nonfinancial assets or liabilities measured at fair value on a recurring basis as of June 30, 2021 and December 31, 2020.
Other than the contingent consideration related to the EMEA 1 Joint Venture as described in Note 6 above, we did not have any Level 3 financial assets or financial liabilities measured at fair value on a recurring basis as of June 30, 2021 and December 31, 2020.
EQUINIX, INC.
NOTES TO CONDENSED CONSOLIDATED FINANCIAL STATEMENTS - (Continued)
(Unaudited)
9. Leases
Significant Lease Transactions
The following table summarizes the significant lease transactions during the six months ended June 30, 2021 (in thousands):
| | | | | | | | | | | | | | | | | | | | | | | | | | | | | | | | | | | | | | | | |
| | | | | | | | Renewal/Termination Options Excluded (1) | | | | Net Incremental (2) |
| Lease | | Quarter | | Transaction | | | | | Lease Classification | | ROU assets | | ROU liabilities |
Silicon Valley 8 ("SV8") data center lease extended (3) | | Q1 | | Extended lease term by 16 years | | | | Two 10-year renewal options | | Finance Lease | | $ | 98,141 | | | $ | 100,043 | |
| | | | | | Operating Lease | | (13,685) | | | (15,586) | |
Hong Kong 3 ("HK3") data center lease extended (3) | | Q1 | | Extended lease by 10 years, which included a 5-year renewal option | | | | N/A | | Finance Lease - Building | | 37,987 | | | 37,987 | |
| Operating Lease - Land | | 6,592 | | | 6,592 | |
| Osaka 3 ("OS3") new data center and office lease | | Q2 | | New lease-15 year term | | | | 2-year renewal option on a rolling basis | | Finance Lease | | 144,122 | | 144,122 |
|
(1) These renewal/termination options are not included in determining the lease terms as we are not reasonably certain to exercise them at this time.
(2) The net incremental amounts represent the adjustments to the right of use ("ROU") assets and liabilities recorded during the quarter that the transactions were entered.
(3) These leases had components previously classified as operating leases.
Lease Expenses
The components of lease expenses are as follows (in thousands):
| | | | | | | | | | | | | | | | | | | | | | | |
| Three Months Ended
June 30, | | Six Months Ended
June 30, |
| 2021 | | 2020 | | 2021 | | 2020 |
| Finance lease cost | | | | | | | |
Amortization of ROU assets (1) | $ | 37,110 | | | $ | 28,897 | | | $ | 73,238 | | | $ | 54,062 | |
| Interest on lease liabilities | 29,823 | | | 28,438 | | | 60,016 | | | 56,263 | |
| Total finance lease cost | 66,933 | | | 57,335 | | | 133,254 | | | 110,325 | |
| | | | | | | |
| Operating lease cost | 57,045 | | | 52,556 | | | 113,499 | | | 106,347 | |
| Variable lease cost | 7,630 | | | 2,884 | | | 15,670 | | | 5,466 | |
| Total lease cost | $ | 131,608 | | | $ | 112,775 | | | $ | 262,423 | | | $ | 222,138 | |
(1) Amortization of ROU assets is included with depreciation expense, and is recorded within cost of revenues, sales and marketing and general and administrative expenses in the condensed consolidated statements of operations.
EQUINIX, INC.
NOTES TO CONDENSED CONSOLIDATED FINANCIAL STATEMENTS - (Continued)
(Unaudited)
Other Information
Other information related to leases is as follows (in thousands):
| | | | | | | | | | |
| Six Months Ended
June 30, 2021 | | | Six Months Ended
June 30, 2020 |
| Cash paid for amounts included in the measurement of lease liabilities: | | | | |
| Operating cash flows from finance leases | $ | 57,084 | | | | $ | 54,417 | |
| Operating cash flows from operating leases | 152,052 | | | | 102,146 | |
| Financing cash flows from finance leases | 98,877 | | | | 42,681 | |
| | | | |
ROU assets obtained in exchange for lease obligations: (1) | | | | |
| Finance leases | $ | 339,486 | | | | $ | 311,951 | |
| Operating leases | 50 | | | | 14,114 | |
| | | | |
| As of June 30, 2021 | | | As of December 31, 2020 |
Weighted-average remaining lease term - finance leases (2) | 14 years | | | 14 years |
Weighted-average remaining lease term - operating leases (2) | 12 years | | | 12 years |
| Weighted-average discount rate - finance leases | 7 | % | | | 7 | % |
| Weighted-average discount rate - operating leases | 4 | % | | | 4 | % |
Finance lease assets (3) | $ | 1,912,014 | | | | $ | 1,688,032 | |
(1) Represents all non-cash changes in ROU assets.
(2) Includes lease renewal options that are reasonably certain to be exercised.
(3) As of June 30, 2021 and December 31, 2020, we recorded accumulated amortization of finance lease assets of $651.5 million and $604.1 million, respectively. Finance lease assets are recorded within property, plant and equipment, net on the condensed consolidated balance sheets.
Maturities of Lease Liabilities
Maturities of lease liabilities as of June 30, 2021 are as follows (in thousands):
| | | | | | | | | | | | | | | | | |
| Operating Leases | | Finance Leases | | Total |
| 2021 (6 months remaining) | $ | 91,036 | | | $ | 123,694 | | | $ | 214,730 | |
| 2022 | 194,169 | | | 240,595 | | | 434,764 | |
| 2023 | 179,406 | | | 233,830 | | | 413,236 | |
| 2024 | 166,529 | | | 232,142 | | | 398,671 | |
| 2025 | 157,801 | | | 228,757 | | | 386,558 | |
| Thereafter | 1,012,325 | | | 2,153,595 | | | 3,165,920 | |
| Total lease payments | 1,801,266 | | | 3,212,613 | | | 5,013,879 | |
| Plus amount representing residual property value | — | | | 16,268 | | | 16,268 | |
| Less imputed interest | (460,487) | | | (1,080,555) | | | (1,541,042) | |
| | | | | |
| | | | | |
| Total | $ | 1,340,779 | | | $ | 2,148,326 | | | $ | 3,489,105 | |
We entered into agreements with various landlords primarily to lease data center spaces and ground leases which have not yet commenced as of June 30, 2021. These leases will commence between year 2021 and 2023, with lease terms of 12 to 20 years and total lease commitments of approximately $360.5 million.
EQUINIX, INC.
NOTES TO CONDENSED CONSOLIDATED FINANCIAL STATEMENTS - (Continued)
(Unaudited)
10. Debt Facilities
Mortgage and Loans Payable
As of June 30, 2021 and December 31, 2020, our mortgage and loans payable consisted of the following (in thousands):
| | | | | | | | | | | |
| June 30,
2021 | | December 31, 2020 |
| Term loans | $ | 578,084 | | | $ | 1,292,067 | |
| | | |
| Mortgage payable and loans payable | 74,761 | | | 78,903 | |
| 652,845 | | | 1,370,970 | |
| Less amount representing unamortized debt discount and debt issuance cost | (565) | | | (3,288) | |
| Add amount representing unamortized mortgage premium | 1,741 | | | 1,861 | |
| 654,021 | | | 1,369,543 | |
| Less current portion | (42,580) | | | (82,289) | |
Total | $ | 611,441 | | | $ | 1,287,254 | |
Senior Credit Facility
In 2017, we entered into a credit agreement with a group of lenders for a $3.0 billion credit facility ("Senior Credit Facility"), comprised of a $2.0 billion senior unsecured multicurrency revolving credit facility ("Revolving Facility") and an approximately $1.0 billion senior unsecured multicurrency term loan facility (the "Term Loan Facility"). The credit agreement was subsequently amended to provide an additional senior unsecured term loan in Japanese Yen for approximately $424.7 million at the exchange rate effective on the transaction date.
On May 17, 2021, using a portion of the net cash proceeds from the 2026 Notes, 2028 Notes, 2031 Notes, and 2052 Notes as described below, we repaid our outstanding term loans in Swedish Krona and Japanese Yen under our Term Loan Facility for $285.4 million and $374.5 million in U.S. Dollars, respectively, at the exchange rates in effect on May 17, 2021. We incurred an insignificant loss on debt extinguishment for the repayment of both term loans during the three months ended June 30, 2021. As of June 30, 2021 and December 31, 2020, the total amounts outstanding under the Term Loan Facility, net of debt issuance costs, were $577.5 million and $1.3 billion, respectively.
As of June 30, 2021, we had 39 irrevocable letters of credit totaling $78.7 million issued and outstanding under the Revolving Facility, with approximately $1.9 billion remaining available to borrow under the Revolving Facility.
EQUINIX, INC.
NOTES TO CONDENSED CONSOLIDATED FINANCIAL STATEMENTS - (Continued)
(Unaudited)
Senior Notes
As of June 30, 2021 and December 31, 2020, our senior notes consisted of the following (in thousands):
| | | | | | | | | | | | | | | | | | | | | | | |
| June 30, 2021 | | December 31, 2020 |
| Amount | | Effective Rate | | Amount | | Effective Rate |
5.000% Infomart Senior Notes | $ | — | | | — | % | | $ | 150,000 | | | 4.51 | % |
2.625% Senior Notes due 2024 | 1,000,000 | | | 2.79 | % | | 1,000,000 | | | 2.79 | % |
1.250% Senior Notes due 2025 | 500,000 | | | 1.46 | % | | 500,000 | | | 1.46 | % |
1.000% Senior Notes Due 2025 | 700,000 | | | 1.18 | % | | 700,000 | | | 1.18 | % |
2.900% Senior Notes due 2026 | 600,000 | | | 3.04 | % | | 600,000 | | | 3.04 | % |
2.875% Euro Senior Notes due 2026 | — | | | — | % | | 611,050 | | | 3.04 | % |
1.450% Senior Notes due 2026 | 700,000 | | | 1.64 | % | | — | | | — | % |
0.250% Euro Senior Notes due 2027 | 592,500 | | | 0.45 | % | | — | | | — | % |
1.800% Senior Notes due 2027 | 500,000 | | | 1.96 | % | | 500,000 | | | 1.96 | % |
5.375% Senior Notes due 2027 | — | | | — | % | | 1,250,000 | | | 5.51 | % |
1.550% Senior Notes due 2028 | 650,000 | | | 1.67 | % | | 650,000 | | | 1.67 | % |
2.000% Senior Notes due 2028 | 400,000 | | | 2.21 | % | | — | | | — | % |
3.200% Senior Notes due 2029 | 1,200,000 | | | 3.30 | % | | 1,200,000 | | | 3.30 | % |
2.150% Senior Notes due 2030 | 1,100,000 | | | 2.27 | % | | 1,100,000 | | | 2.27 | % |
2.500% Senior Notes due 2031 | 1,000,000 | | | 2.65 | % | | — | | | — | % |
1.000% Euro Senior Notes due 2033 | 711,000 | | | 1.18 | % | | — | | | — | % |
3.000% Senior Notes due 2050 | 500,000 | | | 3.09 | % | | 500,000 | | | 3.09 | % |
2.950% Senior Notes due 2051 | 500,000 | | | 3.00 | % | | 500,000 | | | 3.00 | % |
3.400% Senior Notes due 2052 | 500,000 | | | 3.50 | % | | — | | | — | % |
| 11,153,500 | | | | | 9,261,050 | | | |
| Less amount representing unamortized debt issuance cost | (126,257) | | | | | (92,773) | | | |
| Add amount representing unamortized debt premium | — | | | | | 186 | | | |
| 11,027,243 | | | | | 9,168,463 | | | |
| Less current portion | — | | | | | (150,186) | | | |
Total | $ | 11,027,243 | | | | | $ | 9,018,277 | | | |
EQUINIX, INC.
NOTES TO CONDENSED CONSOLIDATED FINANCIAL STATEMENTS - (Continued)
(Unaudited)
0.250% Euro Senior Notes due 2027 and 1.000% Euro Senior Notes due 2033
On March 10, 2021, we issued €500.0 million, or approximately $594.9 million in U.S. dollars, at the exchange rate in effect on March 10, 2021, aggregate principal amount of 0.250% senior notes due March 15, 2027 (the "2027 Euro Notes") and €600.0 million, or approximately $713.8 million in U.S. dollars, at the exchange rate in effect on March 10, 2021, aggregate principal amount of 1.000% senior notes due March 15, 2033 (the "2033 Euro Notes").
Interest on the notes is payable annually in arrears on March 15 of each year, commencing on March 15, 2022. Total debt issuance costs and debt discounts related to the 2027 Euro Notes and the 2033 Euro Notes were $7.0 million and $14.1 million, respectively.
Redemption of 2.875% Euro Senior Notes due 2026
On March 24, 2021, using a portion of the net cash proceeds from the 2027 Euro Senior Notes and 2033 Euro Senior Notes, we redeemed the remaining outstanding 2.875% Euro Senior Notes due 2026 for $590.7 million in U.S. dollars, at the exchange rate in effect on March 24, 2021. In connection with the redemption, we incurred $13.2 million of loss on debt extinguishment, including $8.5 million in redemption premium that was paid in cash and $4.7 million related to the write-off of unamortized debt issuance costs, during the three months ended March 31, 2021.
1.450% Senior Notes due 2026, 2.000% Senior Notes due 2028, 2.500% Senior Notes due 2031 and 3.400% Senior Notes due 2052
On May 17, 2021, we issued $700.0 million aggregate principal amount of 1.450% senior notes due 2026 (the "2026 Notes"), $400.0 million aggregate principal amount of 2.000% senior notes due 2028 (the "2028 Notes"), $1.0 billion aggregate principal amount of 2.500% senior notes due 2031 (the "2031 Notes"), and $500.0 million aggregate principal amount of 3.400% senior notes due 2052 (the "2052 Notes").
Interest on the 2026, 2028 and 2031 notes are payable semi-annually on May 15 and November 15 of each year, commencing on November 15, 2021. Interest on the 2052 notes are payable semi-annually on February 15 and August 15 of each year, commencing on February 15, 2022. Total debt issuance costs and debt discounts related to the 2026 Notes, 2028 Notes, 2031 Notes and 2052 Notes were $6.4 million, $5.3 million, $13.0 million and $9.3 million, respectively.
Redemption of 5.375% Senior Notes due 2027
On June 2, 2021, we redeemed all outstanding principal amount under the 5.375% Senior Notes due 2027 with a portion of the net cash proceeds from the issuance of the 2026 Notes, 2028 Notes, 2031 Notes, and 2052 Notes as described above. In connection with the redemption, we incurred $100.6 million of loss on debt extinguishment, including $90.7 million redemption premium that was paid in cash and $9.9 million related to the write-off of unamortized debt issuance costs.
Maturities of Debt Instruments
The following table sets forth maturities of our debt, including mortgage and loans payable, and senior notes, gross of debt issuance costs, debt discounts and debt premiums, as of June 30, 2021 (in thousands):
| | | | | |
| Years ending: | |
| 2021 (6 months remaining) | $ | 21,357 | |
| 2022 | 595,170 | |
| 2023 | 6,832 | |
| 2024 | 1,006,379 | |
| 2025 | 1,204,769 | |
| Thereafter | 8,973,579 | |
| Total | $ | 11,808,086 | |
EQUINIX, INC.
NOTES TO CONDENSED CONSOLIDATED FINANCIAL STATEMENTS - (Continued)
(Unaudited)
Fair Value of Debt Instruments
The following table sets forth the estimated fair values of our mortgage and loans payable and senior notes, including current maturities, as of (in thousands):
| | | | | | | | | | | |
| June 30,
2021 | | December 31,
2020 |
| Mortgage and loans payable | $ | 657,921 | | | $ | 1,379,129 | |
| Senior notes | 11,301,438 | | | 9,705,486 | |
The fair values of the mortgage and loans payable, which are not publicly traded, were estimated by considering our credit rating, current rates available to us for debt of the same remaining maturities and terms of the debt (Level 2). The fair value of the senior notes, which are traded in the public debt market, was based on quoted market prices (Level 1).
Interest Charges
The following table sets forth total interest costs incurred, and total interest costs capitalized for the periods presented (in thousands):
| | | | | | | | | | | | | | | | | | | | | | | |
| | Three Months Ended
June 30, | | Six Months Ended
June 30, |
| | 2021 | | 2020 | | 2021 | | 2020 |
| Interest expense | $ | 87,231 | | | $ | 108,480 | | | $ | 176,912 | | | $ | 215,818 | |
| Interest capitalized | 6,684 | | | 6,880 | | | 12,792 | | | 12,911 | |
| Interest charges incurred | $ | 93,915 | | | $ | 115,360 | | | $ | 189,704 | | | $ | 228,729 | |
Total interest paid in cash, net of capitalized interest, during the three months ended June 30, 2021 and 2020 was $122.0 million and $115.8 million, respectively. Total interest paid in cash, net of capitalized interest, during the six months ended June 30, 2021 and 2020 was $216.9 million and $238.6 million, respectively.
11. Commitments and Contingencies
Purchase and Other Commitments
As a result of our various IBX data center expansion projects, as of June 30, 2021, we were contractually committed for approximately $1.5 billion of unaccrued capital expenditures, primarily for IBX infrastructure equipment not yet delivered and labor not yet provided, in connection with the work necessary to open these IBX data centers and make them available to our customers for installation. We also had numerous other, non-capital purchase commitments in place as of June 30, 2021, such as commitments to purchase power in select locations through the remainder of 2021 and thereafter, and other open purchase orders for goods or services to be delivered or provided during the remainder of 2021 and thereafter. Such other miscellaneous purchase commitments totaled approximately $1.3 billion as of June 30, 2021. For further information on equity contribution commitments and lease commitments, see Note 6 and Note 9, respectively, above.
Contingent Liabilities
We estimate our exposure on certain liabilities, such as indirect and property taxes, based on the best information available at the time of determination. With respect to real and personal property taxes, we record what we can reasonably estimate based on prior payment history, assessed value by the assessor's office, current landlord estimates or estimates based on current or changing fixed asset values in each specific municipality, as applicable. However, there are circumstances beyond our control whereby the underlying value of the property or basis for which the tax is calculated on the property may change, such as a landlord selling the underlying property of one of our IBX data center leases or a municipality changing the assessment value in a jurisdiction and, as a result, our property tax obligations may vary from period to period. Based upon the most current facts and circumstances, we make the necessary property tax accruals for each of our reporting periods. However, revisions in our estimates of the potential or actual liability could materially impact our financial position, results of operations or cash flows.
EQUINIX, INC.
NOTES TO CONDENSED CONSOLIDATED FINANCIAL STATEMENTS - (Continued)
(Unaudited)
Our indirect and property tax filings in various jurisdictions are subject to examination by local tax authorities. Although we believe that we have adequately assessed and accounted for our potential tax liabilities, and that our tax estimates are reasonable, there can be no certainty that additional taxes will not be due upon audit of our tax returns or as a result of further changes to the tax laws and interpretations thereof. For example, we are currently undergoing an audit and appealing the tentative assessment in Brazil. The final settlement of the audit and the outcome of the appeal are uncertain and may not be resolved in our favor. We regularly assess the likelihood of adverse outcomes resulting from these examinations and appeals that would affect the adequacy of our tax accruals for each of the reporting periods. If any issues arising from the tax examinations and appeals are resolved in a manner inconsistent with our expectations, the revision of the estimates of the potential or actual liabilities could materially impact our financial position, results of operations, or cash flows.
Indemnification and Guarantor Arrangements
As permitted under Delaware law, we have agreements whereby we indemnify our officers and directors for certain events or occurrences while the officer or director is, or was serving, at our request in such capacity. The term of the indemnification period is for the officer's or director's lifetime. The maximum potential amount of future payments we could be required to make under these indemnification agreements is unlimited; however, we have a director and officer insurance policy that could limit our exposure and enable us to recover a portion of any future amounts paid. As a result of our insurance policy that could limit our exposure and enable us to recover some or all of amounts paid, we believe the estimated fair value of these indemnification agreements is minimal. We have no liabilities recorded for these agreements as of June 30, 2021.
We enter into standard indemnification agreements in the ordinary course of business. Pursuant to these agreements, we indemnify, hold harmless, and agree to reimburse the indemnified party for losses suffered or incurred by the indemnified party, generally our business partners or customers, in connection with any U.S. patent, or any copyright or other intellectual property infringement claim by any third party with respect to our offerings. The term of these indemnification agreements is generally perpetual any time after execution of the agreement. The maximum potential amount of future payments we could be required to make under these indemnification agreements is unlimited; however, we have never incurred costs to defend lawsuits or settle claims related to these indemnification agreements. As a result, we believe the estimated fair value of these agreements is minimal. We have no liabilities recorded for these agreements as of June 30, 2021.
We enter into arrangements with our business partners, whereby the business partner agrees to provide services as a subcontractor for our installations. Accordingly, we enter into standard indemnification agreements with our customers, whereby we indemnify them for other acts, such as personal property damage, of our subcontractors. The maximum potential amount of future payments we could be required to make under these indemnification agreements is unlimited; however, we have general and umbrella insurance policies that could enable us to recover a portion of any amounts paid. We have never incurred costs to defend lawsuits or settle claims related to these indemnification agreements. As a result, we believe the estimated fair value of these agreements is minimal. We have no liabilities recorded for these agreements as of June 30, 2021.
We have service level commitment obligations to certain of our customers. As a result, service interruptions or significant equipment damage in our IBX data centers, whether or not within our control, could result in service level commitments to these customers. Our liability insurance may not be adequate to cover those expenses. In addition, any loss of services, equipment damage or inability to meet our service level commitment obligations could reduce the confidence of our customers and could consequently impair our ability to obtain and retain customers, which would adversely affect both our ability to generate revenues and our operating results. We generally have the ability to determine such service level credits prior to the associated revenue being recognized. We do not have significant liabilities in connection with service level credits as of June 30, 2021.
EQUINIX, INC.
NOTES TO CONDENSED CONSOLIDATED FINANCIAL STATEMENTS - (Continued)
(Unaudited)
12. Stockholders' Equity
Stockholders' Equity Rollforward
The following tables provide a rollforward of our stockholders' equity for the three and six months ended June 30, 2021 and 2020 (in thousands, except share and per share data):
| | | | | | | | | | | | | | | | | | | | | | | | | | | | | | | | | | | | | | | | | | | | | | | | | | | | | | | | | | | | | | | | | |
| | | | | | | | | | | | | AOCI (Loss) | | Retained
Earnings | | Equinix
Stockholders'
Equity | | Non-controlling Interests | | Total Stockholders' Equity |
| Common Stock | | Treasury Stock | | Additional
Paid-in Capital | | Accumulated
Dividends | | | | | |
| Shares | | Amount | | Shares | | Amount | | | | | | | |
| Balance as of December 31, 2020 | 89,462,304 | | | $ | 89 | | | (328,052) | | | $ | (122,118) | | | $ | 15,028,357 | | | $ | (5,119,274) | | | $ | (913,368) | | | $ | 1,760,302 | | | $ | 10,633,988 | | | $ | 130 | | | $ | 10,634,118 | |
| | | | | | | | | | | | | | | | | | | | | |
| Net income (loss) | — | | | — | | | — | | | — | | | — | | | — | | | — | | | 156,362 | | | 156,362 | | | (288) | | | 156,074 | |
| Other comprehensive loss | — | | | — | | | — | | | — | | | — | | | — | | | (95,480) | | | — | | | (95,480) | | | (1) | | | (95,481) | |
| Issuance of common stock and release of treasury stock for employee equity awards | 428,618 | | | 1 | | | 11,640 | | | 4,332 | | | 35,701 | | | — | | | — | | | — | | | 40,034 | | | — | | | 40,034 | |
| | | | | | | | | | | | | | | | | | | | | |
Dividend distribution on common stock, $2.87 per share | — | | | — | | | — | | | — | | | — | | | (256,321) | | | — | | | — | | | (256,321) | | | — | | | (256,321) | |
| Settlement of accrued dividends on vested equity awards | — | | | — | | | — | | | — | | | — | | | (437) | | | — | | | — | | | (437) | | | — | | | (437) | |
| Accrued dividends on unvested equity awards | — | | | — | | | — | | | — | | | — | | | (3,661) | | | — | | | — | | | (3,661) | | | — | | | (3,661) | |
| Stock-based compensation, net of estimated forfeitures | — | | | — | | | — | | | | | 102,349 | | | — | | | — | | | — | | | 102,349 | | | — | | | 102,349 | |
| | | | | | | | | | | | | | | | | | | | | |
| Balance as of March 31, 2021 | 89,890,922 | | | 90 | | | (316,412) | | | (117,786) | | | 15,166,407 | | | (5,379,693) | | | (1,008,848) | | | 1,916,664 | | | 10,576,834 | | | (159) | | | 10,576,675 | |
| | | | | | | | | | | | | | | | | | | | | |
| Net income | — | | | — | | | — | | | — | | | — | | | — | | | — | | | 68,339 | | | 68,339 | | | 148 | | | 68,487 | |
| Other comprehensive income | — | | | — | | | — | | | — | | | — | | | — | | | 67,734 | | | — | | | 67,734 | | | 11 | | | 67,745 | |
| Issuance of common stock and release of treasury stock for employee equity awards | 36,674 | | | — | | | 1,389 | | | 516 | | | (516) | | | — | | | — | | | — | | | — | | | — | | | — | |
| Issuance of common stock under ATM Program | 137,604 | | | — | | | — | | | — | | | 99,599 | | | — | | | — | | | — | | | 99,599 | | | — | | | 99,599 | |
| | | | | | | | | | | | | | | | | | | | | |
Dividend distribution on common stock, $2.87 per share | — | | | — | | | — | | | — | | | — | | | (257,199) | | | — | | | — | | | (257,199) | | | — | | | (257,199) | |
| Settlement of accrued dividends on vested equity awards | — | | | — | | | — | | | — | | | — | | | (55) | | | — | | | — | | | (55) | | | — | | | (55) | |
| Accrued dividends on unvested equity awards | — | | | — | | | — | | | — | | | — | | | (4,016) | | | — | | | — | | | (4,016) | | | — | | | (4,016) | |
| Stock-based compensation, net of estimated forfeitures | — | | | — | | | — | | | — | | | 95,236 | | | — | | | — | | | — | | | 95,236 | | | — | | | 95,236 | |
| | | | | | | | | | | | | | | | | | | | | |
| Balance as of June 30, 2021 | 90,065,200 | | | $ | 90 | | | (315,023) | | | $ | (117,270) | | | $ | 15,360,726 | | | $ | (5,640,963) | | | $ | (941,114) | | | $ | 1,985,003 | | | $ | 10,646,472 | | | $ | — | | | $ | 10,646,472 | |
| | | | | | | | | | | | | | | | | | | | | |
| | | | | | | | | | | | | | | | | | | | | |
| | | | | | | | | | | | | | | | | | | | | |
| | | | | | | | | | | | | | | | | | | | | |
| | | | | | | | | | | | | | | | | | | | | |
| | | | | | | | | | | | | | | | | | | | | |
| | | | | | | | | | | | | | | | | | | | | |
| | | | | | | | | | | | | | | | | | | | | |
| | | | | | | | | | | | | | | | | | | | | |
| | | | | | | | | | | | | | | | | | | | | |
| | | | | | | | | | | | | | | | | | | | | |
EQUINIX, INC.
NOTES TO CONDENSED CONSOLIDATED FINANCIAL STATEMENTS - (Continued)
(Unaudited)
| | | | | | | | | | | | | | | | | | | | | | | | | | | | | | | | | | | | | | | | | | | | | | | | | | | | | | | | | | | | | | | | | |
| | | | | | | | | Additional
Paid-in Capital | | Accumulated
Dividends | | AOCI (Loss) | | Retained
Earnings | | Equinix
Stockholders'
Equity | | Non-controlling interests | | Total Stockholders' Equity |
| Common Stock | | Treasury Stock | | | | | | | |
| Shares | | Amount | | Shares | | Amount | | | | | | | |
| Balance as of December 31, 2019 | 85,700,953 | | | $ | 86 | | | (392,567) | | | $ | (144,256) | | | $ | 12,696,433 | | | $ | (4,168,469) | | | $ | (934,613) | | | $ | 1,391,425 | | | $ | 8,840,606 | | | $ | (224) | | | $ | 8,840,382 | |
| Adjustment from adoption of new accounting standard update | — | | | — | | | — | | | — | | | — | | | — | | | — | | | (900) | | | (900) | | | — | | | (900) | |
| Net income | — | | | — | | | — | | | — | | | — | | | — | | | — | | | 118,792 | | | 118,792 | | | 165 | | | 118,957 | |
| Other comprehensive loss | — | | | — | | | — | | | — | | | — | | | — | | | (272,056) | | | — | | | (272,056) | | | (11) | | | (272,067) | |
| Issuance of common stock and release of treasury stock for employee equity awards | 405,550 | | | — | | | 50,594 | | | 16,958 | | | 13,432 | | | — | | | — | | | — | | | 30,390 | | | — | | | 30,390 | |
| Issuance of common stock under ATM Program | 162,530 | | | — | | | — | | | — | | | 101,791 | | | — | | | — | | | — | | | 101,791 | | | — | | | 101,791 | |
Dividend distribution on common stock, $2.66 per share | — | | | — | | | — | | | — | | | — | | | (227,387) | | | — | | | — | | | (227,387) | | | — | | | (227,387) | |
| Settlement of accrued dividends on vested equity awards | — | | | — | | | — | | | — | | | 109 | | | (403) | | | — | | | — | | | (294) | | | — | | | (294) | |
| Accrued dividends on unvested equity awards | — | | | — | | | — | | | — | | | — | | | (3,268) | | | — | | | — | | | (3,268) | | | — | | | (3,268) | |
| Stock-based compensation, net of estimated forfeitures | — | | | — | | | — | | | — | | | 81,690 | | | — | | | — | | | — | | | 81,690 | | | — | | | 81,690 | |
| | | | | | | | | | | | | | | | | | | | | |
| Balance as of March 31, 2020 | 86,269,033 | | | 86 | | | (341,973) | | | (127,298) | | | 12,893,455 | | | (4,399,527) | | | (1,206,669) | | | 1,509,317 | | | 8,669,364 | | | (70) | | | 8,669,294 | |
| | | | | | | | | | | | | | | | | | | | | |
| Net income | — | | | — | | | — | | | — | | | — | | | — | | | — | | | 133,304 | | | 133,304 | | | 46 | | | 133,350 | |
| Other comprehensive income | — | | | — | | | — | | | — | | | — | | | — | | | 66,378 | | | — | | | 66,378 | | | 2 | | | 66,380 | |
| Issuance of common stock and release of treasury stock for employee equity awards | 34,146 | | | — | | | 688 | | | 256 | | | (256) | | | — | | | — | | | — | | | — | | | — | | | — | |
| | | | | | | | | | | | | | | | | | | | | |
| Issuance of common stock for equity offering | 2,587,500 | | | 3 | | | — | | | — | | | 1,683,103 | | | — | | | — | | | — | | | 1,683,106 | | | — | | | 1,683,106 | |
Dividend distribution on common stock, $2.66 per share | — | | | — | | | — | | | — | | | — | | | (235,334) | | | — | | | — | | | (235,334) | | | — | | | (235,334) | |
| Settlement of accrued dividends on vested equity awards | — | | | — | | | — | | | — | | | — | | | (44) | | | — | | | — | | | (44) | | | — | | | (44) | |
| Accrued dividends on unvested equity awards | — | | | — | | | — | | | — | | | — | | | (4,136) | | | — | | | — | | | (4,136) | | | — | | | (4,136) | |
| Stock-based compensation, net of estimated forfeitures | — | | | — | | | — | | | — | | | 75,642 | | | — | | | — | | | — | | | 75,642 | | | — | | | 75,642 | |
| | | | | | | | | | | | | | | | | | | | | |
| Balance as of June 30, 2020 | 88,890,679 | | | $ | 89 | | | (341,285) | | | $ | (127,042) | | | $ | 14,651,944 | | | $ | (4,639,041) | | | $ | (1,140,291) | | | $ | 1,642,621 | | | $ | 10,388,280 | | | $ | (22) | | | $ | 10,388,258 | |
| | | | | | | | | | | | | | | | | | | | | |
| | | | | | | | | | | | | | | | | | | | | |
| | | | | | | | | | | | | | | | | | | | | |
| | | | | | | | | | | | | | | | | | | | | |
| | | | | | | | | | | | | | | | | | | | | |
| | | | | | | | | | | | | | | | | | | | | |
| | | | | | | | | | | | | | | | | | | | | |
| | | | | | | | | | | | | | | | | | | | | |
| | | | | | | | | | | | | | | | | | | | | |
| | | | | | | | | | | | | | | | | | | | | |
| | | | | | | | | | | | | | | | | | | | | |
| | | | | | | | | | | | | | | | | | | | | |
| | | | | | | | | | | | | | | | | | | | | |
| | | | | | | | | | | | | | | | | | | | | |
| | | | | | | | | | | | | | | | | | | | | |
| | | | | | | | | | | | | | | | | | | | | |
| | | | | | | | | | | | | | | | | | | | | |
| | | | | | | | | | | | | | | | | | | | | |
| | | | | | | | | | | | | | | | | | | | | |
| | | | | | | | | | | | | | | | | | | | | |
| | | | | | | | | | | | | | | | | | | | | |
| | | | | | | | | | | | | | | | | | | | | |
| | | | | | | | | | | | | | | | | | | | | |
EQUINIX, INC.
NOTES TO CONDENSED CONSOLIDATED FINANCIAL STATEMENTS - (Continued)
(Unaudited)
Accumulated Other Comprehensive Loss
The changes in accumulated other comprehensive loss, net of tax, by components are as follows (in thousands):
| | | | | | | | | | | | | | | | | | | |
| Balance as of December 31,
2020 | | Net
Change | | | | Balance as of June 30,
2021 |
| Foreign currency translation adjustment ("CTA") gain (loss) | $ | (508,415) | | | $ | (184,690) | | | | | $ | (693,105) | |
Unrealized gain (loss) on cash flow hedges (1) | (67,152) | | | 23,778 | | | | | (43,374) | |
Net investment hedge CTA gain (loss) (1) | (336,934) | | | 133,139 | | | | | (203,795) | |
Net actuarial gain (loss) on defined benefit plans (2) | (867) | | | 27 | | | | | (840) | |
Accumulated other comprehensive loss attributable to Equinix | $ | (913,368) | | | $ | (27,746) | | | | | $ | (941,114) | |
| | | | | | | |
| | | | | | | |
(1)Refer to Note 7 for a discussion of the amounts reclassified from accumulated other comprehensive loss to net income.
(2)We have two defined benefit pension plans covering all employees in two countries where such plan is mandated by law.
Changes in foreign currencies can have a significant impact to our condensed consolidated balance sheets (as evidenced above in our foreign currency translation loss), as well as our consolidated results of operations, as amounts in foreign currencies are generally translated into more U.S. Dollars when the U.S. Dollar weakens or fewer U.S. Dollars when the U.S. Dollar strengthens. As of June 30, 2021, the U.S. Dollar was generally stronger relative to certain of the currencies of the foreign countries in which we operate as compared to December 31, 2020. Because of this, the U.S. Dollar had an overall unfavorable impact on our condensed consolidated financial position because the foreign denominations translated into fewer U.S. Dollars as evidenced by an increase in foreign currency translation loss for the six months ended June 30, 2021 as reflected in the condensed consolidated statements of comprehensive income (loss). The volatility of the U.S. Dollar as compared to the other currencies in which we operate could have a significant impact on our condensed consolidated financial position and results of operations including the amount of revenue that we report in future periods.
Common Stock
In October 2020, we established an ATM program, under which we may, from time to time, offer and sell up to an aggregate of $1.5 billion of our common stock to or through sales agents in "at the market" transactions (the "2020 ATM Program"). For the three and six months ended June 30, 2021, we sold 137,604 shares under the 2020 ATM Program, for approximately $99.6 million, net of payment of commissions to sales agents and other offering expenses. As of June 30, 2021, we had $1.4 billion available for sale under the 2020 ATM Program. For the three months ended June 30, 2020, no shares were sold under our prior ATM program and for the six months ended June 30, 2020, we sold 162,530 shares under our prior ATM program for approximately $101.8 million, net of payment of commissions to sales agents and other offering expenses.
In May 2020, we issued and sold 2,587,500 shares of common stock in a public offering pursuant to a registration statement and a related prospectus and prospectus supplement. We received net proceeds of approximately $1.7 billion, net of underwriting discounts, commissions and offering expenses.
Stock-Based Compensation
For the six months ended June 30, 2021, the Compensation Committee and/or the Stock Award Committee of our Board of Directors, as the case may be, approved the issuance of an aggregate of 689,992 shares of restricted stock units ("RSUs") to certain employees, including executive officers. These equity awards are subject to vesting provisions and have a weighted-average grant date fair value of $661.05 per share and a weighted-average requisite service period of 3.59 years. The valuation of RSUs with only a service condition or a service and performance condition require no significant assumptions as the fair value for these types of equity awards is based solely on the fair value of our stock price on the date of grant. We use revenues and adjusted funds from operations ("AFFO") per share as the performance measurements in the RSUs with both service and performance conditions that were granted in the six months ended June 30, 2021.
EQUINIX, INC.
NOTES TO CONDENSED CONSOLIDATED FINANCIAL STATEMENTS - (Continued)
(Unaudited)
We use a Monte Carlo simulation option-pricing model to determine the fair value of RSUs with a service and market condition. We used total shareholder return ("TSR") as the performance measurement in the RSUs with a service and market condition that were granted in the six months ended June 30, 2021. There were no significant changes in the assumptions used to determine the fair value of RSUs with a service and market condition that were granted in 2021 compared to the prior year.
The following table presents, by operating expense category, our stock-based compensation expense recognized in our condensed consolidated statements of operations (in thousands):
| | | | | | | | | | | | | | | | | | | | | | | |
| | Three Months Ended
June 30, | | Six Months Ended
June 30, |
| | 2021 | | 2020 | | 2021 | | 2020 |
| Cost of revenues | $ | 10,008 | | | $ | 7,655 | | | $ | 18,475 | | | $ | 16,998 | |
| Sales and marketing | 20,779 | | | 18,215 | | | 38,482 | | | 36,760 | |
| General and administrative | 63,548 | | | 49,974 | | | 115,728 | | | 102,652 | |
| Total | $ | 94,335 | | | $ | 75,844 | | | $ | 172,685 | | | $ | 156,410 | |
13. Segment Information
While we have one primary line of business, which is the design, build-out and operation of IBX data centers, we have determined that we have three reportable segments comprised of our Americas, EMEA and Asia-Pacific geographic regions. Our chief operating decision-maker evaluates performance, makes operating decisions and allocates resources based on our revenues and adjusted EBITDA performance both on a consolidated basis and based on these three reportable segments. Intercompany transactions between segments are excluded for management reporting purposes.
EQUINIX, INC.
NOTES TO CONDENSED CONSOLIDATED FINANCIAL STATEMENTS - (Continued)
(Unaudited)
The following tables present revenue information disaggregated by product lines and geographic areas, (in thousands):
| | | | | | | | | | | | | | | | | | | | | | | | | | | | | | | | | | | | | | | | | | | | | | | |
| Three Months Ended June 30, 2021 | | Six Months Ended June 30, 2021 |
| Americas | | EMEA | | Asia-Pacific | | Total | | Americas | | EMEA | | Asia-Pacific | | Total |
Colocation (1) | $ | 497,659 | | | $ | 398,703 | | | $ | 259,573 | | | $ | 1,155,935 | | | $ | 985,118 | | | $ | 786,978 | | | $ | 514,131 | | | $ | 2,286,227 | |
| Interconnection | 167,618 | | | 65,258 | | | 54,898 | | | 287,774 | | | 332,505 | | | 126,908 | | | 108,080 | | | 567,493 | |
| Managed infrastructure | 40,734 | | | 31,176 | | | 22,094 | | | 94,004 | | | 79,219 | | | 63,287 | | | 44,843 | | | 187,349 | |
Other (1) | 451 | | | 3,682 | | | 616 | | | 4,749 | | | 2,489 | | | 8,728 | | | 1,109 | | | 12,326 | |
| Recurring revenues | 706,462 | | | 498,819 | | | 337,181 | | | 1,542,462 | | | 1,399,331 | | | 985,901 | | | 668,163 | | | 3,053,395 | |
| Non-recurring revenues | 44,181 | | | 39,110 | | | 32,166 | | | 115,457 | | | 77,252 | | | 70,745 | | | 52,591 | | | 200,588 | |
| Total | $ | 750,643 | | | $ | 537,929 | | | $ | 369,347 | | | $ | 1,657,919 | | | $ | 1,476,583 | | | $ | 1,056,646 | | | $ | 720,754 | | | $ | 3,253,983 | |
(1) Includes some leasing and hedging activities.
| | | | | | | | | | | | | | | | | | | | | | | | | | | | | | | | | | | | | | | | | | | | | | | |
| Three Months Ended June 30, 2020 | | Six Months Ended June 30, 2020 |
| Americas | | EMEA | | Asia-Pacific | | Total | | Americas | | EMEA | | Asia-Pacific | | Total |
Colocation (1) | $ | 447,498 | | | $ | 381,144 | | | $ | 228,803 | | | $ | 1,057,445 | | | $ | 898,452 | | | $ | 743,474 | | | $ | 449,896 | | | $ | 2,091,822 | |
| Interconnection | 153,387 | | | 50,904 | | | 45,140 | | | 249,431 | | | 304,316 | | | 99,445 | | | 87,811 | | | 491,572 | |
| Managed infrastructure | 28,889 | | | 29,012 | | | 22,150 | | | 80,051 | | | 54,418 | | | 59,149 | | | 43,974 | | | 157,541 | |
Other (1) | 5,081 | | | 6,130 | | | — | | | 11,211 | | | 10,301 | | | 8,596 | | | — | | | 18,897 | |
| Recurring revenues | 634,855 | | | 467,190 | | | 296,093 | | | 1,398,138 | | | 1,267,487 | | | 910,664 | | | 581,681 | | | 2,759,832 | |
| Non-recurring revenues | 26,564 | | | 20,900 | | | 24,519 | | | 71,983 | | | 55,837 | | | 56,335 | | | 42,659 | | | 154,831 | |
| Total | $ | 661,419 | | | $ | 488,090 | | | $ | 320,612 | | | $ | 1,470,121 | | | $ | 1,323,324 | | | $ | 966,999 | | | $ | 624,340 | | | $ | 2,914,663 | |
(1) Includes some leasing and hedging activities.
EQUINIX, INC.
NOTES TO CONDENSED CONSOLIDATED FINANCIAL STATEMENTS - (Continued)
(Unaudited)
No single customer accounted for 10% or greater of our accounts receivable or revenues for the three and six months ended June 30, 2021 and 2020. There is no country outside of the U.S. from which we derived revenues that exceeded 10% of our total revenues for the three and six months ended June 30, 2021 and 2020.
We define adjusted EBITDA as income from operations excluding depreciation, amortization, accretion, stock-based compensation expense, restructuring charges, impairment charges, transaction costs and gain or loss on asset sales as presented below (in thousands):
| | | | | | | | | | | | | | | | | | | | | | | |
| | Three Months Ended
June 30, | | Six Months Ended
June 30, |
| | 2021 | | 2020 | | 2021 | | 2020 |
| Adjusted EBITDA: | | | | | | | |
| Americas | $ | 325,924 | | | $ | 302,107 | | | $ | 670,416 | | | $ | 595,720 | |
| EMEA | 262,526 | | | 243,597 | | | 506,089 | | | 473,755 | |
| Asia-Pacific | 208,827 | | | 174,337 | | | 394,004 | | | 334,776 | |
| Total adjusted EBITDA | 797,277 | | | 720,041 | | | 1,570,509 | | | 1,404,251 | |
| Depreciation, amortization and accretion expense | (417,758) | | | (348,434) | | | (812,076) | | | (685,865) | |
| Stock-based compensation expense | (94,335) | | | (75,844) | | | (172,685) | | | (156,410) | |
| | | | | | | |
| Transaction costs | (6,985) | | | (13,617) | | | (8,167) | | | (25,147) | |
| Gain (loss) on asset sales | 455 | | | 342 | | | (1,265) | | | (857) | |
| Income from operations | $ | 278,654 | | | $ | 282,488 | | | $ | 576,316 | | | $ | 535,972 | |
We also provide the following additional segment disclosures (in thousands):
| | | | | | | | | | | | | | | | | | | | | | | |
| | Three Months Ended
June 30, | | Six Months Ended
June 30, |
| | 2021 | | 2020 | | 2021 | | 2020 |
| Depreciation and amortization: | | | | | | | |
| Americas | $ | 222,134 | | | $ | 180,934 | | | $ | 425,567 | | | $ | 352,008 | |
| EMEA | 115,162 | | | 93,012 | | | 225,941 | | | 185,386 | |
| Asia-Pacific | 78,945 | | | 74,647 | | | 159,750 | | | 147,068 | |
| Total | $ | 416,241 | | | $ | 348,593 | | | $ | 811,258 | | | $ | 684,462 | |
| Capital expenditures: | | | | | | | |
| Americas | $ | 250,342 | | | $ | 181,913 | | | $ | 455,516 | | | $ | 366,314 | |
| EMEA | 252,802 | | | 197,264 | | | 488,218 | | | 319,392 | |
| Asia-Pacific | 189,088 | | | 102,771 | | | 312,096 | | | 197,183 | |
| Total | $ | 692,232 | | | $ | 481,948 | | | $ | 1,255,830 | | | $ | 882,889 | |
Our long-lived assets, including property, plant and equipment, net and operating lease right-of-use assets, located in the following geographic areas as of (in thousands):
| | | | | | | | | | | |
| June 30,
2021 | | December 31,
2020 |
| Americas | $ | 6,703,341 | | | $ | 6,429,861 | |
| EMEA | 5,040,609 | | | 5,002,271 | |
| Asia-Pacific | 3,399,948 | | | 3,070,952 | |
| Total Property, plant and equipment, net | $ | 15,143,898 | | | $ | 14,503,084 | |
| | | |
| Americas | $ | 326,240 | | | $ | 363,515 | |
| EMEA | 502,244 | | | 547,547 | |
| Asia-Pacific | 543,310 | | | 563,995 | |
Total Operating lease right-of-use assets | $ | 1,371,794 | | | $ | 1,475,057 | |
EQUINIX, INC.
NOTES TO CONDENSED CONSOLIDATED FINANCIAL STATEMENTS - (Continued)
(Unaudited)
14. Subsequent Events
Declaration of dividends
On July 28, 2021, we declared a quarterly cash dividend of $2.87 per share, which is payable on September 22, 2021 to our common stockholders of record as of the close of business on August 18, 2021.
Close of DB5 Sale
On July 7, 2021, we completed the sale of our DB5 data center to the EMEA 1 Joint Venture for cash proceeds of approximately €41.8 million, or $49.4 million at the exchange rate in effect on that date. The assets and liabilities of the DB5 data center were classified as held for sale as of June 30, 2021 (see note 5 above).
| | | | | |
| Item 2. | Management's Discussion and Analysis of Financial Condition and Results of Operations |
The information in this discussion contains forward-looking statements within the meaning of Section 27A of the Securities Act of 1933, as amended, and Section 21E of the Securities Exchange Act of 1934, as amended. Such statements are based upon current expectations that involve risks and uncertainties. Any statements contained herein that are not statements of historical fact may be deemed to be forward-looking statements. For example, the words "believes," "anticipates," "plans," "expects," "intends" and similar expressions are intended to identify forward-looking statements. Our actual results and the timing of certain events may differ significantly from the results discussed in the forward-looking statements. Factors that might cause such a discrepancy include, but are not limited to, those discussed in "Liquidity and Capital Resources" below and "Risk Factors" in Item 1A of Part II of this Quarterly Report on Form 10-Q. All forward-looking statements in this document are based on information available to us as of the date of this Report and we assume no obligation to update any such forward-looking statements.
Our management's discussion and analysis of financial condition and results of operations is intended to assist readers in understanding our financial information from our management's perspective and is presented as follows:
•Overview
•Results of Operations
•Non-GAAP Financial Measures
•Liquidity and Capital Resources
•Contractual Obligations and Off-Balance-Sheet Arrangements
•Critical Accounting Policies and Estimates
•Recent Accounting Pronouncements
Overview
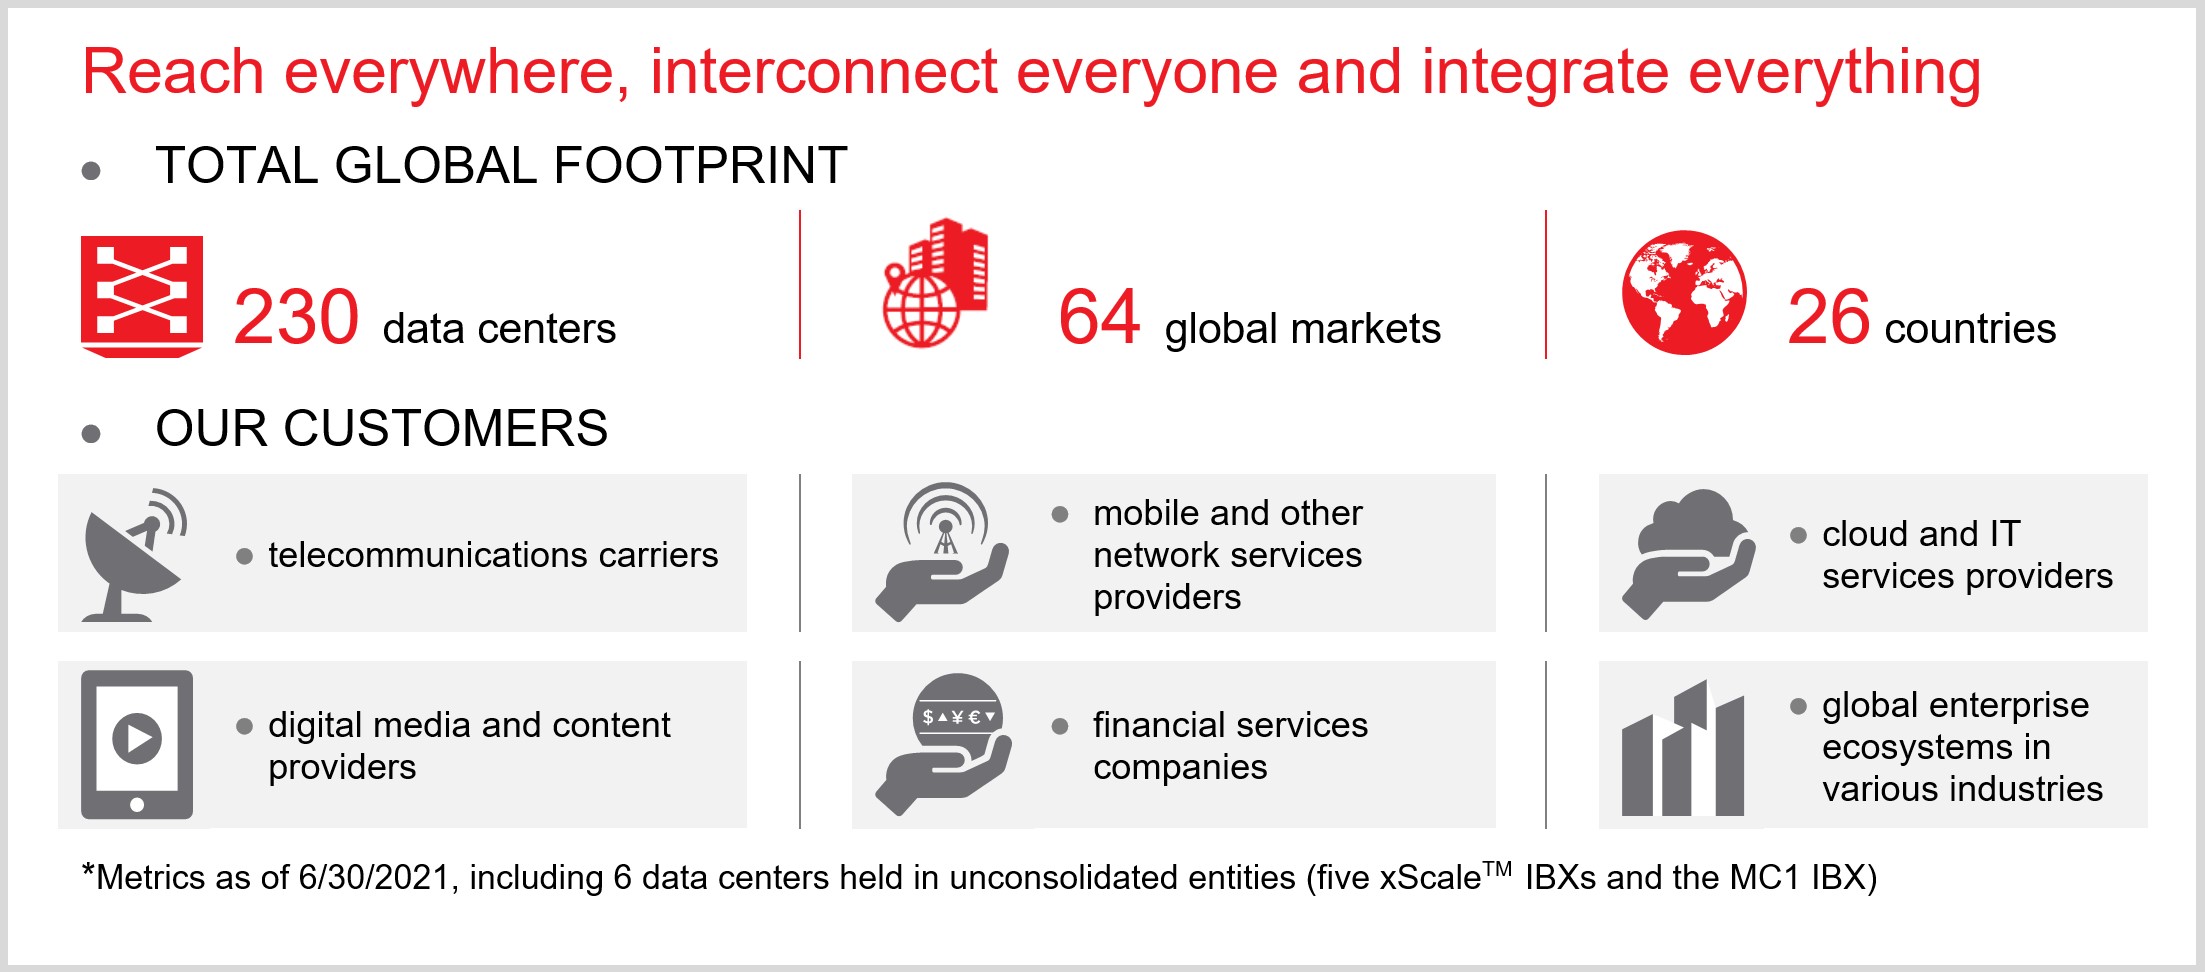
We provide a global, vendor-neutral data center, interconnection and edge services platform with offerings that aim to enable our customers to reach everywhere, interconnect everyone and integrate everything. Global enterprises, service providers and business ecosystems of industry partners rely on our IBX data centers and expertise around the world for the safe housing of their critical IT equipment and to protect and connect the world's most valued information assets. They also look to Platform Equinix® for the ability to directly and securely interconnect to the networks, clouds and content that enable today's information-driven global digital economy. Our recent IBX data center openings and acquisitions, as well as xScaleTM data center investments, have expanded our total global footprint to 230 IBXs, including five xScale data centers and the MC1 data center that are held in unconsolidated joint ventures, across 64 markets around the world. We offer the following solutions:
•premium data center colocation;
•interconnection and data exchange solutions;
•edge services for deploying networking, security and hardware; and
•remote expert support and professional services.
Our interconnected data centers around the world allow our customers to increase information and application delivery performance to users, and quickly access distributed IT infrastructures and business and digital ecosystems, while significantly reducing costs. Our global platform and the quality of our IBX data centers, interconnection offerings and edge services have enabled us to establish a critical mass of customers. As more customers choose Platform Equinix for bandwidth cost and performance reasons, it benefits their suppliers and business partners to colocate in the same data centers. This adjacency creates a “network effect” that enables our customers to capture the full economic and performance benefits of our offerings. These partners, in turn, pull in their business partners, creating a "marketplace" for their services. Our global platform enables scalable, reliable and cost-effective interconnection that increases data traffic exchange while lowering overall cost and increasing flexibility. Our focused business model is built on our critical mass of enterprise and service provider customers and the resulting "marketplace" effect. This global platform, combined with our strong financial position, has continued to drive new customer growth and bookings.
Historically, our market was served by large telecommunications carriers who bundled their products and services with their colocation offerings. The data center market landscape has evolved to include private and vendor-neutral multitenant data center ("MTDC") providers, hyperscale cloud providers, managed infrastructure and application hosting providers, and systems integrators. It is estimated that Equinix is one of more than 1,200 companies that provide MTDC offerings around the world. Each of these data center solutions providers can bundle various colocation, interconnection and network offerings and outsourced IT infrastructure solutions. We are able to offer our customers a global platform that reaches 26 countries with the industry’s largest and most active ecosystem of partners in our sites, proven operational reliability, improved application performance and a highly scalable set of offerings.
The cabinet utilization rate represents the percentage of cabinet space billed versus total cabinet capacity, which is used to measure how efficiently we are managing our cabinet capacity. Our cabinet utilization rate varies from market to market among our IBX data centers across our Americas, EMEA and Asia-Pacific regions. Our cabinet utilization rates were approximately 79% as of June 30, 2021 and 2020. Excluding the impact of our IBX data center expansion projects that have opened during the last 12 months, our cabinet utilization rate would have increased to approximately 81% as of June 30, 2021. We continue to monitor the available capacity in each of our selected markets. To the extent we have limited capacity available in a given market, it may limit our ability for growth in that market. We perform demand studies on an ongoing basis to determine if future expansion is warranted in a market. In addition, power and cooling requirements for most customers are growing on a per unit basis. As a result, customers are consuming an increasing amount of power per cabinet. Although we generally do not control the amount of power our customers draw from installed circuits, we have negotiated power consumption limitations with certain high power-demand customers. This increased power consumption has driven us to build out our new IBX data centers to support power and cooling needs twice that of previous IBX data centers. We could face power limitations in our IBX data centers, even though we may have additional physical cabinet capacity available within a specific IBX data center. This could have a negative impact on the available utilization capacity of a given IBX data center, which could have a negative impact on our ability to grow revenues, affecting our financial performance, results of operations and cash flows.
To serve the needs of the growing hyperscale data center market, including the world's largest cloud service providers, we have entered into joint ventures to develop and operate xScale data centers. In the past two years, we closed our EMEA 1 Joint Venture and Asia-Pacific Joint Venture in the form of limited liability partnerships with GIC, Singapore's sovereign wealth fund ("GIC"). In June 2021, we entered into an agreement to form our third joint venture with GIC to further expand the xScale data center portfolio in Europe and the Americas (the “EMEA 2 Joint Venture”).
Strategically, we will continue to look at attractive opportunities to grow our market share and selectively improve our footprint and offerings. As was the case with our recent expansions and acquisitions, our expansion criteria will be dependent on a number of factors, including but not limited to demand from new and existing customers, quality of the design, power capacity, access to networks, clouds and software partners, capacity availability in the current market location, amount of incremental investment required by us in the targeted property, automation capabilities, developer talent pool, lead-time to break even on a free cash flow basis and in-place customers. Like our recent expansions and acquisitions, the right combination of these factors may be attractive to us. Depending on the circumstances, these transactions may require additional capital expenditures funded by upfront cash payments or through long-term financing arrangements in order to bring these properties up to Equinix standards. Property expansion may be in the form of purchases of real property, long-term leasing arrangements or acquisitions. Future purchases, construction or acquisitions may be completed by us or with partners or potential customers to minimize the outlay of cash, which can be significant.
Revenue:
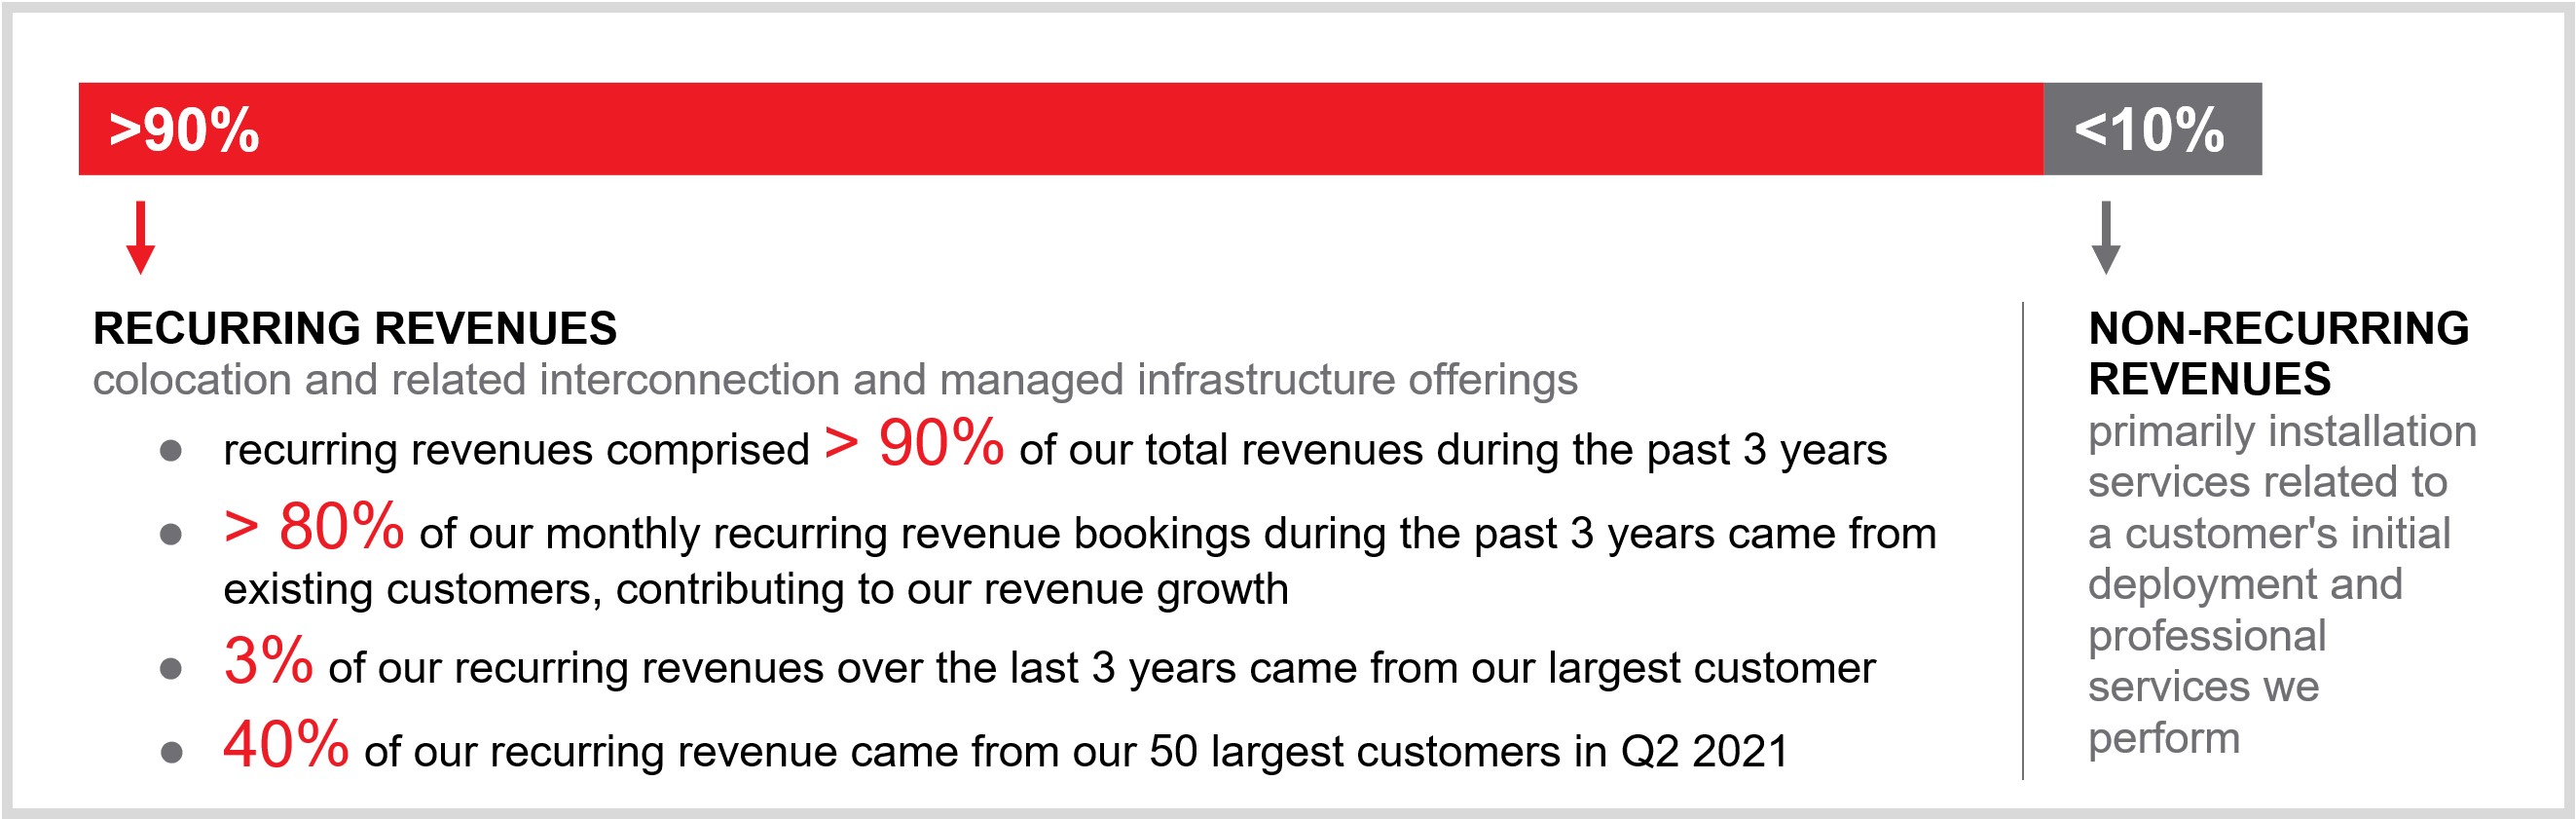
Our business is based on a recurring revenue model comprised of colocation and related interconnection and managed infrastructure offerings. We consider these offerings recurring because our customers are generally billed on a fixed and recurring basis each month for the duration of their contract, which is generally one to three years in length and thereafter, automatically renew in one-year increments. Our recurring revenues have comprised more than 90% of our total revenues during the past three years. In addition, during the past three years, more than 80% of our monthly recurring revenue bookings came from existing customers, contributing to our revenue growth. Our largest customer accounted for approximately 3% of our recurring revenues for both the three and six months ended June 30, 2021 and 2020. Our 50 largest customers accounted for approximately 40% of our recurring revenues for the three and six months ended June 30, 2021 and 39% of our recurring revenues for the three and six months ended June 30, 2020.
Our non-recurring revenues are primarily comprised of installation services related to a customer's initial deployment and professional services we perform. These services are considered to be non-recurring because they are billed typically once, upon completion of the installation or the professional services work performed. The majority of these non-recurring revenues are typically billed on the first invoice distributed to the customer in connection with their initial installation. However, revenues from installation services are deferred and recognized ratably over the period of the contract term. Additionally, revenue from contract settlements, when a customer wishes to terminate their contract early, is generally treated as a contract modification and recognized ratably over the remaining term of the contract, if any. As a percentage of total revenues, we expect non-recurring revenues to represent less than 10% of total revenues for the foreseeable future.
Operating Expenses:
Cost of Revenues. The largest components of our cost of revenues are depreciation, rental payments related to our leased IBX data centers, utility costs, including electricity, bandwidth access, IBX data center employees' salaries and benefits, including stock-based compensation, repairs and maintenance, supplies and equipment and security. A majority of our cost of revenues is fixed in nature and should not vary significantly from period to period, unless we expand our existing IBX data centers or open or acquire new IBX data centers. However, there are certain costs that are considered more variable in nature, including utilities and supplies that are directly related to growth in our existing and new customer base. We expect the cost of our utilities, specifically electricity, will generally increase in the future on a per-unit or fixed basis, in addition to the variable increase related to the growth in consumption by our customers. In addition, the cost of electricity is generally higher in the summer months, as compared to other times of the year. To the extent we incur increased utility costs, such increased costs could materially impact our financial condition, results of operations and cash flows. Furthermore, to the extent we incur increased electricity or other costs as a result of either climate change policies or the physical effects of climate change, such increased costs could materially impact our financial condition, results of operations and cash flows.
Sales and Marketing. Our sales and marketing expenses consist primarily of compensation and related costs for sales and marketing personnel, including stock-based compensation, amortization of contract costs, marketing programs, public relations, promotional materials and travel, as well as bad debt expense and amortization of customer relationship intangible assets.
General and Administrative. Our general and administrative expenses consist primarily of salaries and related expenses, including stock-based compensation, accounting, legal and other professional service fees, and other general corporate expenses, such as our corporate regional headquarters office leases and some depreciation expense on back office systems.
Taxation as a REIT
We elected to be taxed as a real estate investment trust for U.S. federal income tax purposes ("REIT") beginning with our 2015 taxable year. As of June 30, 2021, our REIT structure included all of our data center operations in the U.S., Canada (with the exception of two data centers), Mexico, Japan, Singapore and EMEA (with the exception of the data centers in Bulgaria, and the United Arab Emirates, and a data center in Ireland and in the Netherlands). Our data center operations in other jurisdictions are operated as taxable REIT subsidiaries ("TRSs"). We included our share of the assets in the EMEA and Asia-Pacific Joint Ventures in our REIT structure.
As a REIT, we generally are permitted to deduct from our U.S. federal taxable income the dividends we pay to our stockholders. The income represented by such dividends is not subject to U.S. federal income taxes at the entity level but is taxed, if at all, at the stockholder level. Nevertheless, the income of our TRSs which hold our U.S. operations that may not be REIT compliant is subject to U.S. federal and state corporate income taxes, as applicable. Likewise, our foreign subsidiaries continue to be subject to local income taxes in jurisdictions in which they hold assets or conduct operations, regardless of whether held or conducted through TRSs or through qualified REIT subsidiaries ("QRSs"). We are also subject to a separate U.S. federal corporate income tax on any gain recognized from a sale of a REIT asset where our basis in the asset is determined by reference to the basis of the asset in the hands of a C corporation (such as an asset held by us or a QRS following the liquidation or other conversion of a former TRS). This built-in-gains tax is generally applicable to any disposition of such an asset during the five-year period after the date we first owned the asset as a REIT asset to the extent of the built-in-gain based on the fair market value of such asset on the date we first held the asset as a REIT asset. If we fail to remain qualified for U.S. federal income taxation as a REIT, we will be subject to U.S. federal income taxes at regular corporate income tax rates. In addition, should we realize any gains from "prohibited transactions," we will be subject to tax on this gain at a 100% rate. "Prohibited transactions," for this purpose, are defined as dispositions, at a gain, of inventory or property held primarily for sale to customers in the ordinary course of a trade or business other than dispositions of foreclosure property and other than dispositions excepted by statutory safe harbors. Even if we remain qualified for U.S. federal income taxation as a REIT, we may be subject to some federal, state, local and foreign taxes on our income and property in addition to taxes owed with respect to our TRSs' operations. In particular, while state income tax regimes often parallel the U.S. federal income tax regime for REITs, many states do not completely follow federal rules, and some may not follow them at all.
We continue to monitor our REIT compliance in order to maintain our qualification for U.S. federal income taxation as a REIT. For this and other reasons, as necessary, we may convert some of our data center operations in other countries into the REIT structure in future periods.
On each of March 17, 2021 and June 16, 2021 we paid a quarterly cash dividend of $2.87 per share. On July 28, 2021, we declared a quarterly cash dividend of $2.87 per share, payable on September 22, 2021, to our common stockholders of record as of the close of business on August 18, 2021. We expect the amount of all of our 2021 quarterly distributions and other applicable distributions to equal or exceed our REIT taxable income to be recognized in 2021.
The Impact of the Ongoing COVID-19 Pandemic on Our Results and Operations
We have continued to closely monitor the impact of the COVID-19 pandemic on our people and business. We have announced a phased plan for return-to-office for non-IBX attached sites and have been following this plan to open certain offices with occupancy limits as local conditions allow. We continue to limit our employee travel and continue to either postpone or virtualize our global events.
For additional details regarding the impacts and risks to our results of operations from the ongoing COVID-19 pandemic, refer to “Results of Operations” section below and Part II, Item 1A. Risk Factors included elsewhere in this Quarterly Report on Form 10-Q. Please also refer to “The Impact of the Ongoing COVID-19 Pandemic on Our Results and Operations” included in Item 7. Management’s Discussion and Analysis of Financial Condition and Results of Operations in our 2020 Form 10-K as filed on February 19, 2021.
2021 Highlights:
•In March, we issued €1.1 billion in Senior Notes due 2027 and 2033, or approximately $1.3 billion in U.S. dollars, at the exchange rate in effect on March 10, 2021. Using a portion of the proceeds, we redeemed all of the remaining outstanding 2.875% Euro Senior Notes due 2026 for approximately $590.7 million in U.S. dollars, at the exchange rate in effect on March 24, 2021. See Note 10 within the Condensed Consolidated Financial Statements.
•In May, we issued $2.6 billion in Senior Notes due 2026, 2028, 2031 and 2052. Using a portion of the proceeds, we repaid approximately $659.9 million term loans and redeemed all of our outstanding $1.25 billion 5.375% Senior Notes due 2027. See Note 10 within the Condensed Consolidated Financial Statements.
•In May, we sold 137,604 shares under our 2020 "at-the-market" stock offering program (the "2020 ATM Program") for approximately $99.6 million in proceeds, net of payment of commissions to sales agents and other offering expenses. See Note 12 within the Condensed Consolidated Financial Statements.
•In June, we entered into an agreement to form our third joint venture in the form of a limited liability partnership with GIC, to develop and operate additional xScale data centers in Europe and the Americas. Upon closing, GIC will contribute cash in exchange for an 80% partnership interest, and we will sell to the EMEA 2 Joint Venture certain data center sites and facilities located in Europe and the Americas, in exchange for a 20% partnership interest and cash proceeds. The transaction is expected to close in phases over the course of two years, pending regulatory approval and other closing conditions. The assets and liabilities of the data center sites that are expected to be sold within a year were classified as held for sale as of June 30, 2021. See Note 5 within the Condensed Consolidated Financial Statements.
Results of Operations
Our results of operations for the three and six months ended June 30, 2021 include the results of operations from 12 data center sites acquired from Bell across Canada from October 1, 2020 and one additional data center acquired from Bell from November 2, 2020. Our results of operations for the three and six months ended June 30, 2020 include the results of operations from Packet acquired from March 2, 2020 and three data centers in Mexico acquired from Axtel from January 8, 2020.
In order to provide a framework for assessing our performance excluding the impact of foreign currency fluctuations, we supplement the year-over-year actual change in results of operations with comparative changes on a constant currency basis. Presenting constant currency results of operations is a non-GAAP financial measure. See “Non-GAAP Financial Measures” below for further discussion.
Three Months Ended June 30, 2021 and 2020
Revenues. Our revenues for the three months ended June 30, 2021 and 2020 were generated from the following revenue classifications and geographic regions (dollars in thousands):
| | | | | | | | | | | | | | | | | | | | | | | | | | | | | | | | | | | |
| | Three Months Ended June 30, | | % Change |
| | 2021 | | % | | 2020 | | % | | Actual | | Constant
Currency |
| Americas: | | | | | | | | | | | |
| Recurring revenues | $ | 706,462 | | | 43 | % | | $ | 634,855 | | | 43 | % | | 11 | % | | 10 | % |
| Non-recurring revenues | 44,181 | | | 3 | % | | 26,564 | | | 2 | % | | 66 | % | | 65 | % |
| 750,643 | | | 46 | % | | 661,419 | | | 45 | % | | 13 | % | | 13 | % |
| EMEA: | | | | | | | | | | | |
| Recurring revenues | 498,819 | | | 30 | % | | 467,190 | | | 32 | % | | 7 | % | | 5 | % |
| Non-recurring revenues | 39,110 | | | 2 | % | | 20,900 | | | 1 | % | | 87 | % | | 71 | % |
| 537,929 | | | 32 | % | | 488,090 | | | 33 | % | | 10 | % | | 8 | % |
| Asia-Pacific: | | | | | | | | | | | |
| Recurring revenues | 337,181 | | | 20 | % | | 296,093 | | | 20 | % | | 14 | % | | 9 | % |
| Non-recurring revenues | 32,166 | | | 2 | % | | 24,519 | | | 2 | % | | 31 | % | | 28 | % |
| 369,347 | | | 22 | % | | 320,612 | | | 22 | % | | 15 | % | | 10 | % |
| Total: | | | | | | | | | | | |
| Recurring revenues | 1,542,462 | | | 93 | % | | 1,398,138 | | | 95 | % | | 10 | % | | 8 | % |
| Non-recurring revenues | 115,457 | | | 7 | % | | 71,983 | | | 5 | % | | 60 | % | | 54 | % |
| $ | 1,657,919 | | | 100 | % | | $ | 1,470,121 | | | 100 | % | | 13 | % | | 10 | % |
Revenues
(dollars in thousands)
Americas Revenues. During the three months ended June 30, 2021, Americas revenue increased by 13% (and also 13% on a constant currency basis). Growth in Americas revenues was primarily due to:
•approximately $35.5 million of incremental revenues from the Bell acquisition;
•$23.4 million of incremental revenues generated from our IBX data center expansions;
•higher non-recurring revenues, primarily due to increases in Equinix Infrastructure Service ("EIS") product sales; and
•an increase in orders from both our existing customers and new customers during the period.
EMEA Revenues. During the three months ended June 30, 2021, EMEA revenue increased by 10% (8% on a constant currency basis). Growth in EMEA revenues was primarily due to:
•approximately $19.0 million of incremental revenues generated from our IBX data center expansions;
•higher non-recurring revenues, primarily due to increases in EIS product sales and incremental revenues from services provided to the EMEA 1 Joint Venture; and
•an increase in orders from both our existing customers and new customers during the period.
The increase was partially offset by a net decrease of $36.7 million realized cash flow hedge gains from foreign currency forward contracts.
Asia-Pacific Revenues. During the three months ended June 30, 2021, Asia-Pacific revenue increased by 15% (10% on a constant currency basis). Growth in Asia-Pacific revenue was primarily due to:
•approximately $7.2 million of incremental revenues generated from our IBX data center expansions;
•$12.2 million incremental revenues from services provided to the Asia-Pacific Joint Venture; and
•an increase in orders from both our existing customers and new customers during the period.
Cost of Revenues. Our cost of revenues for the three months ended June 30, 2021 and 2020 by geographic regions was as follows (dollars in thousands):
| | | | | | | | | | | | | | | | | | | | | | | | | | | | | | | | | | | |
| | Three Months Ended June 30, | | % Change |
| | 2021 | | % | | 2020 | | % | | Actual | | Constant
Currency |
| Americas | $ | 376,962 | | | 44 | % | | $ | 302,874 | | | 41 | % | | 24 | % | | 22 | % |
| EMEA | 299,739 | | | 35 | % | | 258,552 | | | 35 | % | | 16 | % | | 11 | % |
| Asia-Pacific | 188,419 | | | 21 | % | | 177,918 | | | 24 | % | | 6 | % | | 2 | % |
| Total | $ | 865,120 | | | 100 | % | | $ | 739,344 | | | 100 | % | | 17 | % | | 14 | % |
Cost of Revenues
(dollars in thousands; percentages indicate expenses as a percentage of revenues)
Americas Cost of Revenues. During the three months ended June 30, 2021, Americas cost of revenues increased by 24% (22% on a constant currency basis). The increase in our Americas cost of revenues was primarily due to:
•approximately $38.0 million of incremental cost of revenues from the Bell acquisition;
•$10.7 million of higher depreciation driven by IBX data center expansions; and
•$7.8 million of higher costs related to increased EIS product revenues.
EMEA Cost of Revenues. During the three months ended June 30, 2021, EMEA cost of revenues increased by 16% (11% on a constant currency basis). The increase in our EMEA cost of revenues was primarily due to:
•$19.7 million of higher depreciation expenses driven by IBX data center expansions in the Netherlands, Germany, the United Kingdom ("UK") and Switzerland;
•$12.8 million of higher utilities costs, primarily driven by increases in prices and higher utility usage in the UK, France and Germany;
•$8.2 million of higher rent and facilities costs and repairs and maintenance expense, primarily in the UK;
•$8.3 million of higher costs related to increased EIS product revenues; and
•$8.0 million of higher compensation costs, including salaries, bonuses and stock-based compensation, primarily due to headcount growth.
This increase was partially offset by $14.2 million realized cash flow hedge gains from foreign currency forward contracts.
Asia-Pacific Cost of Revenues. During the three months ended June 30, 2021, Asia-Pacific cost of revenues increased by 6% (2% on a constant currency basis). The increase in our Asia-Pacific cost of revenues was primarily due to:
•$4.0 million of higher depreciation expense, primarily from IBX data center expansions in Australia and Hong Kong; and
•$3.5 million of higher compensation costs, including salaries, bonuses and stock-based compensation, primarily due to headcount growth.
We expect cost of revenues to increase across all three regions in line with the growth of our business, including from the impact of acquisitions.
Sales and Marketing Expenses. Our sales and marketing expenses for the three months ended June 30, 2021 and 2020 by geographic regions were as follows (dollars in thousands):
| | | | | | | | | | | | | | | | | | | | | | | | | | | | | | | | | | | |
| | Three Months Ended June 30, | | % Change |
| | 2021 | | % | | 2020 | | % | | Actual | | Constant
Currency |
| Americas | $ | 115,558 | | | 62 | % | | $ | 110,788 | | | 62 | % | | 4 | % | | 4 | % |
| EMEA | 46,320 | | | 25 | % | | 41,686 | | | 24 | % | | 11 | % | | 7 | % |
| Asia-Pacific | 23,732 | | | 13 | % | | 25,650 | | | 14 | % | | (7) | % | | (12) | % |
| Total | $ | 185,610 | | | 100 | % | | $ | 178,124 | | | 100 | % | | 4 | % | | 2 | % |
Sales and Marketing Expenses
(dollars in thousands; percentages indicate expenses as a percentage of revenues)
Americas Sales and Marketing Expenses. During the three months ended June 30, 2021, Americas sales and marketing expenses increased by 4% (and also 4% on a constant currency basis) primarily due to higher compensation costs, including sales compensation, salaries and stock-based compensation, resulting from our headcount growth and recent acquisitions.
EMEA Sales and Marketing Expenses. During the three months ended June 30, 2021, EMEA sales and marketing expenses increased by 11% (7% on a constant currency basis). The increase in our EMEA sales and marketing expenses was primarily due to $5.5 million of higher compensation costs, including salaries, bonuses and stock-based compensation, primarily due to headcount growth.
This increase was partially offset by realized cash flow hedge gains from foreign currency forward contracts.
Asia-Pacific Sales and Marketing Expenses. Our Asia-Pacific sales and marketing expense did not materially change during the three months ended June 30, 2021 as compared to the three months ended June 30, 2020.
We anticipate that we will continue to invest in sales and marketing initiatives across our three regions in line with the growth of our business. We also expect travel and entertainment expenses to increase as travel restrictions that were imposed in response to the COVID-19 pandemic are eased. We expect our Americas sales and marketing expenses as a percentage of revenues to be higher than those of our other regions since certain global sales and marketing functions are located within the U.S.
General and Administrative Expenses. Our general and administrative expenses for the three months ended June 30, 2021 and 2020 by geographic regions were as follows (dollars in thousands):
| | | | | | | | | | | | | | | | | | | | | | | | | | | | | | | | | | | |
| | Three Months Ended June 30, | | % Change |
| | 2021 | | % | | 2020 | | % | | Actual | | Constant
Currency |
| Americas | $ | 224,594 | | | 70 | % | | $ | 184,180 | | | 72 | % | | 22 | % | | 22 | % |
| EMEA | 60,160 | | | 19 | % | | 49,448 | | | 19 | % | | 22 | % | | 17 | % |
| Asia-Pacific | 37,251 | | | 11 | % | | 23,262 | | | 9 | % | | 60 | % | | 52 | % |
| Total | $ | 322,005 | | | 100 | % | | $ | 256,890 | | | 100 | % | | 25 | % | | 24 | % |
General and Administrative Expenses
(dollars in thousands; percentages indicate expenses as a percentage of revenues)
Americas General and Administrative Expenses. During the three months ended June 30, 2021, Americas general and administrative expenses increased by 22% (and also 22% on a constant currency basis). The increase in our Americas general and administrative expenses was primarily due to:
•$22.8 million of higher compensation costs, including salaries, bonuses and stock-based compensation, primarily due to additional compensation expenses incurred related to headcount growth including that from our recent acquisitions;
•$8.1 million of higher depreciation expense associated with systems to support the integration of recent acquisitions and the growth of our business; and
•$5.9 million of higher office expenses due to additional software and support services.
EMEA General and Administrative Expenses. During the three months ended June 30, 2021, EMEA general and administrative expenses increased by 22% (17% on a constant currency basis). The increase in our EMEA general and administrative expenses was primarily due to $11.6 million of higher compensation costs, including salaries, bonuses and stock-based compensation, primarily due to headcount growth.
This increase was partially offset by realized cash flow hedge gains from foreign currency forward contracts.
Asia-Pacific General and Administrative Expenses. During the three months ended June 30, 2021, Asia-Pacific general and administrative expenses increased by 60% (52% on a constant currency basis). The increase in our Asia-Pacific general and administrative expenses was primarily due to:
•$7.9 million of higher compensation costs, including salaries, bonuses and stock-based compensation, primarily due to headcount growth; and
•higher overall general and administrative expenses to support our business, including higher rent and facility costs for our offices in Singapore and Hong Kong.
Going forward, although we are carefully monitoring our spending, we expect our general and administrative expenses to increase across all three regions as we continue to invest in our operations to support our growth, including investments to enhance our technology platform, to maintain our qualification for taxation as a REIT and to integrate recent acquisitions. We also expect travel and entertainment expenses to increase as travel restrictions that were imposed in response to the COVID-19 pandemic are eased. Additionally, since our corporate headquarters is located in the U.S., we expect the Americas general and administrative expenses as a percentage of revenues to continue to be higher than other regions.
Transaction Costs. During the three months ended June 30, 2021, we recorded transaction costs of $7.0 million, primarily related to costs incurred in connection with the formation of the EMEA 2 Joint Venture. During the three months ended June 30, 2020, we recorded transaction costs of $13.6 million, primarily related to costs incurred in connection with the formation of the Asia-Pacific Joint Venture.
Gain or Loss on Asset Sales. During the three months ended June 30, 2021 and 2020, we did not record a significant amount of gain on asset sales.
Income from Operations. Our income from operations for the three months ended June 30, 2021 and 2020 by geographic regions was as follows (dollars in thousands):
| | | | | | | | | | | | | | | | | | | | | | | | | | | | | | | | | | | |
| | Three Months Ended June 30, | | % Change |
| | 2021 | | % | | 2020 | | % | | Actual | | Constant
Currency |
| Americas | $ | 27,745 | | | 10 | % | | $ | 58,423 | | | 21 | % | | (53) | % | | (50) | % |
| EMEA | 131,158 | | | 47 | % | | 138,154 | | | 49 | % | | (5) | % | | (3) | % |
| Asia-Pacific | 119,751 | | | 43 | % | | 85,911 | | | 30 | % | | 39 | % | | 33 | % |
| Total | $ | 278,654 | | | 100 | % | | $ | 282,488 | | | 100 | % | | (1) | % | | (2) | % |
Americas Income from Operations. During the three months ended June 30, 2021, Americas income from operations decreased by 53% (50% on a constant currency basis), primarily due to higher operating expenses as a percentage of revenues, including higher depreciation expenses, and an increase in general and administrative expenses primarily driven by higher compensation costs, as well as unfavorable impact from the recent acquisitions and margin dilution from increases in EIS product sales.
EMEA Income from Operations. During the three months ended June 30, 2021, EMEA income from operations decreased by 5% (3% on a constant currency basis), primarily due to higher operating expenses as a percentage of revenues, which included higher depreciation expenses driven by expansion activity and an increase in cost of revenues and general and administrative expenses primarily driven by higher compensation costs.
Asia-Pacific Income from Operations. During the three months ended June 30, 2021, Asia-Pacific income from operations increased by 39% (33% on a constant currency basis), primarily due to higher revenues as a result of our IBX data center expansion activity and organic growth, as described above, as well as lower cost of revenues as a percentage of revenues.
Interest Income. During the three months ended June 30, 2021 and 2020, we did not record a significant amount of interest income.
Interest Expense. Interest expense decreased to $87.2 million for the three months ended June 30, 2021 from $108.5 million for the three months ended June 30, 2020, primarily due to interest savings as a result of our recent refinancing activities. During the three months ended June 30, 2021 and 2020, we capitalized $6.7 million and $6.9 million, respectively, of interest expense to construction in progress. See Note 10 within the Condensed Consolidated Financial Statements.
Other Income (Expense). We recorded net other expense of $39.4 million for the three months ended June 30, 2021, primarily due to a $33.6 million impairment charge resulting from the settlement of a pre-acquisition uncertain tax position, as well as foreign currency exchange gains and losses. For the three months ended June 30, 2020, we recorded net other income of $4.3 million, which was primarily due to foreign currency exchange gains and losses, net of the impact from derivative instruments used to manage foreign exchange risks.
Loss on Debt Extinguishment. We recorded a loss on debt extinguishment of $102.5 million during the three months ended June 30, 2021, primarily due to the redemption of the 5.375% Senior Notes due 2027. We did not record a significant amount of loss on debt extinguishment during the three months ended June 30, 2020.
Income Taxes. We operate as a REIT for U.S. federal income tax purposes. As a REIT, we are generally not subject to U.S. federal income taxes on our taxable income distributed to stockholders. We intend to distribute or have distributed the entire taxable income generated by the operations of our REIT and QRSs for the tax years ending December 31, 2021 and 2020, respectively. As such, other than tax on built-in-gains recognized, state income taxes, and foreign income and withholding taxes, as applicable, no provision for income taxes has been included for our REIT and QRSs in the accompanying condensed consolidated financial statements for the three months ended June 30, 2021 and 2020.
We have made TRS elections for some of our subsidiaries in and outside the U.S. In general, a TRS may provide services that would otherwise be considered impermissible for REITs to provide and may hold assets that may not be REIT compliant.
U.S. income taxes for the TRS entities located in the U.S. and foreign income taxes for our foreign operations regardless of whether the foreign operations are operated as QRSs or TRSs have been accrued, as necessary, for the three months ended June 30, 2021 and 2020.
For the three months ended June 30, 2021 and 2020, we recorded $18.5 million of income tax benefit and $44.8 million of income tax expense, respectively. Our effective tax rates were (37.1)% and 25.1% for the three months ended June 30, 2021 and 2020, respectively. The decrease in the effective tax rate for the three months ended June 30, 2021 as compared to the same period in 2020 is primarily due to the favorable resolution of uncertain tax positions of approximately $71.0 million resulting from the settlement of various tax audits in the UK, Germany, and Australia, partially offset by $11.0 million resulting from the revaluation of our deferred tax liabilities due to the UK corporate tax rate increase from 19% to 25% enacted in the current period.
Of the unrecognized tax benefits being realized in the current period, $33.6 million is related to the uncertain tax position inherited from the Metronode Acquisition. The uncertain tax position was covered by an indemnification agreement with the Seller. The realization of the unrecognized tax benefits resulted in an impairment of the indemnification asset for the same amount, which has been included in Other Income (Expense) on the Condensed Consolidated Statements of Operations.
Adjusted EBITDA. Adjusted EBITDA is a key factor in how we assess the operating performance of our segments and develop regional growth strategies such as IBX data center expansion decisions. We define adjusted EBITDA as income or loss from operations excluding depreciation, amortization, accretion, stock-based compensation expense, restructuring charges, impairment charges, transaction costs and gain or loss on asset sales. See "Non-GAAP Financial Measures" below for more information about adjusted EBITDA and a reconciliation of adjusted EBITDA to income or loss from operations. Our adjusted EBITDA for the three months ended June 30, 2021 and 2020 by geographic regions was as follows (dollars in thousands):
| | | | | | | | | | | | | | | | | | | | | | | | | | | | | | | | | | | |
| | Three Months Ended June 30, | | % Change |
| | 2021 | | % | | 2020 | | % | | Actual | | Constant
Currency |
| Americas | $ | 325,924 | | | 41 | % | | $ | 302,107 | | | 42 | % | | 8 | % | | 7 | % |
| EMEA | 262,526 | | | 33 | % | | 243,597 | | | 34 | % | | 8 | % | | 4 | % |
| Asia-Pacific | 208,827 | | | 26 | % | | 174,337 | | | 24 | % | | 20 | % | | 15 | % |
| Total | $ | 797,277 | | | 100 | % | | $ | 720,041 | | | 100 | % | | 11 | % | | 8 | % |
Americas Adjusted EBITDA. During the three months ended June 30, 2021, Americas adjusted EBITDA increased by 8% (7% on a constant currency basis). The increase in our Americas adjusted EBITDA was primarily due to higher revenues as a result of our IBX data center expansion activity and organic growth as described above.
EMEA Adjusted EBITDA. During the three months ended June 30, 2021, EMEA adjusted EBITDA increased by 8% (4% on a constant currency basis). The increase in our EMEA adjusted EBITDA was primarily due to higher revenues as a result of our IBX data center expansion activity and organic growth as described above.
Asia-Pacific Adjusted EBITDA. During the three months ended June 30, 2021, Asia-Pacific adjusted EBITDA increased by 20% (15% on a constant currency basis). The increase in our Asia-Pacific adjusted EBITDA was primarily due to higher revenues as a result of our IBX data center expansion activity and organic growth as described above, as well as lower cost of revenues and sales and marketing expenses as a percentage of revenues.
Six Months Ended June 30, 2021 and 2020
Revenues. Our revenues for the six months ended June 30, 2021 and 2020 were generated from the following revenue classifications and geographic regions (dollars in thousands):
| | | | | | | | | | | | | | | | | | | | | | | | | | | | | | | | | | | |
| | Six Months Ended June 30, | | % Change |
| | 2021 | | % | | 2020 | | % | | Actual | | Constant Currency (1) |
| Americas: | | | | | | | | | | | |
| Recurring revenues | $ | 1,399,331 | | | 43 | % | | $ | 1,267,487 | | | 43 | % | | 10 | % | | 11 | % |
| Non-recurring revenues | 77,252 | | | 2 | % | | 55,837 | | | 3 | % | | 38 | % | | 38 | % |
| 1,476,583 | | | 45 | % | | 1,323,324 | | | 46 | % | | 12 | % | | 12 | % |
| EMEA: | | | | | | | | | | | |
| Recurring revenues | 985,901 | | | 30 | % | | 910,664 | | | 31 | % | | 8 | % | | 7 | % |
| Non-recurring revenues | 70,745 | | | 2 | % | | 56,335 | | | 2 | % | | 26 | % | | 15 | % |
| 1,056,646 | | | 32 | % | | 966,999 | | | 33 | % | | 9 | % | | 7 | % |
| Asia-Pacific: | | | | | | | | | | | |
| Recurring revenues | 668,163 | | | 21 | % | | 581,681 | | | 20 | % | | 15 | % | | 9 | % |
| Non-recurring revenues | 52,591 | | | 2 | % | | 42,659 | | | 1 | % | | 23 | % | | 19 | % |
| 720,754 | | | 23 | % | | 624,340 | | | 21 | % | | 15 | % | | 10 | % |
| Total: | | | | | | | | | | | |
| Recurring revenues | 3,053,395 | | | 94 | % | | 2,759,832 | | | 94 | % | | 11 | % | | 9 | % |
| Non-recurring revenues | 200,588 | | | 6 | % | | 154,831 | | | 6 | % | | 30 | % | | 25 | % |
| $ | 3,253,983 | | | 100 | % | | $ | 2,914,663 | | | 100 | % | | 12 | % | | 10 | % |
(1)As defined in the "Non-GAAP Financial Measures" section in Item 2 of this Quarterly Report on Form 10-Q.
Revenues
(dollars in thousands)
Americas Revenues. During the six months ended June 30, 2021, Americas revenue increased by 12% (and also 12% on a constant currency basis). Growth in Americas revenues was primarily due to:
•approximately $74.9 million of incremental revenues from the Packet and Bell acquisitions;
•$28.2 million of incremental revenues generated from our IBX data center expansions;
•higher non-recurring revenues, primarily due to increases in EIS product sales; and
•an increase in orders from both our existing customers and new customers during the period.
EMEA Revenues. During the six months ended June 30, 2021, EMEA revenue increased by 9% (7% on a constant currency basis). Growth in EMEA revenues was primarily due to:
•approximately $33.8 million of incremental revenues generated from our IBX data center expansions;
•higher non-recurring revenues, primarily due to increases in EIS product sales and incremental revenues from services provided to the EMEA 1 Joint Venture; and
•an increase in orders from both our existing customers and new customers during the period.
The increase was partially offset by a net decrease of $70.5 million of realized cash flow hedge gains from foreign currency forward contracts.
Asia-Pacific Revenues. During the six months ended June 30, 2021, Asia-Pacific revenue increased by 15% (10% on a constant currency basis). Growth in Asia-Pacific revenue was primarily due to:
•$14.4 million incremental revenues from services provided to the Asia-Pacific Joint Venture;
•approximately $12.2 million of incremental revenues generated from our IBX data center expansions; and
•an increase in orders from both our existing customers and new customers during the period.
Cost of Revenues. Our cost of revenues for the six months ended June 30, 2021 and 2020 by geographic regions was as follows (dollars in thousands):
| | | | | | | | | | | | | | | | | | | | | | | | | | | | | | | | | | | |
| | Six Months Ended June 30, | | % Change |
| | 2021 | | % | | 2020 | | % | | Actual | | Constant
Currency |
| Americas | $ | 696,904 | | | 42 | % | | $ | 597,986 | | | 41 | % | | 17 | % | | 16 | % |
| EMEA | 596,832 | | | 36 | % | | 526,214 | | | 36 | % | | 13 | % | | 9 | % |
| Asia-Pacific | 382,601 | | | 22 | % | | 351,426 | | | 23 | % | | 9 | % | | 4 | % |
| Total | $ | 1,676,337 | | | 100 | % | | $ | 1,475,626 | | | 100 | % | | 14 | % | | 11 | % |
Cost of Revenues
(dollars in thousands; percentages indicate expenses as a percentage of revenues)
Americas Cost of Revenues. During the six months ended June 30, 2021, Americas cost of revenues increased by 17% (16% on a constant currency basis). The increase in our Americas cost of revenues was primarily due to:
•approximately $81.2 million of incremental cost of revenues from the Packet and Bell acquisitions;
•$11.7 million of higher of higher costs related to increased EIS product revenues;
•$7.4 million of higher depreciation driven by IBX data center expansions; and
•$5.4 million of higher other cost of sales related to an increase in bandwidth for new vendors and an increase in equipment in the quarter.
This increase was partially offset by $13.4 million of lower utilities, primarily due to gains from wind farm settlements in Texas and Oklahoma during a period of unexpected weather conditions.
EMEA Cost of Revenues. During the six months ended June 30, 2021, EMEA cost of revenues increased by 13% (9% on a constant currency basis). The increase in our EMEA cost of revenues was primarily due to:
•$35.3 million of higher depreciation expenses driven by IBX data center expansions in the Netherlands, Germany, and Switzerland;
•$22.1 million of higher utilities costs driven by increased utility usage to support IBX data center expansions and utility price increases, primarily in Germany, France, and the UK;
•$13.1 million of higher rent and facilities costs and repairs and maintenance expense in the UK, the Netherlands and France;
•$13.1 million of higher costs related to increased EIS product revenues; and
•$12.4 million of higher compensation costs, including salaries, bonuses and stock-based compensation, primarily due to headcount growth.
This increase was partially offset by $27.7 million of realized cash flow hedge gains from foreign currency forward contracts and $5.2 million decrease of other third party cost of sales primarily in the Netherlands and the UK.
Asia-Pacific Cost of Revenues. During the six months ended June 30, 2021, Asia-Pacific cost of revenues increased by 9% (4% on a constant currency basis). The increase in our Asia-Pacific cost of revenues was primarily due to:
•$11.8 million of higher depreciation expense, primarily from IBX data center expansions in Australia and Hong Kong;
•$8.4 million of higher costs incurred to support the growth in EIS revenues, primarily in Japan; and
•$4.4 million of higher compensation costs, including salaries, bonuses and stock-based compensation, primarily due to headcount growth.
We expect cost of revenues to increase across all three regions in line with the growth of our business, including from the impact of acquisitions.
Sales and Marketing Expenses. Our sales and marketing expenses for the six months ended June 30, 2021 and 2020 by geographic regions were as follows (dollars in thousands):
| | | | | | | | | | | | | | | | | | | | | | | | | | | | | | | | | | | |
| | Six Months Ended June 30, | | % Change |
| | 2021 | | % | | 2020 | | % | | Actual | | Constant
Currency |
| Americas | $ | 231,837 | | | 63 | % | | $ | 224,070 | | | 62 | % | | 3 | % | | 3 | % |
| EMEA | 88,743 | | | 24 | % | | 84,661 | | | 24 | % | | 5 | % | | 2 | % |
| Asia-Pacific | 47,857 | | | 13 | % | | 49,843 | | | 14 | % | | (4) | % | | (9) | % |
| Total | $ | 368,437 | | | 100 | % | | $ | 358,574 | | | 100 | % | | 3 | % | | 1 | % |
Sales and Marketing Expenses
(dollars in thousands; percentages indicate expenses as a percentage of revenues)
Americas Sales and Marketing Expenses. During the six months ended June 30, 2021, Americas sales and marketing expenses increased by 3% (and also 3% on a constant currency basis). The increase in our Americas sales and marketing expenses was primarily due to $9.0 million of higher compensation costs, including sales compensation, salaries and stock-based compensation, partially due to additional compensation expenses incurred related to our recent acquisitions and headcount growth.
This increase was partially offset by lower travel and entertainment expenses resulting from travel restrictions imposed in response to the ongoing COVID-19 pandemic.
EMEA Sales and Marketing Expenses. During the six months ended June 30, 2021, EMEA sales and marketing expenses increased by 5% (2% on a constant currency basis). The increase in our EMEA sales and marketing expenses was primarily due to $8.5 million of higher compensation costs, including salaries, bonuses and stock-based compensation, primarily due to headcount growth.
This increase was partially offset by realized cash flow hedge gains from foreign currency forward contracts.
Asia-Pacific Sales and Marketing Expenses. Our Asia-Pacific sales and marketing expense did not materially change during the six months ended June 30, 2021 as compared to the six months ended June 30, 2020.
We anticipate that we will continue to invest in sales and marketing initiatives across our three regions in line with the growth of our business. We also expect travel and entertainment expenses to increase as travel restrictions that were imposed in response to the COVID-19 pandemic are eased. We expect our Americas sales and marketing expenses as a percentage of revenues to be higher than those of our other regions since certain global sales and marketing functions are located within the U.S.
General and Administrative Expenses. Our general and administrative expenses for the six months ended June 30, 2021 and 2020 by geographic regions were as follows (dollars in thousands):
| | | | | | | | | | | | | | | | | | | | | | | | | | | | | | | | | | | |
| | Six Months Ended June 30, | | % Change |
| | 2021 | | % | | 2020 | | % | | Actual | | Constant
Currency |
| Americas | $ | 430,789 | | | 69 | % | | $ | 378,206 | | | 73 | % | | 14 | % | | 14 | % |
| EMEA | 119,141 | | | 19 | % | | 91,304 | | | 18 | % | | 30 | % | | 28 | % |
| Asia-Pacific | 73,531 | | | 12 | % | | 48,977 | | | 9 | % | | 50 | % | | 43 | % |
| Total | $ | 623,461 | | | 100 | % | | $ | 518,487 | | | 100 | % | | 20 | % | | 19 | % |
General and Administrative Expenses
(dollars in thousands; percentages indicate expenses as a percentage of revenues)
Americas General and Administrative Expenses. During the six months ended June 30, 2021, Americas general and administrative expenses increased by 14% (and also 14% on a constant currency basis). The increase in our Americas general and administrative expenses was primarily due to:
•$27.8 million of higher compensation costs, including salaries, bonuses and stock-based compensation, primarily due to additional compensation expenses incurred related to headcount growth including that from our recent acquisitions;
•$16.7 million of higher depreciation expense associated with systems to support the integration of recent acquisitions and the growth of our business; and
•$8.6 million of higher office expenses due to additional software and support services.
This increase was partially offset by lower travel and entertainment expenses resulting from travel restrictions imposed in response to the ongoing COVID-19 pandemic.
EMEA General and Administrative Expenses. During the six months ended June 30, 2021, EMEA general and administrative expenses increased by 30% (28% on a constant currency basis). The increase in our EMEA general and administrative expenses was primarily due to:
•$23.2 million of higher compensation costs, including salaries, bonuses and stock-based compensation, primarily due to headcount growth; and
•$5.9 million of higher other operating expenses, primarily due to the prior year having lower costs attributable to a favorable legal settlement in the first quarter of 2020.
This increase was partially offset by $5.3 million of realized cash flow hedge gains from foreign currency forward contracts.
Asia-Pacific General and Administrative Expenses. During the six months ended June 30, 2021, Asia-Pacific general and administrative expenses increased by 50% (43% on a constant currency basis). The increase in our Asia-Pacific general and administrative expense was primarily due to:
•$13.4 million of higher compensation costs, including salaries, bonuses and stock-based compensation, primarily due to headcount growth; and
•$7.1 million higher rent and facility costs, primarily in Singapore.
Going forward, although we are carefully monitoring our spending, we expect our general and administrative expenses to increase across all three regions as we continue to invest in our operations to support our growth, including investments to enhance our technology platform, to maintain our qualification for taxation as a REIT and to integrate recent acquisitions. We also expect travel and entertainment expenses to increase as travel restrictions that were imposed in response to the COVID-19 pandemic are eased. Additionally, given that our corporate headquarters is located in the U.S., we expect the Americas general and administrative expenses as a percentage of revenues to be higher than those of other regions.
Transaction costs. During the six months ended June 30, 2021, we recorded transaction costs totaling $8.2 million, primarily related to costs incurred in connection with the recent acquisitions and the formation of the EMEA 2 Joint Venture. During the six months ended June 30, 2020, we recorded transaction costs totaling $25.1 million, primarily related to costs incurred in connection with the Packet and Axtel acquisitions, as well as the formation of the Asia Pacific Joint Venture.
Gain or Loss on Asset Sales. During the six months ended June 30, 2021 and 2020, we did not record a significant amount of loss on asset sales.
Income from Operations. Our income from operations for the six months ended June 30, 2021 and 2020 by geographic regions was as follows (dollars in thousands):
| | | | | | | | | | | | | | | | | | | | | | | | | | | | | | | | | | | |
| | Six Months Ended June 30, | | % Change |
| | 2021 | | % | | 2020 | | % | | Actual | | Constant
Currency |
| Americas | $ | 109,310 | | | 19 | % | | $ | 105,731 | | | 20 | % | | 3 | % | | 7 | % |
| EMEA | 250,943 | | | 44 | % | | 264,158 | | | 49 | % | | (5) | % | | (3) | % |
| Asia-Pacific | 216,063 | | | 37 | % | | 166,083 | | | 31 | % | | 30 | % | | 23 | % |
| Total | $ | 576,316 | | | 100 | % | | $ | 535,972 | | | 100 | % | | 8 | % | | 7 | % |
Americas Income from Operations. During the six months ended June 30, 2021, Americas income from operations increased by 3% (7% on a constant currency basis), primarily due to higher revenues as a result of our IBX data center expansion activity and organic growth, as described above.
EMEA Income from Operations. During the six months ended June 30, 2021, EMEA income from operations decreased by 5% (3% on a constant currency basis), primarily due to higher operating expenses as a percentage of revenues, which included higher depreciation expense driven by expansion activity and an increase in general and administrative expenses primarily driven by higher compensation costs.
Asia-Pacific Income from Operations. During the six months ended June 30, 2021, Asia-Pacific income from operations increased by 30% (23% on a constant currency basis), primarily due to higher revenues as a result of our IBX data center expansion activity and organic growth, as described above, as well as lower operating
expenses as a percentage of revenues, including lower transaction costs due to minimal acquisition and joint venture activities in the first half of 2021.
Interest Income. Interest income was $1.1 million and $6.0 million, respectively, for the six months ended June 30, 2021 and 2020. The average annualized yield for the six months ended June 30, 2021 was 0.13% versus 0.67% for the six months ended June 30, 2020.
Interest Expense. Interest expense decreased to $176.9 million for the six months ended June 30, 2021 from $215.8 million for the six months ended June 30, 2020, primarily due to interest savings as a result of our recent refinancing activities. During the six months ended June 30, 2021 and 2020, we capitalized $12.8 million and $12.9 million, respectively, of interest expense to construction in progress. See Note 10 within the Condensed Consolidated Financial Statements.
Other Income or Expense. We recorded net other expense of $46.3 million for the six months ended June 30, 2021, primarily due to a $33.6 million impairment charge resulting from the settlement of a pre-acquisition uncertain tax position, as well as foreign currency exchange gains and losses. For the six months ended June 30, 2020, we recorded net other income of $9.4 million, which was primarily due to foreign currency exchange gains and losses, net of the impact from derivative instruments used to manage foreign exchange risks.
Loss on debt extinguishment. We recorded a loss on debt extinguishment of $115.5 million during the six months ended June 30, 2021, primarily due to the redemption of 2.875% Euro Senior Notes due 2026 and the 5.375% Senior Notes due 2027. During the six months ended June 30, 2020, we recorded a loss on debt extinguishment of $8.3 million due to the redemption of the remaining balance of the 5.375% Senior Notes due 2022 and termination of 364-day term loan facilities.
Income Taxes. We operate as a REIT for U.S. federal income tax purposes. As a REIT, we are generally not subject to U.S. federal income taxes on our taxable income distributed to stockholders. We intend to distribute or have distributed the entire taxable income generated by the operations of our REIT and QRSs for the tax years ending December 31, 2021 and 2020, respectively. As such, other than tax on built-in-gains recognized, state income taxes, and foreign income and withholding taxes, as applicable, no provision for income taxes has been included for the REIT and QRSs in the accompanying condensed consolidated financial statements for the six months ended June 30, 2021 and 2020.
We have made TRS elections for some of our subsidiaries in and outside the U.S. In general, a TRS may provide services that would otherwise be considered impermissible for REITs to provide and may hold assets that may not be REIT compliant.
U.S. income taxes for the TRS entities located in the U.S. and foreign income taxes for our foreign operations regardless of whether the foreign operations are operated as QRSs or TRSs have been accrued, as necessary, for the six months ended June 30, 2021 and 2020.
For the six months ended June 30, 2021 and 2020, we recorded $14.1 million and $74.9 million of income tax expense, respectively. Our effective tax rates were 5.9% and 22.9%, for the six months ended June 30, 2021 and 2020, respectively. The decrease in the effective tax rate for the six months ended June 30, 2021 as compared to the same period in 2020 is primarily due to the favorable resolution of uncertain tax positions of approximately $72.0 million resulting from the settlement of various tax audits in the UK, Germany, and Australia, partially offset by $11.0 million resulting from the revaluation of our deferred tax liabilities due to the UK corporate tax rate increase from 19% to 25% enacted in the current period.
Of the unrecognized tax benefits being realized in the current period, $33.6 million is related to the uncertain tax position inherited from the Metronode Acquisition. The uncertain tax position was covered by an indemnification agreement with the Seller. The realization of the unrecognized tax benefits resulted in an impairment of the indemnification asset for the same amount, which has been included in Other Income (Expense) on the Condensed Consolidated Statements of Operations.
Adjusted EBITDA. Adjusted EBITDA is a key factor in how we assess the operating performance of our segments and develop regional growth strategies such as IBX data center expansion decisions. We define adjusted EBITDA as income or loss from operations excluding depreciation, amortization, accretion, stock-based compensation expense, restructuring charges, impairment charges, transaction costs and gain on asset sales. See "Non-GAAP Financial Measures" below for more information about adjusted EBITDA and a reconciliation of adjusted EBITDA to income or loss from operations. Our adjusted EBITDA for the six months ended June 30, 2021 and 2020 by geographic regions was as follows (dollars in thousands):
| | | | | | | | | | | | | | | | | | | | | | | | | | | | | | | | | | | |
| | Six Months Ended June 30, | | % Change |
| | 2021 | | % | | 2020 | | % | | Actual | | Constant
Currency |
| Americas | $ | 670,416 | | | 43 | % | | $ | 595,720 | | | 42 | % | | 13 | % | | 13 | % |
| EMEA | 506,089 | | | 32 | % | | 473,755 | | | 34 | % | | 7 | % | | 4 | % |
| Asia-Pacific | 394,004 | | | 25 | % | | 334,776 | | | 24 | % | | 18 | % | | 11 | % |
| Total | $ | 1,570,509 | | | 100 | % | | $ | 1,404,251 | | | 100 | % | | 12 | % | | 10 | % |
Americas Adjusted EBITDA. During the six months ended June 30, 2021, Americas adjusted EBITDA increased by 13% (and also 13% on a constant currency basis). The increase in our Americas adjusted EBITDA was primarily due to higher revenues as a result of our IBX data center expansion activity and organic growth as described above.
EMEA Adjusted EBITDA. During the six months ended June 30, 2021, EMEA adjusted EBITDA increased by 7% (4% on a constant currency basis). The increase in our EMEA adjusted EBITDA was primarily due to higher revenues as a result of our IBX data center expansion activity and organic growth as described above.
Asia-Pacific Adjusted EBITDA. During the six months ended June 30, 2021, Asia-Pacific adjusted EBITDA increased by 18% (11% on a constant currency basis). The increase in our Asia-Pacific adjusted EBITDA was primarily due to higher revenues as a result of our IBX data center expansion activity and organic growth as described above, as well as lower cost of revenues and sales and marketing expenses as a percentage of revenues.
Non-GAAP Financial Measures
We provide all information required in accordance with GAAP, but we believe that evaluating our ongoing results of operations may be difficult if limited to reviewing only GAAP financial measures. Accordingly, we use non-GAAP financial measures to evaluate our operations.
Non-GAAP financial measures are not a substitute for financial information prepared in accordance with GAAP. Non-GAAP financial measures should not be considered in isolation, but should be considered together with the most directly comparable GAAP financial measures and the reconciliation of the non-GAAP financial measures to the most directly comparable GAAP financial measures. We have presented such non-GAAP financial measures to provide investors with an additional tool to evaluate our results of operations in a manner that focuses on what management believes to be our core, ongoing business operations. We believe that the inclusion of these non-GAAP financial measures provides consistency and comparability with past reports and provides a better understanding of the overall performance of the business and ability to perform in subsequent periods. We believe that if we did not provide such non-GAAP financial information, investors would not have all the necessary data to analyze Equinix effectively.
Investors should note that the non-GAAP financial measures used by us may not be the same non-GAAP financial measures, and may not be calculated in the same manner, as those of other companies. Investors should therefore exercise caution when comparing non-GAAP financial measures used by us to similarly titled non-GAAP financial measures of other companies.
Our primary non-GAAP financial measures, adjusted EBITDA and adjusted funds from operations ("AFFO"), exclude depreciation expense as these charges primarily relate to the initial construction costs of our IBX data centers and do not reflect our current or future cash spending levels to support our business. Our IBX data centers are long-lived assets and have an economic life greater than 10 years. The construction costs of an IBX data center do not recur with respect to such data center, although we may incur initial construction costs in future periods with respect to additional IBX data centers, and future capital expenditures remain minor relative to our initial investment. This is a trend we expect to continue. In addition, depreciation is also based on the estimated useful lives of our IBX data centers. These estimates could vary from actual performance of the asset, are based on historical costs incurred to build out our IBX data centers and are not indicative of current or expected future capital expenditures. Therefore, we exclude depreciation from our results of operations when evaluating our operations.
In addition, in presenting adjusted EBITDA and AFFO, we exclude amortization expense related to acquired intangible assets. Amortization expense is significantly affected by the timing and magnitude of our acquisitions and these charges may vary in amount from period to period. We exclude amortization expense to facilitate a more meaningful evaluation of our current operating performance and comparisons to our prior periods. We exclude accretion expense, both as it relates to asset retirement obligations as well as accrued restructuring charge liabilities, as these expenses represent costs which we believe are not meaningful in evaluating our current operations. We exclude stock-based compensation expense, as it can vary significantly from period to period based on share price, the timing, size and nature of equity awards. As such, we, and many investors and analysts, exclude stock-based compensation expense to compare our results of operations with those of other companies. We also exclude restructuring charges. The restructuring charges relate to our decisions to exit leases for excess space adjacent to several of our IBX data centers, which we did not intend to build out, or our decision to reverse such restructuring charges. We also exclude impairment charges generally related to certain long-lived assets. The impairment charges are related to expense recognized whenever events or changes in circumstances indicate that the carrying amount of assets are not recoverable. We also exclude gain or loss on asset sales as it represents profit or loss that is not meaningful in evaluating the current or future operating performance. Finally, we exclude transaction costs from AFFO and adjusted EBITDA to allow more comparable comparisons of our financial results to our historical operations. The transaction costs relate to costs we incur in connection with business combinations and the formation of joint ventures, including advisory, legal, accounting, valuation, and other professional or consulting fees. Such charges generally are not relevant to assessing our long-term performance. In addition, the frequency and amount of such charges vary significantly based on the size and timing of the transactions. Management believes items such as restructuring charges, impairment charges, gain or loss on asset sales and transaction costs are non-core transactions; however, these types of costs may occur in future periods.
Adjusted EBITDA
We define adjusted EBITDA as income from operations excluding depreciation, amortization, accretion, stock-based compensation expense, restructuring charges, impairment charges, transaction costs, and gain or loss on asset sales as presented below (in thousands):
| | | | | | | | | | | | | | | | | | | | | | | |
| Three Months Ended
June 30, | | Six Months Ended
June 30, |
| | 2021 | | 2020 | | 2021 | | 2020 |
| Income from operations | $ | 278,654 | | | $ | 282,488 | | | $ | 576,316 | | | $ | 535,972 | |
| Depreciation, amortization, and accretion expense | 417,758 | | | 348,434 | | | 812,076 | | | 685,865 | |
| Stock-based compensation expense | 94,335 | | | 75,844 | | | 172,685 | | | 156,410 | |
| Transaction costs | 6,985 | | | 13,617 | | | 8,167 | | | 25,147 | |
| | | | | | | |
| (Gain) loss on asset sales | (455) | | | (342) | | | 1,265 | | | 857 | |
| Adjusted EBITDA | $ | 797,277 | | | $ | 720,041 | | | $ | 1,570,509 | | | $ | 1,404,251 | |
Our adjusted EBITDA results have increased each year in total dollars due to the increase in our operating results, as discussed in "Results of Operations", as well as the nature of our business model consisting of a recurring revenue stream and a cost structure which has a large base that is fixed in nature, as also discussed in "Overview".
Funds from Operations ("FFO") and AFFO
We use FFO and AFFO, which are non-GAAP financial measures commonly used in the REIT industry. FFO is calculated in accordance with the standards established by the National Association of Real Estate Investment Trusts. FFO represents net income (loss), excluding gain (loss) from the disposition of real estate assets, depreciation and amortization on real estate assets and adjustments for unconsolidated joint ventures' and non-controlling interests' share of these items.
In presenting AFFO, we exclude certain items that we believe are not good indicators of our current or future operating performance. AFFO represents FFO excluding depreciation and amortization expense on non-real estate assets, accretion, stock-based compensation, restructuring charges, impairment charges, transaction costs, an installation revenue adjustment, a straight-line rent expense adjustment, a contract cost adjustment, amortization of deferred financing costs and debt discounts and premiums, gain (loss) on debt extinguishment, an income tax expense adjustment, recurring capital expenditures, net income (loss) from discontinued operations, net of tax, and adjustments from FFO to AFFO for unconsolidated joint ventures' and noncontrolling interests' share of these items. The adjustments for installation revenue, straight-line rent expense and contract costs are intended to isolate the cash activity included within the straight-lined or amortized results in the consolidated statement of operations. We exclude the amortization of deferred financing costs and debt discounts and premiums as these expenses relate to the initial costs incurred in connection with debt financings that have no current or future cash obligations. We exclude gain (loss) on debt extinguishment since it generally represents the write-off of initial costs incurred in connection with debt financings or a cost that is incurred to reduce future interest costs and is not a good indicator of our current or future operating performance. We include an income tax expense adjustment, which represents the non-cash tax impact due to changes in valuation allowances, uncertain tax positions and deferred taxes that do not relate to current period's operations. We deduct recurring capital expenditures, which represent expenditures to extend the useful life of its IBX data centers or other assets that are required to support current revenues. We also exclude net income (loss) from discontinued operations, net of tax, which represents results that may not recur and are not a good indicator of our current future operating performance.
Our FFO and AFFO were as follows (in thousands):
| | | | | | | | | | | | | | | | | | | | | | | | | |
| Three Months Ended
June 30, | | Six Months Ended
June 30, | | |
| | 2021 | | 2020 | | 2021 | | 2020 | | |
| Net income | $ | 68,487 | | | $ | 133,350 | | | $ | 224,561 | | | $ | 252,307 | | | |
Net (income) loss attributable to non-controlling interests | (148) | | | (46) | | | 140 | | | (211) | | | |
| Net income attributable to Equinix | 68,339 | | | 133,304 | | | 224,701 | | | 252,096 | | | |
| Adjustments: | | | | | | | | | |
| Real estate depreciation | 271,500 | | | 222,613 | | | 528,144 | | | 444,400 | | | |
| (Gain) loss on disposition of real estate property | (518) | | | 376 | | | 2,612 | | | 2,882 | | | |
| Adjustments for FFO from unconsolidated joint ventures | 1,552 | | | 653 | | | 2,679 | | | 1,322 | | | |
| FFO attributable to common shareholders | $ | 340,873 | | | $ | 356,946 | | | $ | 758,136 | | | $ | 700,700 | | | |
| | | | | | | | | | |
| | Three Months Ended
June 30, | | Six Months Ended
June 30, | | |
| | 2021 | | 2020 | | 2021 | | 2020 | | |
| FFO attributable to common shareholders | $ | 340,873 | | | $ | 356,946 | | | $ | 758,136 | | | $ | 700,700 | | | |
| Adjustments: | | | | | | | | | |
| Installation revenue adjustment | 4,539 | | | 3,649 | | | 8,451 | | | 168 | | | |
| Straight-line rent expense adjustment | 3,381 | | | 2,395 | | | 7,742 | | | 4,201 | | | |
| Contract cost adjustment | (13,381) | | | (5,307) | | | (27,392) | | | (15,741) | | | |
Amortization of deferred financing costs and debt discounts and premiums | 4,447 | | | 4,444 | | | 8,370 | | | 7,904 | | | |
| Stock-based compensation expense | 94,335 | | | 75,844 | | | 172,685 | | | 156,410 | | | |
| Non-real estate depreciation expense | 93,062 | | | 76,618 | | | 178,040 | | | 142,209 | | | |
| Amortization expense | 51,679 | | | 49,362 | | | 105,074 | | | 97,853 | | | |
| Accretion expense (adjustment) | 1,517 | | | (159) | | | 818 | | | 1,403 | | | |
| Recurring capital expenditures | (45,331) | | | (29,996) | | | (65,661) | | | (47,864) | | | |
| Loss on debt extinguishment | 102,460 | | | 1,868 | | | 115,518 | | | 8,309 | | | |
| Transaction costs | 6,985 | | | 13,617 | | | 8,167 | | | 25,147 | | | |
Impairment charges (1) | 33,552 | | | — | | | 33,552 | | | — | | | |
Income tax expense adjustment (1) | (47,440) | | | 8,070 | | | (46,675) | | | 10,903 | | | |
| Adjustments for AFFO from unconsolidated joint ventures | 1,259 | | | 442 | | | 1,940 | | | 896 | | | |
| | | | | | | | | |
| AFFO attributable to common shareholders | $ | 631,937 | | | $ | 557,793 | | | $ | 1,258,765 | | | $ | 1,092,498 | | | |
(1)Represents the impairment of an indemnification asset resulting from the settlement of a pre-acquisition uncertain tax position, which was recorded as Other Income (Expense) on the Condensed Consolidated Statements of Operations. This impairment charge was offset by the recognition of tax benefits in the same amount, which was included within the Income tax expense adjustment line on the table above. See Note 1 within the Condensed Consolidated Financial Statements.
Our AFFO results have improved due to the improved operating results discussed earlier in "Results of Operations," as well as due to the nature of our business model which consists of a recurring revenue stream and a cost structure which has a large base that is fixed in nature as discussed earlier in "Overview."
Constant Currency Presentation
Our revenues and certain operating expenses (cost of revenues, sales and marketing and general and administrative expenses) from our international operations have represented and will continue to represent a significant portion of our total revenues and certain operating expenses. As a result, our revenues and certain operating expenses have been and will continue to be affected by changes in the U.S. dollar against major international currencies. During the three and six months ended June 30, 2021 as compared to the same period in 2020 the U.S. dollar was weaker relative to the Australian dollar, Euro, British Pound, and Singapore dollar, which resulted in a favorable foreign currency impact on revenue, operating income and adjusted EBITDA, and an unfavorable foreign currency impact on operating expenses. In order to provide a framework for assessing how each of our business segments performed excluding the impact of foreign currency fluctuations, we present period-over-period percentage changes in our revenues and certain operating expenses on a constant currency basis in addition to the historical amounts as reported. Our constant currency presentation excludes the impact of our foreign currency cash flow hedging activities. Presenting constant currency results of operations is a non-GAAP financial measure and is not meant to be considered in isolation or as an alternative to GAAP results of operations. However, we have presented this non-GAAP financial measure to provide investors with an additional tool to evaluate our results of operations. To present this information, our current period revenues and certain operating expenses from entities reporting in currencies other than the U.S. dollar are converted into U.S. dollars at constant exchange rates rather than the actual exchange rates in effect during the respective periods (i.e. average rates in effect for the six months ended June 30, 2020 are used as exchange rates for the six months ended June 30, 2021 when comparing the six months ended June 30, 2021 with the six months ended June 30, 2020).
Liquidity and Capital Resources
As of June 30, 2021, our total indebtedness was comprised of debt and financing obligations totaling $14.0 billion consisting of:
•$11.2 billion of principal from our senior notes;
•$2.1 billion from our finance lease liabilities; and
•$0.7 billion of principal from our mortgage and loans payable (gross of debt issuance cost, debt discount, plus mortgage premium).
During the six months ended June 30, 2021, we completed the following significant financing activities:
•Issued $1.3 billion of 2027 and 2033 Euro Senior Notes, and repaid $0.6 billion of legacy 2.875% Euro Senior Notes; and
•Issued $2.6 billion of Senior Notes due 2026, 2028, 2031 and 2052, repaid approximately $659.9 million outstanding under our Term Loan Facility and redeemed all of our outstanding $1.25 billion 5.375% Senior Notes due 2027.
As of June 30, 2021, we had $1.8 billion of cash and cash equivalents. In addition to our cash, we had approximately $1.9 billion of additional liquidity available to us from our $2.0 billion revolving facility and general access to both public and private debt and the equity capital markets. We also have additional liquidity available to us from our 2020 ATM Program, under which we may offer and sell from time to time our common stock in "at the market" transactions. As of June 30, 2021, we had $1.4 billion available for sale under the 2020 ATM Program.
Besides any further financing activity we may pursue, customer collections are our primary source of cash. We believe we have a strong customer base, and have continued to experience relatively strong collections. We believe we have sufficient cash, coupled with anticipated cash generated from operating activities and external financing sources, to meet our operating requirements, including repayment of the current portion of our debt as it becomes due, distribution of dividends and completion of our publicly-announced acquisition and expansion projects. We also believe that our financial resources will allow us to manage future possible impact of the ongoing COVID-19 pandemic on our business operations for the foreseeable future, which could include reductions in revenue and delays in payments from customers and partners.
As we continue to grow, we may pursue additional expansion opportunities, primarily the build out of new IBX data centers, in certain of our existing markets which are at or near capacity within the next year, as well as potential acquisitions and joint ventures. We may elect to access the equity or debt markets from time to time opportunistically, particularly if financing is available on attractive terms. We will continue to evaluate our operating requirements and financial resources in light of future developments, including those relating to the ongoing COVID-19 pandemic.
Sources and Uses of Cash
| | | | | | | | | | | |
| | Six Months Ended June 30, |
| | 2021 | | 2020 |
| | (dollars in thousands) |
| Net cash provided by operating activities | $ | 990,355 | | | $ | 1,091,516 | |
| Net cash used in investing activities | (1,364,411) | | | (1,483,985) | |
| Net cash provided by financing activities | 587,330 | | | 3,325,873 | |
Operating Activities
Cash provided by our operations is generated by colocation, interconnection, managed infrastructure and other revenues. Our primary use of cash from our operating activities includes compensation and related costs, utility costs, interest payments, other general corporate expenditures and taxes. Net cash provided by operating activities decreased from the six months ended June 30, 2020 to the six months ended June 30, 2021 primarily due to cash paid for cost of revenues, operating expenses and income taxes and the timing of collections of our receivables, partially offset by improved results of operations.
Investing Activities
The net cash used in investing activities for the six months ended June 30, 2021 was primarily due to:
•capital expenditures of $1.3 billion as a result of our expansion activity;
•purchases of real estate of $87.6 million; and
•purchases of investments of $25.0 million.
The cash used in investing activities was partially offset by:
•proceeds from sales of investments of $4.1 million.
The net cash used in investing activities for the six months ended June 30, 2020 was primarily due to:
•capital expenditures of $882.9 million as a result of our expansion activity;
•purchases of real estate of $82.6 million;
•business acquisitions of Packet and Axtel for $478.2 million; and
•purchases of investments of $52.4 million.
The cash used in investing activities was partially offset by:
•proceeds from sales of investments of $12.1 million.
We anticipate our IBX data center expansion construction activity will be similar or increase from our current levels. If the opportunity to expand is greater than planned and we have sufficient funding to pursue such expansion opportunities, we may further increase the level of capital expenditure to support this growth as well as pursue additional business and real estate acquisitions or joint ventures.
Financing Activities
The net cash provided by financing activities for the six months ended June 30, 2021 was primarily due to:
•the issuance of $3.9 billion in senior notes;
•the sale of 137,604 shares of common stock under the 2020 ATM Program, for net proceeds of $99.6 million; and
•proceeds from the employee stock purchase plan of $40.0 million.
The proceeds were partially offset by:
•the repayment of senior notes of $2.0 billion;
•dividend distributions of $521.1 million;
•repayments of finance lease liabilities of $98.9 million;
•repayments of mortgage and loans payable of $696.1 million;
•debt extinguishment costs of $99.2 million; and
•debt issuance costs paid of $25.1 million.
The net cash used in financing activities for the six months ended June 30, 2020 was primarily due to:
•the issuance of $2.6 billion in Senior Notes due 2025, 2027, 2030, and 2050;
•the sale and issuance of 2,587,500 shares of common stock in a public offering for net proceeds of approximately $1,683.1 million;
•borrowings under the revolving credit facility of $250.0 million and the 364-Day term loan facilities of $500.8 million;
•the sale of 162,530 shares of common stock under our prior ATM program, for net proceeds of $101.8 million; and
•proceeds from the employee stock purchase plan of $30.4 million.
The proceeds were partially offset by:
•dividend distributions of $469.5 million;
•the repayment of senior notes of $493.7 million;
•repayments of finance lease liabilities of $42.7 million;
•repayments of mortgage and loans payable of $789.2 million; and
•debt issuance costs paid of $26.3 million.
Contractual Obligations and Off-Balance-Sheet Arrangements
We lease a majority of our IBX data centers and certain equipment under long-term lease agreements. The following represents our debt maturities, financings, leases and other contractual commitments as of June 30, 2021 (in thousands):
| | | | | | | | | | | | | | | | | | | | | | | | | | | | | | | | | | | | | | | | | |
| 2021 (6 months remaining) | | 2022 | | 2023 | | 2024 | | 2025 | | Thereafter | | Total |
Term loans and other loans payable (1) | $ | 21,357 | | | $ | 595,170 | | | $ | 6,832 | | | $ | 6,379 | | | $ | 4,769 | | | $ | 20,079 | | | $ | 654,586 | |
Senior notes (1) | — | | | — | | | — | | | 1,000,000 | | | 1,200,000 | | | 8,953,500 | | | 11,153,500 | |
Interest (2) | 111,749 | | | 252,387 | | | 237,717 | | | 237,533 | | | 211,062 | | | 1,765,343 | | | 2,815,791 | |
Finance leases (3) | 123,694 | | | 240,595 | | | 233,830 | | | 232,142 | | | 228,757 | | | 2,153,595 | | | 3,212,613 | |
Operating leases (3) | 91,036 | | | 194,169 | | | 179,406 | | | 166,529 | | | 157,801 | | | 1,012,325 | | | 1,801,266 | |
Other contractual commitments (4) | 1,721,075 | | | 407,437 | | | 165,668 | | | 58,792 | | | 42,698 | | | 340,229 | | | 2,735,899 | |
Asset retirement obligations (5) | 3,173 | | | 11,465 | | | 6,018 | | | 7,606 | | | 1,901 | | | 84,294 | | | 114,457 | |
| $ | 2,072,084 | | | $ | 1,701,223 | | | $ | 829,471 | | | $ | 1,708,981 | | | $ | 1,846,988 | | | $ | 14,329,365 | | | $ | 22,488,112 | |
(1)Represents principal and unamortized mortgage premium only.
(2)Represents interest on mortgage payable, loans payable, senior notes and term loans based on their respective interest rates as of June 30, 2021, as well as the credit facility fee for the revolving credit facility.
(3)Represents lease payments under finance and operating lease arrangements, including renewal options that are certain to be exercised.
(4)Represents off-balance sheet arrangements. Other contractual commitments are described below.
(5)Represents liability, net of future accretion expense.
As of June 30, 2021, we were contractually committed for $1.5 billion of unaccrued capital expenditures, primarily for IBX data center equipment not yet delivered and labor not yet provided in connection with the work necessary to complete construction and open these IBX data centers prior to making them available to customers for installation. This amount, which is expected to be paid during the remainder of 2021 and thereafter, is reflected in the table above as "other contractual commitments."
We had other non-capital purchase commitments in place as of June 30, 2021, such as commitments to purchase power in select locations and other open purchase orders, which contractually bind us for goods or services to be delivered or provided during 2021 and beyond. Such other purchase commitments as of June 30, 2021, which total $1.3 billion, are also reflected in the table above as "other contractual commitments."
Other commitments
We entered into lease agreements in various locations, primarily for data center spaces and ground leases, which have not yet commenced as of June 30, 2021. These lease agreements will commence between 2021 and 2023 with lease terms of 12 to 20 years and a total lease commitment of approximately $360.5 million, which are not reflected in the table above.
In connection with certain of our leases and other contracts requiring deposits, we entered into 39 irrevocable letters of credit totaling $78.7 million under the revolving credit facility. These letters of credit were provided in lieu of cash deposits under certain lease obligations. If beneficiaries of the letters of credit were to draw down on these letters of credit triggered by an event of default under the lease, we would be required to fund these letters of credit either through cash collateral or borrowing under the revolving credit facility. These contingent commitments are not reflected in the table above.
We had accrued liabilities related to uncertain tax positions totaling approximately $105.9 million as of June 30, 2021. These liabilities, which are reflected on our balance sheet, are not reflected in the table above since it is unclear when these liabilities will be paid.
In connection with the EMEA 1 Joint Venture, we agreed to make future equity contributions to the EMEA 1 Joint Venture to fund its future development. As of June 30, 2021, we had future equity contribution commitments of $25.1 million to the EMEA 1 Joint Venture, which are not reflected in the table above.
In connection with the sale of the PA9 data center, we also have a commitment to the EMEA 1 Joint Venture to complete a residual portion of the PA9 center for an estimated cost of $22.6 million in total, which is reimbursable in full upon completion and is not reflected in the table above. As of June 30, 2021, we had contract assets, current of $18.5 million, in relation to the progress in completing this commitment.
We also committed to make future equity contributions to the Asia-Pacific Joint Venture. As of June 30, 2021, we had future equity contribution commitments of $6.8 million to the Asia-Pacific Joint Venture, which is not reflected in the table above.
Critical Accounting Policies and Estimates
Our condensed consolidated financial statements and accompanying notes are prepared in accordance with U.S. GAAP. The preparation of our financial statements requires management to make estimates and assumptions that affect the reported amounts of assets and liabilities, the disclosure of contingent assets and liabilities at the date of the financial statements and the reported amounts of revenues and expenses during the reporting period. On an ongoing basis, management evaluates the accounting policies, assumptions, estimates and judgments to ensure that our condensed consolidated financial statements are presented fairly and in accordance with U.S. GAAP. Management bases its assumptions, estimates and judgments on historical experience, current trends and various other factors that are believed to be reasonable under the circumstances, the results of which form the basis for making judgments about the carrying values of assets and liabilities that are not readily apparent from other sources. However, because future events and their effects cannot be determined with certainty, actual results may differ from these assumptions and estimates, and such differences could be material. Critical accounting policies for Equinix that affect our more significant judgment and estimates used in the preparation of our condensed consolidated financial statements include accounting for income taxes, accounting for business combinations, accounting for impairment of goodwill, accounting for property, plant and equipment and accounting for leases, which are discussed in more detail under the caption "Critical Accounting Policies and Estimates" in Management's Discussion and Analysis of Financial Condition and Results of Operations, set forth in Part II Item 7, of our Annual Report on Form 10-K for the year ended December 31, 2020.
Recent Accounting Pronouncements
See Note 1 of Notes to Condensed Consolidated Financial Statements in Part I Item 1 of this Quarterly Report on Form 10-Q.
| | | | | |
| Item 3. | Quantitative and Qualitative Disclosures about Market Risk |
Market Risk
There have been no significant changes to our exposure management and procedures in relation to our market risk, investment portfolio risk, interest rate risk, foreign currency risk and commodity price risk exposures and procedures during the six months ended June 30, 2021 as compared to the respective risk exposures and procedures disclosed in Quantitative and Qualitative Disclosures About Market Risk, set forth in Part II Item 7A, of our Annual Report on Form 10-K for the year ended December 31, 2020, other than factors discussed below.
The uncertainty that exists with respect to the economic impact of the ongoing COVID-19 pandemic introduced significant volatility in the financial markets. See Part II, Item 1A. Risk Factors for additional information regarding potential risks to our business, financial condition and results of operations related to the ongoing COVID-19 pandemic.
Foreign Currency Risk
To help manage the exposure to foreign currency exchange rate fluctuations, we have implemented a number of hedging programs, in particular (i) a cash flow hedging program to hedge the forecasted revenues and expenses in our EMEA region, (ii) a balance sheet hedging program to hedge the re-measurement of monetary assets and liabilities denominated in foreign currencies, and (iii) a net investment hedging program to hedge the long term investments in our foreign subsidiaries. Our hedging programs reduce, but do not entirely eliminate, the impact of currency exchange rate movements and its impact on the consolidated statements of operations.
We have entered into various foreign currency debt obligations. As of June 30, 2021, the total principal amount of foreign currency debt obligations was $1.9 billion, including $1.3 billion denominated in Euro and $578.1 million denominated in British Pound. As of June 30, 2021, we have designated $1.5 billion of the total principal amount of foreign currency debt obligations as net investment hedges against our net investments in foreign subsidiaries. For a net investment hedge, changes in the fair value of the hedging instrument designated as a net investment hedge are recorded as a component of other comprehensive income (loss) in the consolidated balance sheets. Fluctuations in the exchange rates between these foreign currencies and the U.S. Dollar will impact the amount of U.S. Dollars that we will require to settle the foreign currency debt obligations at maturity. If the U.S. Dollar would have been weaker or stronger by 10% in comparison to these foreign currencies as of June 30, 2021, we estimate our obligation to cash settle the principal of these foreign currency debt obligations in U.S. Dollars would have increased or decreased by approximately $209.1 million and $171.1 million, respectively.
We are also party to cross-currency interest rate swaps. As of June 30, 2021, the total notional amount of currency cross-currency interest rate swap contracts outstanding was $4.0 billion. The cross-currency interest rate swaps are designated as hedges of our net investment in foreign subsidiaries and changes in the fair value of these swaps are recorded as a component of accumulated other comprehensive income (loss) in the condensed consolidated balance sheets. If the U.S. dollar weakened or strengthened by 10% in comparison to foreign currencies, we estimate our obligation to cash settle these hedges would have increased or decreased by approximately $468.6 million and $390.7 million, respectively.
The U.S. Dollar strengthened relative to certain of the currencies of the foreign countries in which we operate during the six months ended June 30, 2021. This has impacted our condensed consolidated financial position and results of operations during this period, including the amount of revenues that we reported. Continued strengthening or weakening of the U.S. Dollar will continue to impact us in future periods.
With the existing cash flow hedges in place, a hypothetical additional 10% strengthening of the U.S. Dollar for the six months ended June 30, 2021 would have resulted in a reduction of our revenues and operating expenses including depreciation and amortization expense by approximately $101.5 million and $100.6 million, respectively.
With the existing cash flow hedges in place, a hypothetical additional 10% weakening of the U.S. Dollar for the six months ended June 30, 2021 would have resulted in an increase of our revenues and operating expenses including depreciation and amortization expense by approximately $124.7 million and $124.8 million, respectively.
Interest Rate Risk
We are exposed to interest rate risk related to our outstanding debt. An immediate increase or decrease in current interest rates from their position as of June 30, 2021 would not have a material impact on our interest expense due to the fixed coupon rate on the majority of our debt obligations. However, the interest expense associated with our senior credit facility and term loans that bear interest at variable rates could be affected. For every 100-basis point increase or decrease in interest rates, our annual interest expense could increase by approximately $5.8 million or decrease by approximately $0.5 million based on the total balance of our term loan borrowings as of June 30, 2021. As of June 30, 2021, we had not employed any interest rate derivative products to hedge our variable rate debt obligations. However, we may enter into interest rate hedging agreements in the future to mitigate our exposure to interest rate risk.
We periodically enter into interest rate locks to hedge the interest rate exposure created by anticipated fixed rate debt issuances, which are designated as cash flow hedges. When interest rate locks are settled, any accumulated gain or loss included as a component of other comprehensive income (loss) will be amortized to interest expense over the term of the forecasted hedged transaction which is equivalent to the term of the interest rate locks.
| | | | | |
| Item 4. | Controls and Procedures |
(a) Evaluation of Disclosure Controls and Procedures. Our management, with the participation of our Chief Executive Officer and our Chief Financial Officer, conducted an evaluation, pursuant to Rule 13a-15 promulgated under the Securities Exchange Act of 1934, as amended (the "Exchange Act"), of the effectiveness of our "disclosure controls and procedures" as of the end of the period covered by this quarterly report. Based on this evaluation, the Chief Executive Officer and Chief Financial Officer concluded that the disclosure controls and procedures were effective as of the end of the period covered by this quarterly report.
(b) Changes in Internal Control over Financial Reporting. There were no changes in our internal control over financial reporting identified in connection with the evaluation required by Rules 13a-15(d) and 15d-15(d) of the Exchange Act that occurred during the six months ended June 30, 2021 that have materially affected, or are reasonably likely to materially affect, our internal control over financial reporting.
(c) Limitations on the Effectiveness of Controls. Our management, including our Chief Executive Officer and Chief Financial Officer, believes that our disclosure controls and procedures and internal control over financial reporting are designed and operated to be effective at the reasonable assurance level. However, our management does not expect that our disclosure controls and procedures or our internal control over financial reporting will prevent all errors and all fraud. A control system, no matter how well conceived and operated, can provide only reasonable, not absolute, assurance that the objectives of the control system are met. Further, the design of a control system must reflect the fact that there are resource constraints, and the benefits of controls must be considered relative to their costs. Because of the inherent limitations in all control systems, no evaluation of controls can provide absolute assurance that all control issues and instances of fraud, if any, have been detected. These inherent limitations include the realities that judgments in decision making can be faulty, and that breakdowns can occur because of a simple error or mistake. Additionally, controls can be circumvented by the individual acts of some persons, by collusion of two or more people or by management override of the controls. The design of any system of controls also is based in part upon certain assumptions about the likelihood of future events, and there can be no assurance that any design will succeed in achieving its stated goals under all potential future conditions; over time, controls may become inadequate because of changes in conditions, or the degree of compliance with policies or procedures may deteriorate. Because of the inherent limitations in a cost-effective control system, misstatements due to error or fraud may occur and not be detected.
PART II - OTHER INFORMATION
None.
In addition to the other information contained in this report, the following risk factors should be considered carefully in evaluating our business:
Risks Related to Our Business and Our Operations
The ongoing COVID-19 pandemic could have a negative effect on our business, results of operations and financial condition.
We have continuously monitored our global operations as the COVID-19 pandemic and its variants have spread across the globe and as variants and vaccines have developed. We have implemented procedures focusing on the health and safety of our employees, customers, partners and communities, the continuity of our business offerings and compliance with governmental regulations and local public health guidance and ordinances. We have activated our business continuity and pandemic plans and while our business operations have continued without interruption and our IBX data centers have remained fully operational to date, we cannot guarantee our business operations or our IBX data centers will not be negatively impacted in the future. Our IBX data centers have been designated “essential businesses” or “critical infrastructure” for purposes of remaining open during the COVID-19 pandemic in all of the jurisdictions that have published these exemptions but not all jurisdictions have created such designations. Any change in these classifications could cause operational disruptions or closures of the affected IBX data centers.
We implemented processes to limit and schedule access to certain IBX data centers based on infection rates and case counts as well as implemented social distancing and hygiene protocols. We have continued to track infections and adapt our policies and procedures based on a number of factors including the COVID-19 pandemic severity in each office and IBX location. These proactive actions we have taken or may take in the future and any restrictions imposed by the government could result in business delays, operational disruption and customer dissatisfaction. Employee illnesses resulting from the pandemic could result in further inefficiencies or delays and a suspected or confirmed case in an IBX data center could require temporary closure of the affected IBX data center for cleaning or until local regulatory requirements are fulfilled. Any closure of an IBX data center or limitation of customer access could cause customer dissatisfaction if customers are unable to access their equipment within the IBX data center. We also have service level agreements which could be affected if we are required to close an IBX data center for any reason.
Preventative measures instituted by governments and businesses to mitigate the spread of COVID-19, including travel restrictions, social distancing requirements, shelter in place orders and quarantines, have negatively impacted the global economy and may adversely impact us, our customers and vendors. Some of our customers have been negatively impacted by the COVID-19 pandemic which could affect our revenues. Certain customers have requested revised payment terms and more customers could potentially request such terms. If such an increase in requests for revised payment terms occurs, some delays in accounts receivable collection would result. We also expect some customers are relying on the governmental support via various COVID-19 related stimulus packages. If these stimulus packages do not continue or if they are not sufficient to meet our customers' needs, we could experience more customer churn as a result. In general, a prolonged economic downturn could result in a larger customer churn than we currently anticipate and reduced demand for our services, in which case our revenues could be significantly impacted. Given the uncertainty around the duration and extent of the ongoing COVID-19 pandemic, we cannot accurately predict at this time how the pandemic will affect our business over time.
We do not expect the construction delays that we have experienced to have a material effect on us at this time, but additional supply disruptions because of the ongoing COVID-19 pandemic could occur and cause construction delays that are significant in the future. Significant construction delays would interfere with our ability to meet commitments to customers who have contracted for space in new IBX data centers under construction and could have a material impact on our business. While we have received "essential business" permits for construction in some jurisdictions, these classifications may not extend to the construction of new IBX data centers in all of our jurisdictions. We are also reliant on third party construction labor to build and expand our IBX data centers, to which we may not have access due to the ongoing COVID-19 pandemic. We rely on materials, products and manufacturing from regions of the world which are impacted by the pandemic. It may not be possible to find replacement products or supplies and ongoing delays could affect our business and growth.
While the full extent and impact of the ongoing COVID-19 pandemic cannot be reasonably estimated at this time, it could have a material adverse impact on our business and financial condition. The extent to which the ongoing COVID-19 pandemic will impact our financial condition or results of operations will depend on many factors and future developments, including new information about the ongoing COVID-19 pandemic and its variants, additional surges in infection rates, vaccine efforts and any new government regulations which may emerge to contain the virus, among others.
We experienced an information technology security breach in the past and may be vulnerable to future security breaches, which could disrupt our operations and have a material adverse effect on our business results of operation and financial performance.
Despite our efforts to protect against cyber-attacks, we are not fully insulated from these types of security breaches, and such an attack could adversely impact our competitiveness and results of operations. In September 2020, we discovered ransomware on certain of our internal systems, encrypting files and holding them for ransom. Our teams responded quickly to address the incident and notified law enforcement, and after a thorough review of the incident by our management and experts retained to assist in this incident, the investigation was closed as of October 14, 2020. Our IBX data centers and our service offerings, including managed services, remained fully operational during the attack and the incident did not affect our ability to support our customers. We further believe that we were able to contain the incident and that the resolution will prevent the release of any data associated with this attack. While the event has been resolved and has not caused a material disruption to our systems nor resulted in any material costs to Equinix, our team is also working to protect against any future attacks. We will continue to face risks associated with unauthorized access to our computer systems, loss or destruction of data, computer viruses, ransomware, malware, distributed denial-of-service attacks or other malicious activities. These threats may result from human error, equipment failure or fraud or malice on the part of employees, vendors or third parties. As techniques used to breach security change frequently and are generally not recognized until launched against a target, we may not be able to promptly detect that a cyber breach has occurred, or implement security measures in a timely manner or, if and when implemented, we may not be able to determine the extent to which these measures could be circumvented. Because of the ongoing COVID-19 pandemic, many of our non-IBX employees are working from home and could potentially be exposed to new security risks or attempted breaches because of these new work environments. A party who is able to compromise the security measures on our networks or the security of our infrastructure could misappropriate either our proprietary information or the personal information of our customers or our employees, or cause interruptions or malfunctions in our operations or our customers' operations. As we provide assurances to our customers that we provide a high level of security, such a compromise could be particularly harmful to our brand and reputation. We may be required to expend significant capital and resources to protect against such threats or to alleviate problems caused by breaches in security. Any breaches that may occur in the future could expose us to increased risk of lawsuits, regulatory penalties, loss of existing or potential customers, damage relating to loss of proprietary information, harm to our reputation and increases in our security costs, which could have a material adverse effect on our financial performance and results of operations. We maintain insurance coverage for cyber risks, but such coverage may be unavailable or insufficient to cover our losses.
We offer professional services to our customers where we consult on data center solutions and assist with implementations. We also offer managed services in certain of our foreign jurisdictions outside of the U.S. where we manage the data center infrastructure for our customers. The access to our clients' networks and data, which is gained from these services, creates some risk that our clients' networks or data will be improperly accessed. We may also design our clients' cloud storage systems in such a way that exposes our clients to increased risk of data breach. If Equinix were held responsible for any such breach, it could result in a significant loss to Equinix, including damage to Equinix's client relationships, harm to our brand and reputation, and legal liability.
Terrorist activity, or other acts of violence, including violence stemming from the current climate of political and economic uncertainty, could adversely impact our business.
The continued threat of terrorist activity and other acts of war or hostility both domestically and abroad by terrorist organizations, organized crime organizations, or other criminals along with violence stemming from political unrest, contribute to a climate of political and economic uncertainty in many of the regions in which we operate. Due to existing or developing circumstances, we may need to incur additional costs in the future to provide enhanced security, including cyber security and physical security, which could have a material adverse effect on our business and results of operations. These circumstances may also adversely affect our ability to attract and retain customers and employees, our ability to raise capital and the operation and maintenance of our IBX data centers.
Our offerings have a long sales cycle that may harm our revenue and results of operations.
A customer's decision to purchase our offerings typically involves a significant commitment of resources. In addition, some customers will be reluctant to commit to locating in our IBX data centers until they are confident that the IBX data center has adequate carrier connections. As a result, we have a long sales cycle. Furthermore, we may devote significant time and resources to pursuing a particular sale or customer that does not result in revenues. We have also significantly expanded our sales force in recent years, and it will take time for these new hires to become fully productive. Delays may be further exacerbated by the ongoing COVID-19 pandemic.
Delays due to the length of our sales cycle may materially and adversely affect our revenues and results of operations, which could harm our ability to meet our forecasts and cause volatility in our stock price.
Any failure of our physical infrastructure or negative impact on our ability to meet our obligations to our customers, or damage to customer infrastructure within our IBX data centers, could lead to significant costs and disruptions that could reduce our revenue and harm our business reputation and financial results.
Our business depends on providing customers with highly reliable solutions. We must safehouse our customers' infrastructure and equipment located in our IBX data centers and ensure our IBX data centers and non-IBX offices remain operational at all times. We own certain of our IBX data centers, but others are leased by us, and we rely on the landlord for basic maintenance of our leased IBX data centers and office buildings. If such landlord has not maintained a leased property sufficiently, we may be forced into an early exit from the center which could be disruptive to our business. Furthermore, we continue to acquire IBX data centers not built by us. If we discover that these buildings and their infrastructure assets are not in the condition we expected when they were acquired, we may be required to incur substantial additional costs to repair or upgrade the IBX data centers. Newly acquired data centers also may not have the same power infrastructure and design in place as our own IBX data centers. These legacy designs could require upgrades in order to meet our standards and our customers’ expectations. Until the legacy systems are brought up to Equinix standards, customers in these legacy IBX data centers could be exposed to higher risks of unexpected power outages. We have experienced power outages because of these legacy design issues in the past and our customers could experience these in the future.
Problems at one or more of our IBX data centers or corporate offices, whether or not within our control, could result in service interruptions or significant infrastructure or equipment damage. These could result from numerous factors, including but not limited to:
•human error;
•equipment failure;
•physical, electronic and cyber security breaches;
•fire, earthquake, hurricane, flood, tornado and other natural disasters;
•extreme temperatures;
•water damage;
•fiber cuts;
•power loss;
•terrorist acts;
•sabotage and vandalism;
•global pandemics such as the COVID-19 pandemic;
•inability of our operations employees to access our IBX data centers for any reason; and
•failure of business partners who provide our resale products.
We have service level commitment obligations to certain customers. As a result, service interruptions or significant equipment damage in our IBX data centers could result in difficulty maintaining service level commitments to these customers and potential claims related to such failures. Because our IBX data centers are critical to many of our customers' businesses, service interruptions or significant equipment damage in our IBX data centers could also result in lost profits or other indirect or consequential damages to our customers. We cannot guarantee that a court would enforce any contractual limitations on our liability in the event that one of our customers brings a lawsuit against us as a result of a problem at one of our IBX data centers and we may decide to reach settlements with affected customers irrespective of any such contractual limitations. Any such settlement may result in a reduction of revenue under U.S. generally accepted accounting principles ("GAAP"). In addition, any loss of service, equipment damage or inability to meet our service level commitment obligations could reduce the confidence of our customers and could consequently impair our ability to obtain and retain customers, which would adversely affect both our ability to generate revenues and our results of operations.
Furthermore, we are dependent upon internet service providers, telecommunications carriers and other website operators in the Americas, Asia-Pacific and EMEA regions and elsewhere, some of which have experienced significant system failures and electrical outages in the past. Our customers may in the future experience difficulties due to system failures unrelated to our systems and offerings. If, for any reason, these providers fail to provide the required services, our business, financial condition and results of operations could be materially and adversely impacted.
Our IBX data center employees are critical to our ability to maintain our business operations and reach our service level commitments. Although we have redundancies built into our network, if our IBX employees are unable to access our IBX data centers for any reason, we could experience operational issues at the affected site. Pandemics, climate related crises or any other social, political, or economic disruption in the US or abroad could prevent sufficient staffing at our IBX data centers and have a material adverse impact on our operations.
We are currently making significant investments in our back-office information technology systems and processes. Difficulties from or disruptions to these efforts may interrupt our normal operations and adversely affect our business and results of operations.
We have been investing heavily in our back-office information technology systems and processes for a number of years and expect such investment to continue for the foreseeable future in support of our pursuit of global, scalable solutions across all geographies and functions that we operate in. These continuing investments include: 1) ongoing improvements to the customer experience from initial quote to customer billing and our revenue recognition process; 2) integration of recently-acquired operations onto our various information technology systems; and 3) implementation of new tools and technologies to either further streamline and automate processes, or to support our compliance with evolving U.S. GAAP. As a result of our continued work on these projects, we may experience difficulties with our systems, management distraction and significant business disruptions. For example, difficulties with our systems may interrupt our ability to accept and deliver customer orders and may adversely impact our overall financial operations, including our accounts payable, accounts receivables, general ledger, fixed assets, revenue recognition, close processes, internal financial controls and our ability to otherwise run and track our business. We may need to expend significant attention, time and resources to correct problems or find alternative sources for performing these functions. All of these changes to our financial systems also create an increased risk of deficiencies in our internal controls over financial reporting until such systems are stabilized. Such significant investments in our back-office systems may take longer to complete and cost more than originally planned. In addition, we may not realize the full benefits we hoped to achieve and there is a risk of an impairment charge if we decide that portions of these projects will not ultimately benefit us or are de-scoped. Finally, the collective impact of these changes to our business has placed significant demands on impacted employees across multiple functions, increasing the risk of errors and control deficiencies in our financial statements, distraction from the effective operation of our business and difficulty in attracting and retaining employees. Any such difficulties or disruptions may adversely affect our business and results of operations.
The level of insurance coverage that we purchase may prove to be inadequate.
We carry liability, property, business interruption and other insurance policies to cover insurable risks to our company. We select the types of insurance, the limits and the deductibles based on our specific risk profile, the cost of the insurance coverage versus its perceived benefit and general industry standards. Our insurance policies contain industry standard exclusions for events such as war and nuclear reaction. We purchase earthquake insurance for certain of our IBX data centers, but for our IBX data centers in high-risk zones, including those in California and Japan, we have elected to self-insure. The earthquake and flood insurance that we do purchase would be subject to high deductibles. Any of the limits of insurance that we purchase, including those for cyber risks, could prove to be inadequate, which could materially and adversely impact our business, financial condition and results of operations.
We are continuing to invest in our expansion efforts but may not have sufficient customer demand in the future to realize expected returns on these investments.
We are considering the acquisition or lease of additional properties and the construction of new IBX data centers beyond those expansion projects already announced. We will be required to commit substantial operational and financial resources to these IBX data centers, generally 12 to 18 months in advance of securing customer contracts, and we may not have sufficient customer demand in those markets to support these IBX data centers once they are built. In addition, unanticipated technological changes could affect customer requirements for data centers, and we may not have built such requirements into our new IBX data centers. Either of these contingencies, if they were to occur, could make it difficult for us to realize expected or reasonable returns on these investments.
The use of high power density equipment may limit our ability to fully utilize our older IBX data centers.
Some customers have increased their use of high power density equipment, such as blade servers, in our IBX data centers which has increased the demand for power on a per cabinet basis. Because many of our IBX data centers were built a number of years ago, the current demand for power may exceed the designed electrical capacity in these IBX data centers. As power, not space, is a limiting factor in many of our IBX data centers, our ability to fully utilize those IBX data centers may be impacted. The ability to increase the power capacity of an IBX data center, should we decide to, is dependent on several factors including, but not limited to, the local utility's ability to provide additional power; the length of time required to provide such power; and/or whether it is feasible to upgrade the electrical infrastructure of an IBX data center to deliver additional power to customers. Although we are currently designing and building to a higher power specification than that of many of our older IBX data centers, there is a risk that demand will continue to increase and our IBX data centers could become underutilized sooner than expected.
If we are unable to implement our evolving organizational structure or if we are unable to recruit or retain key executives and qualified personnel, our business could be harmed.
In connection with the evolving needs of our customers and our business, we undertook a review of our organizational architecture and have made, and will continue to make, changes as a result of that review. There can be no assurances that the changes will not result in attrition, that the significant amount of management and other employees' time and focus to implement the changes will not divert attention from operating and growing the business, or that any changes will result in increased organizational effectiveness. We must also continue to identify, hire, train and retain key personnel who maintain relationships with our customers and who can provide the technical, strategic and marketing skills required for our company's growth. There is a shortage of qualified personnel in these fields, and we compete with other companies for the limited pool of talent.
The failure to recruit and retain necessary key executives and personnel could cause disruption, harm our business and hamper our ability to grow our company.
We may not be able to compete successfully against current and future competitors.
The global multi-tenant data center market is highly fragmented. It is estimated that Equinix is one of more than 1,200 companies that provide these offerings around the world. Equinix competes with these firms which vary in terms of their data center offerings. We must continue to evolve our product strategy and be able to differentiate our IBX data centers and product offerings from those of our competitors.
Some of our competitors may adopt aggressive pricing policies, especially if they are not highly leveraged or have lower return thresholds than we do. As a result, we may suffer from pricing pressure that would adversely affect our ability to generate revenues. Some of these competitors may also provide our target customers with additional benefits, including bundled communication services or cloud services, and may do so in a manner that is more attractive to our potential customers than obtaining space in our IBX data centers. Similarly, with growing acceptance of cloud-based technologies, we are at risk of losing customers that may decide to fully leverage cloud infrastructure offerings instead of managing their own. Competitors could also operate more successfully or form alliances to acquire significant market share.
Failure to compete successfully may materially adversely affect our financial condition, cash flows and results of operations.
If we cannot continue to develop, acquire, market and provide new offerings or enhancements to existing offerings that meet customer requirements and differentiate us from our competitors, our results of operations could suffer.
As our customers evolve their IT strategies, we must remain flexible and evolve along with new technologies and industry and market shifts. Ineffective planning and execution in our cloud and product development strategies may cause difficulty in sustaining our competitive advantages.
The process of developing and acquiring new offerings and enhancing existing offerings is complex. If we fail to anticipate customers’ evolving needs and expectations or do not adapt to technological and IT trends, our results of operations could suffer. In order to adapt effectively, we sometimes must make long-term investments, develop, acquire or obtain certain intellectual property and commit significant resources before knowing whether our predictions will accurately reflect customer demand for the new offerings. If we misjudge customer needs in the future, our new offerings may not succeed, and our revenues and earnings may be harmed. Additionally, any delay in the development, acquisition, marketing or launch of a new offering could result in customer dissatisfaction or attrition. If we cannot continue adapting our products, or if our competitors can adapt their products more quickly than us, our business could be harmed.
We have closed and announced additional joint ventures with GIC and are also in discussions with a targeted set of hyperscale customers to develop capacity to serve their larger footprint needs by leveraging existing capacity and dedicated hyperscale builds. We have announced our intention to seek additional joint venture partners for certain of our hyperscale builds. There can be no assurances that our joint ventures will be successful or that we find additional partners or that we are able to successfully meet the needs of these customers.
In 2020, we also acquired Packet, a bare metal automation company to facilitate a new product offering for Equinix. While we believe this new product offering will be desirable to our customers and will complement our other offerings on Platform Equinix, we cannot guarantee the success of this product or any other new product offering. We have not historically offered hardware solutions, and this is a new market area for us which can bring challenges and could harm our business if not executed in the time or manner that we expect.
Our results of operations may fluctuate.
We have experienced fluctuations in our results of operations on a quarterly and annual basis. The fluctuations in our results of operations may cause the market price of our common stock to be volatile. We may experience significant fluctuations in our results of operations in the foreseeable future due to a variety of factors, including, but not limited to:
•fluctuations of foreign currencies in the markets in which we operate;
•the timing and magnitude of depreciation and interest expense or other expenses related to the acquisition, purchase or construction of additional IBX data centers or the upgrade of existing IBX data centers;
•demand for space, power and solutions at our IBX data centers;
•changes in general economic conditions, such as from the COVID-19 pandemic or other economic downturns, or specific market conditions in the telecommunications and internet industries, any of which could have a material impact on us or on our customer base;
•charges to earnings resulting from past acquisitions due to, among other things, impairment of goodwill or intangible assets, reduction in the useful lives of intangible assets acquired, identification of additional assumed contingent liabilities or revised estimates to restructure an acquired company's operations;
•the duration of the sales cycle for our offerings and our ability to ramp our newly-hired sales persons to full productivity within the time period we have forecasted;
•additions and changes in product offerings and our ability to ramp up and integrate new products within the time period we have forecasted;
•restructuring charges or reversals of restructuring charges, which may be necessary due to revised sublease assumptions, changes in strategy or otherwise;
•acquisitions or dispositions we may make;
•the financial condition and credit risk of our customers;
•the provision of customer discounts and credits;
•the mix of current and proposed products and offerings and the gross margins associated with our products and offerings;
•the timing required for new and future IBX data centers to open or become fully utilized;
•competition in the markets in which we operate;
•conditions related to international operations;
•increasing repair and maintenance expenses in connection with aging IBX data centers;
•lack of available capacity in our existing IBX data centers to generate new revenue or delays in opening new or acquired IBX data centers that delay our ability to generate new revenue in markets which have otherwise reached capacity;
•changes in rent expense as we amend our IBX data center leases in connection with extending their lease terms when their initial lease term expiration dates approach or changes in shared operating costs in connection with our leases, which are commonly referred to as common area maintenance expenses;
•the timing and magnitude of other operating expenses, including taxes, expenses related to the expansion of sales, marketing, operations and acquisitions, if any, of complementary businesses and assets;
•the cost and availability of adequate public utilities, including electricity;
•changes in employee stock-based compensation;
•overall inflation;
•increasing interest expense due to any increases in interest rates and/or potential additional debt financings;
•changes in our tax planning strategies or failure to realize anticipated benefits from such strategies;
•changes in income tax benefit or expense; and
•changes in or new GAAP as periodically released by the Financial Accounting Standards Board ("FASB").
Any of the foregoing factors, or other factors discussed elsewhere in this report, could have a material adverse effect on our business, results of operations and financial condition. Although we have experienced growth in revenues in recent quarters, this growth rate is not necessarily indicative of future results of operations. Prior to 2008, we had generated net losses every fiscal year since inception. It is possible that we may not be able to generate net income on a quarterly or annual basis in the future. In addition, a relatively large portion of our expenses are fixed in the short-term, particularly with respect to lease and personnel expenses, depreciation and amortization and interest expenses. Therefore, our results of operations are particularly sensitive to fluctuations in revenues. As such, comparisons to prior reporting periods should not be relied upon as indications of our future performance. In addition, our results of operations in one or more future quarters may fail to meet the expectations of securities analysts or investors.
Our DSO may be negatively impacted by process and system upgrades and acquisitions.
Our DSO may be negatively impacted by ongoing process and system upgrades which can impact our customers' experience in the short term, together with integrating recent acquisitions into our processes and systems, which may have a negative impact on our operating cash flows, liquidity and financial condition.
We may incur goodwill and other intangible asset impairment charges, or impairment charges to our property, plant and equipment, which could result in a significant reduction to our earnings.
In accordance with U.S. GAAP, we are required to assess our goodwill and other intangible assets annually, or more frequently whenever events or changes in circumstances indicate potential impairment, such as changing market conditions or any changes in key assumptions. If the testing performed indicates that an asset may not be recoverable, we are required to record a non-cash impairment charge for the difference between the carrying value of the goodwill or other intangible assets and the implied fair value of the goodwill or other intangible assets in the period the determination is made.
We also periodically monitor the remaining net book values of our property, plant and equipment, including at the individual IBX data center level. Although each individual IBX data center is currently performing in accordance with our expectations, the possibility that one or more IBX data centers could begin to under-perform relative to our expectations is possible and may also result in non-cash impairment charges.
These charges could be significant, which could have a material adverse effect on our business, results of operations or financial condition.
We have incurred substantial losses in the past and may incur additional losses in the future.
As of June 30, 2021, our retained earnings were $2.0 billion. Although we have generated net income for each fiscal year since 2008, except for the year ended December 31, 2014, we are currently investing heavily in our future growth through the build out of multiple additional IBX data centers, expansions of IBX data centers and acquisitions of complementary businesses. As a result, we will incur higher depreciation and other operating expenses, as well as transaction costs and interest expense, that may negatively impact our ability to sustain profitability in future periods unless and until these new IBX data centers generate enough revenue to exceed their operating costs and cover the additional overhead needed to scale our business for this anticipated growth. The current global financial uncertainty may also impact our ability to sustain profitability if we cannot generate sufficient revenue to offset the increased costs of our recently-opened IBX data centers or IBX data centers currently under construction. In addition, costs associated with the acquisition and integration of any acquired companies, as well as the additional interest expense associated with debt financing, we have undertaken to fund our growth initiatives, may also negatively impact our ability to sustain profitability. Finally, given the competitive and evolving nature of the industry in which we operate, we may not be able to sustain or increase profitability on a quarterly or annual basis.
The failure to obtain favorable terms when we renew our IBX data center leases, or the failure to renew such leases, could harm our business and results of operations.
While we own certain of our IBX data centers, others are leased under long-term arrangements. These leased IBX data centers have all been subject to significant development by us in order to convert them from, in most cases, vacant buildings or warehouses into IBX data centers. Most of our IBX data center leases have renewal options available to us. However, many of these renewal options provide for the rent to be set at then-prevailing market rates. To the extent that then-prevailing market rates or negotiated rates are higher than present rates, these higher costs may adversely impact our business and results of operations, or we may decide against renewing the lease. In the event that an IBX data center lease does not have a renewal option, or we fail to exercise a renewal option in a timely fashion and lose our right to renew the lease, we may not be successful in negotiating a renewal of the lease with the landlord. A failure to renew a lease could force us to exit a building prematurely, which could disrupt our business, harm our customer relationships, expose us to liability under our customer contracts, cause us to take impairment charges and affect our results of operations negatively.
We depend on a number of third parties to provide internet connectivity to our IBX data centers; if connectivity is interrupted or terminated, our results of operations and cash flow could be materially and adversely affected.
The presence of diverse telecommunications carriers' fiber networks in our IBX data centers is critical to our ability to retain and attract new customers. We are not a telecommunications carrier, and as such, we rely on third parties to provide our customers with carrier services. We believe that the availability of carrier capacity will directly affect our ability to achieve our projected results. We rely primarily on revenue opportunities from the telecommunications carriers' customers to encourage them to invest the capital and operating resources required to connect from their data centers to our IBX data centers. Carriers will likely evaluate the revenue opportunity of an
IBX data center based on the assumption that the environment will be highly competitive. We cannot provide assurance that each and every carrier will elect to offer its services within our IBX data centers or that once a carrier has decided to provide internet connectivity to our IBX data centers that it will continue to do so for any period of time.
Our new IBX data centers require construction and operation of a sophisticated redundant fiber network. The construction required to connect multiple carrier facilities to our IBX data centers is complex and involves factors outside of our control, including regulatory processes and the availability of construction resources. Any hardware or fiber failures on this network may result in significant loss of connectivity to our new IBX data center expansions. This could affect our ability to attract new customers to these IBX data centers or retain existing customers.
To date, the network neutrality of our IBX data centers and the variety of networks available to our customers has often been a competitive advantage for us. In certain of our acquired IBX data centers in the Asia-Pacific region, the limited number of carriers available reduces that advantage. As a result, we may need to adapt our key revenue-generating offerings and pricing to be competitive in those markets.
If the establishment of highly diverse internet connectivity to our IBX data centers does not occur, is materially delayed or is discontinued, or is subject to failure, our results of operations and financial condition will be adversely affected.
We have government customers, which subjects us to risks including early termination, audits, investigations, sanctions and penalties.
We derive revenues from contracts with the U.S. government, state and local governments and foreign governments. Some of these customers may terminate all or part of their contracts at any time, without cause. There is increased pressure for governments and their agencies, both domestically and internationally, to reduce spending. Some of our federal government contracts are subject to the approval of appropriations being made by the U.S. Congress to fund the expenditures under these contracts. Similarly, some of our contracts at the state and local levels are subject to government funding authorizations.
Additionally, government contracts often have unique terms and conditions, such as most favored customer obligations, and are generally subject to audits and investigations which could result in various civil and criminal penalties and administrative sanctions, including termination of contracts, refund of a portion of fees received, forfeiture of profits, suspension of payments, fines and suspensions or debarment from future government business.
Because we depend on the development and growth of a balanced customer base, including key magnet customers, failure to attract, grow and retain this base of customers could harm our business and results of operations.
Our ability to maximize revenues depends on our ability to develop and grow a balanced customer base, consisting of a variety of companies, including enterprises, cloud, digital content and financial companies, and network service providers. We consider certain of these customers to be key magnets in that they draw in other customers. The more balanced the customer base within each IBX data center, the better we will be able to generate significant interconnection revenues, which in turn increases our overall revenues. Our ability to attract customers to our IBX data centers will depend on a variety of factors, including the presence of multiple carriers, the mix of our offerings, the overall mix of customers, the presence of key customers attracting business through vertical market ecosystems, the IBX data center's operating reliability and security and our ability to effectively market our offerings. However, some of our customers may face competitive pressures and may ultimately not be successful or may be consolidated through merger or acquisition. If these customers do not continue to use our IBX data centers it may be disruptive to our business. Finally, any uncertain global economic climate, including the one we are currently experiencing as a result of the ongoing COVID-19 pandemic, could harm our ability to attract and retain customers if customers slow spending, or delay decision-making on our offerings, or if customers begin to have difficulty paying us or seek bankruptcy protection and we experience increased churn in our customer base. Any of these factors may hinder the development, growth and retention of a balanced customer base and adversely affect our business, financial condition and results of operations.
Industry consolidation may have a negative impact on our business model.
If customers combine businesses, they may require less colocation space, which could lead to churn in our customer base. Regional competitors may also consolidate to become a global competitor. Consolidation of our customers and/or our competitors may present a risk to our business model and have a negative impact on our revenues.
Our business could be harmed by prolonged power outages, shortages or capacity constraints.
Any power outages, shortages or capacity constraints may have an adverse effect on our business and our results of operations.
In each of our markets, we rely on third parties, and their infrastructure, to provide a sufficient amount of power for current and future customers. At the same time, power and cooling requirements are increasing per unit of equipment. As a result, some customers are consuming an increasing amount of power per cabinet. We generally do not control the amount of power our customers draw from their installed circuits, which can result in growth in the aggregate power consumption of our facilities beyond our original plan and expectations. This means that limitations on the capacity of our electrical delivery systems and equipment could limit customer utilization of our IBX data centers. These limitations could have a negative impact on the effective available capacity of a given center and limit our ability to grow our business, which could have a negative impact on our financial performance, results of operations and cash flows.
Our IBX data centers are affected by problems accessing electricity sources, such as planned or unplanned power outages and limitations on transmission or distribution. Unplanned power outages, including, but not limited to those relating to large storms, earthquakes, fires, tsunamis, cyberattacks, and any failures of electrical power grids more generally, and planned power outages by public utilities, such as those related to Pacific Gas and Electric Company's planned outages in California to minimize fire risks, could harm our customers and our business. While many of our offices are closed because of the ongoing COVID-19 pandemic, our employees in California may be subjected to planned power outages at home which could be difficult to track and could affect our day to day operations of our non-IBX employees. Our international operations are sometimes located outside of developed, reliable electricity markets, where we are exposed to some insecurity in supply associated with technical and regulatory problems, as well as transmission constraints. Some of our IBX data centers are located in leased buildings where, depending upon the lease requirements and number of tenants involved, we may or may not control some or all of the infrastructure including generators and fuel tanks. As a result, in the event of a power outage, we may be dependent upon the landlord, as well as the utility company, to restore the power. We attempt to limit our exposure to system downtime by using backup generators and alternative power supplies, but these measures may not always prevent downtime, which can adversely affect customer experience and revenues.
Each new facility requires access to significant quantities of electricity. Limitations on generation, transmission and distribution may limit our ability to obtain sufficient power capacity for potential expansion sites in new or existing markets. We may experience significant delays and substantial increased costs demanded by the utilities to provide the level of electrical service required by our current IBX data center designs.
Risks Related to Our Expansion Plans
Our construction of new IBX data centers or IBX data center expansions could involve significant risks to our business.
In order to sustain our growth in certain of our existing and new markets, we may have to expand an existing data center, lease a new facility or acquire suitable land, with or without structures, to build new IBX data centers from the ground up. Expansions or new builds are currently underway, or being contemplated, in many of our markets. These construction projects expose us to many risks which could have an adverse effect on our results of operations and financial condition. As described in these Risk Factors, the ongoing COVID-19 pandemic has exacerbated many of these construction risks and has created additional risks for our business. Some of the risks associated with construction projects include:
•construction delays;
•lack of availability and delays for data center equipment, including items such as generators and switchgear;
•unexpected budget changes;
•increased prices for and delays in obtaining building supplies, raw materials and data center equipment;
•labor availability, labor disputes and work stoppages with contractors, subcontractors and other third parties, including interruptions in work due to the ongoing COVID-19 pandemic;
•unanticipated environmental issues and geological problems;
•delays related to permitting and approvals to open from public agencies and utility companies;
•delays in site readiness leading to our failure to meet commitments made to customers planning to expand into a new build; and
•unanticipated customer requirements that would necessitate alternative data center design, making our site less desirable or leading to increased costs in order to make necessary modifications or retrofits.
Construction projects are dependent on permitting from public agencies and utility companies. Any delay in permitting could affect our growth. We are currently experiencing permitting delays in most metros due to reduced production from labor availability and from other COVID-19 pandemic related permitting restrictions or stoppages. While we don't currently anticipate any material long-term negative impact to our business because of these construction delays, these types of delays and stoppages related to permitting from public agencies and utility companies could worsen and have an adverse effect on our bookings, revenue or growth.
Additionally, all construction related projects require us to carefully select and rely on the experience of one or more designers, general contractors, and associated subcontractors during the design and construction process. Should a designer, general contractor, significant subcontractor or key supplier experience financial problems or other problems during the design or construction process, we could experience significant delays, increased costs to complete the project and/or other negative impacts to our expected returns.
Site selection is also a critical factor in our expansion plans. There may not be suitable properties available in our markets with the necessary combination of high-power capacity and fiber connectivity, or selection may be limited. Thus, while we may prefer to locate new IBX data centers adjacent to our existing locations, it may not always be possible. In the event we decide to build new IBX data centers separate from our existing IBX data centers, we may provide metro connect solutions to connect these two IBX data centers. Should these solutions not provide the necessary reliability to sustain connection, this could result in lower interconnection revenue and lower margins and could have a negative impact on customer retention over time.
Acquisitions present many risks, and we may not realize the financial or strategic goals that were contemplated at the time of any transaction.
Over the last several years, we have completed numerous acquisitions, including most recently that of data centers from Bell in the fourth quarter of 2020, Packet in March 2020, and three data centers from Axtel in Mexico in January 2020. We expect to make additional acquisitions in the future, which may include (i) acquisitions of businesses, products, solutions or technologies that we believe to be complementary, (ii) acquisitions of new IBX data centers or real estate for development of new IBX data centers; (iii) acquisitions through investments in local data center operators; or (iv) acquisitions in new markets with higher risk profiles. We may pay for future acquisitions by using our existing cash resources (which may limit other potential uses of our cash), incurring additional debt (which may increase our interest expense, leverage and debt service requirements) and/or issuing shares (which may dilute our existing stockholders and have a negative effect on our earnings per share). Acquisitions expose us to potential risks, many of which could be exacerbated by the ongoing COVID-19 pandemic, including:
•the possible disruption of our ongoing business and diversion of management's attention by acquisition, transition and integration activities, particularly when multiple acquisitions and integrations are occurring at the same time or when we are entering an emerging market with a higher risk profile;
•our potential inability to successfully pursue or realize some or all of the anticipated revenue opportunities associated with an acquisition or investment;
•the possibility that we may not be able to successfully integrate acquired businesses, or businesses in which we invest, or achieve anticipated operating efficiencies or cost savings;
•the possibility that announced acquisitions may not be completed, due to failure to satisfy the conditions to closing as a result of:
•an injunction, law or order that makes unlawful the consummation of the acquisition;
•inaccuracy or breach of the representations and warranties of, or the non-compliance with covenants by, either party;
•the nonreceipt of closing documents; or
•for other reasons;
•the possibility that there could be a delay in the completion of an acquisition, which could, among other things, result in additional transaction costs, loss of revenue or other adverse effects resulting from such uncertainty;
•the possibility that our projections about the success of an acquisition could be inaccurate and any such inaccuracies could have a material adverse effect on our financial projections;
•the dilution of our existing stockholders as a result of our issuing stock as consideration in a transaction or selling stock in order to fund the transaction;
•the possibility of customer dissatisfaction if we are unable to achieve levels of quality and stability on par with past practices;
•the possibility that we will be unable to retain relationships with key customers, landlords and/or suppliers of the acquired businesses, some of which may terminate their contracts with the acquired business as a result of the acquisition or which may attempt to negotiate changes in their current or future business relationships with us;
•the possibility that we could lose key employees from the acquired businesses;
•the possibility that we may be unable to integrate certain IT systems that do not meet Equinix's standard requirements with respect to security, privacy or any other standard;
•the potential deterioration in our ability to access credit markets due to increased leverage;
•the possibility that our customers may not accept either the existing equipment infrastructure or the "look-and-feel" of a new or different IBX data center;
•the possibility that additional capital expenditures may be required or that transaction expenses associated with acquisitions may be higher than anticipated;
•the possibility that required financing to fund an acquisition may not be available on acceptable terms or at all;
•the possibility that we may be unable to obtain required approvals from governmental authorities under antitrust and competition laws on a timely basis or at all, which could, among other things, delay or prevent us from completing an acquisition, limit our ability to realize the expected financial or strategic benefits of an acquisition or have other adverse effects on our current business and operations;
•the possible loss or reduction in value of acquired businesses;
•the possibility that future acquisitions may present new complexities in deal structure, related complex accounting and coordination with new partners, particularly in light of our desire to maintain our qualification for taxation as a REIT;
•the possibility that we may not be able to prepare and issue our financial statements and other public filings in a timely and accurate manner, and/or maintain an effective control environment, due to the strain on the finance organization when multiple acquisitions and integrations are occurring at the same time;
•the possibility that future acquisitions may trigger property tax reassessments resulting in a substantial increase to our property taxes beyond that which we anticipated;
•the possibility that future acquisitions may be in geographies and regulatory environments to which we are unaccustomed and we may become subject to complex requirements and risks with which we have limited experience;
•the possibility that future acquisitions may appear less attractive due to fluctuations in foreign currency rates;
•the possibility that carriers may find it cost-prohibitive or impractical to bring fiber and networks into a new IBX data center;
•the possibility of litigation or other claims in connection with, or as a result of, an acquisition, including claims from terminated employees, customers, former stockholders or other third parties;
•the possibility that asset divestments may be required in order to obtain regulatory clearance for a transaction;
•the possibility of pre-existing undisclosed liabilities, including, but not limited to, lease or landlord related liability, tax liability, environmental liability or asbestos liability, for which insurance coverage may be insufficient or unavailable, or other issues not discovered in the diligence process;
•the possibility that we receive limited or incorrect information about the acquired business in the diligence process, particularly in light of the travel bans and other restrictions imposed due to the COVID-19 pandemic; and
•the possibility that we do not have full visibility into customer agreements and customer termination rights during the diligence process which could expose us to additional liabilities after completing the acquisition.
The occurrence of any of these risks could have a material adverse effect on our business, results of operations, financial condition or cash flows. If an acquisition does not proceed or is materially delayed for any reason, the price of our common stock may be adversely impacted, and we will not recognize the anticipated benefits of the acquisition.
We cannot assure that the price of any future acquisitions of IBX data centers will be similar to prior IBX data center acquisitions. In fact, we expect costs required to build or render new IBX data centers operational to increase in the future. If our revenue does not keep pace with these potential acquisition and expansion costs, we may not be able to maintain our current or expected margins as we absorb these additional expenses. There is no assurance we would successfully overcome these risks, or any other problems encountered with these acquisitions.
The anticipated benefits of our Joint Ventures with GIC may not be fully realized, or take longer to realize than expected.
We have entered into joint ventures with GIC to develop and operate xScale™ data centers (together, the “Joint Ventures”). Equinix owns a 20% and GIC owns an 80% interest in each joint venture, and Equinix operates all facilities.
We are investing in developing certain sites with the intent of selling these assets to these Joint Ventures. The success of these Joint Ventures will depend, in part, on the successful development of the data center sites, and we may not realize all of the anticipated benefits. Such development may be more difficult, time-consuming or costly than expected and could result in increased costs, decreases in the amount of expected revenues and diversion of management's time and energy, which could materially impact our business, financial condition and results of operations. Additionally, if it is determined these sites are no longer desirable for the Joint Ventures, we would need to find a different buyer or invest in the sites in order to develop them for a different purpose.
We may not realize all of the anticipated benefits from our Joint Ventures. The success of these Joint Ventures will depend, in part, on the successful partnership between Equinix and GIC. Such a partnership is subject to risks as outlined below in our risk factor related to Joint Ventures, and more generally, to the same types of business risks as would impact our IBX data center business. A failure to successfully partner, or a failure to realize our expectations for the Joint Ventures, could materially impact our business, financial condition and results of operations. These Joint Ventures could also be negatively impacted by development and construction delays, including those resulting from the ongoing COVID-19 pandemic.
Joint venture investments, such as our Joint Ventures with GIC, could expose us to risks and liabilities in connection with the formation of the new joint ventures, the operation of such joint ventures without sole decision-making authority, and our reliance on joint venture partners who may have economic and business interests that are inconsistent with our business interests.
In addition to our current and proposed Joint Ventures with GIC, we may co-invest with other third parties through partnerships, joint ventures or other entities in the future. These joint ventures could result in our acquisition of non-controlling interests in, or shared responsibility for, managing the affairs of a property or portfolio of properties, partnership, joint venture or other entity. We may be subject to additional risks, including:
•we may not have the right to exercise sole decision-making authority regarding the properties, partnership, joint venture or other entity;
•if our partners become bankrupt or fail to fund their share of required capital contributions, we may choose to or be required to contribute such capital;
•our partners may have economic, tax or other business interests or goals which are inconsistent with our business interests or goals, and may be in a position to take actions contrary to our policies or objectives;
•our joint venture partners may take actions that are not within our control, which could require us to dispose of the joint venture asset, transfer it to a TRS in order to maintain our qualification for taxation as a REIT, or purchase the partner's interests or assets at an above-market price;
•our joint venture partners may take actions unrelated to our business agreement but which reflect poorly on Equinix because of our joint venture;
•disputes between us and our partners may result in litigation or arbitration that would increase our expenses and prevent our management from focusing their time and effort on our day-to-day business; and
•we may in certain circumstances be liable for the actions of our third-party partners or guarantee all or a portion of the joint venture's liabilities, which may require us to pay an amount greater than its investment in the joint venture.
Each of these factors may result in returns on these investments being less than we expect or in losses, and our financial and results of operations may be adversely affected.
If we cannot effectively manage our international operations, and successfully implement our international expansion plans, or comply with evolving laws and regulations, our revenues may not increase, and our business and results of operations would be harmed.
For the years ended December 31, 2020, 2019 and 2018, we recognized approximately 59%, 58% and 55%, respectively, of our revenues outside the U.S. We currently operate outside of the U.S. in Canada, Mexico, Asia-Pacific, EMEA, and South America.
To date, the network neutrality of our IBX data centers and the variety of networks available to our customers has often been a competitive advantage for us. In certain of our acquired IBX data centers in the Asia-Pacific region, the limited number of carriers available reduces that advantage. As a result, we may need to adapt our key revenue-generating offerings and pricing to be competitive in those markets. In addition, we are currently undergoing expansions or evaluating expansion opportunities outside of the U.S. Undertaking and managing expansions in foreign jurisdictions may present unanticipated challenges to us.
Our international operations are generally subject to a number of additional risks, including:
•the costs of customizing IBX data centers for foreign countries;
•protectionist laws and business practices favoring local competition;
•greater difficulty or delay in accounts receivable collection;
•difficulties in staffing and managing foreign operations, including negotiating with foreign labor unions or workers' councils;
•difficulties in managing across cultures and in foreign languages;
•political and economic instability;
•fluctuations in currency exchange rates;
•difficulties in repatriating funds from certain countries;
•our ability to obtain, transfer or maintain licenses required by governmental entities with respect to our business;
•unexpected changes in regulatory, tax and political environments such as the United Kingdom's withdrawal from the European Union ("Brexit"), the recent Hong Kong security law, and the current trade war between the U.S. and China;
•our ability to secure and maintain the necessary physical and telecommunications infrastructure;
•compliance with anti-bribery and corruption laws;
•compliance with economic and trade sanctions enforced by the Office of Foreign Assets Control of the U.S. Department of Treasury;
•compliance with evolving governmental regulation with which we have little experience; and
•compliance with evolving and varied regulations related to the ongoing COVID-19 pandemic.
Geo-political events, such as the ongoing COVID-19 pandemic, Brexit, political unrest in Hong Kong, the recent Hong Kong security law, and the trade war between the U.S. and China, may increase the likelihood of the listed risks to occur and could have a negative effect on our business domestically or internationally. With respect to Brexit, it is possible that the level of economic activity in the United Kingdom and the rest of Europe will be adversely impacted and that we will face increased regulatory and legal complexities in these regions which could have an adverse impact on our business and employees in EMEA and could adversely affect our financial condition and results of operations. In addition, compliance with international and U.S. laws and regulations that apply to our international operations increases our cost of doing business in foreign jurisdictions. These laws and regulations include the General Data Protection Regulation ("GDPR") and other data privacy laws and requirements, labor relations laws, tax laws, anti-competition regulations, import and trade restrictions, export requirements, economic and trade sanctions, U.S. laws such as the Foreign Corrupt Practices Act and local laws which also prohibit corrupt payments to governmental officials. With respect to the current trade war between the U.S. and China, we have several customers in China named in restrictive executive orders by the previous U.S. administration that are currently covered by a freeze issued by the current U.S. administration or currently enjoined from enforcement subject to pending litigation. If Equinix is required to cease business with these companies, or additional companies in the future, our revenues could be adversely affected. Violations of any of these domestic or international laws and regulations could result in fines, criminal sanctions against us, our officers or our employees, and prohibitions on the conduct of our business. Any such violations could include prohibitions on our ability to offer our offerings in one or more countries, could delay or prevent potential acquisitions, and could also materially damage our reputation, our brand, our international expansion efforts, our ability to attract and retain employees, our business and results of operations. Our success depends, in part, on our ability to anticipate and address these risks and manage these difficulties.
Risks Related to Our Capital Needs and Capital Strategy
Our substantial debt could adversely affect our cash flows and limit our flexibility to raise additional capital.
We have a significant amount of debt and may need to incur additional debt to support our growth. Additional debt may also be incurred to fund future acquisitions, any future special distributions, regular distributions or the other cash outlays associated with maintaining our qualification for taxation as a REIT. As of June 30, 2021, our total indebtedness (gross of debt issuance cost, debt discount, and debt premium) was approximately $14.0 billion, our stockholders' equity was $10.6 billion and our cash and cash equivalents totaled $1.8 billion. In addition, as of June 30, 2021, we had approximately $1.9 billion of additional liquidity available to us from our $2.0 billion revolving credit facility. In addition to our substantial debt, we lease many of our IBX data centers and certain equipment under lease agreements, some of which are accounted for as operating leases. As of June 30, 2021, we recorded operating lease liabilities of $1.3 billion, which represents our obligation to make lease payments under those lease arrangements.
Our substantial amount of debt and related covenants, and our off-balance sheet commitments, could have important consequences. For example, they could:
•require us to dedicate a substantial portion of our cash flow from operations to make interest and principal payments on our debt and in respect of other off-balance sheet arrangements, reducing the availability of our cash flow to fund future capital expenditures, working capital, execution of our expansion strategy and other general corporate requirements;
•increase the likelihood of negative outlook from our credit rating agencies, or of a downgrade to our current rating;
•make it more difficult for us to satisfy our obligations under our various debt instruments;
•increase our cost of borrowing and even limit our ability to access additional debt to fund future growth;
•increase our vulnerability to general adverse economic and industry conditions and adverse changes in governmental regulations;
•limit our flexibility in planning for, or reacting to, changes in our business and industry, which may place us at a competitive disadvantage compared with our competitors;
•limit our operating flexibility through covenants with which we must comply;
•limit our ability to borrow additional funds, even when necessary to maintain adequate liquidity, which would also limit our ability to further expand our business; and
•make us more vulnerable to increases in interest rates because of the variable interest rates on some of our borrowings to the extent we have not entirely hedged such variable rate debt.
The occurrence of any of the foregoing factors could have a material adverse effect on our business, results of operations and financial condition.
We may also need to refinance a portion of our outstanding debt as it matures. There is a risk that we may not be able to refinance existing debt or that the terms of any refinancing may not be as favorable as the terms of our existing debt. Furthermore, if prevailing interest rates or other factors at the time of refinancing result in higher interest rates upon refinancing, then the interest expense relating to that refinanced indebtedness would increase. These risks could materially adversely affect our financial condition, cash flows and results of operations.
The phase-out of the London Interbank Offered Rate (“LIBOR”), and uncertainty as to its replacement, may adversely affect our business.
On July 27, 2017, the United Kingdom Financial Conduct Authority, which regulates LIBOR, announced that it intends to stop persuading or compelling banks to submit rates for the calibration of LIBOR after 2021 after which time it can no longer guarantee its availability. Although alternative reference rates have been proposed, it is unknown at this point which of these alternative reference rates will attain market acceptance as replacements for LIBOR.
Certain term loan borrowings under our Senior Credit Facility bear interest at rates that are calculated based on LIBOR. In addition, certain of our agreements, including select financing, intercompany, derivative and joint venture agreements, also make reference to LIBOR. To prepare for the phase out of LIBOR, we may need to renegotiate the Senior Credit Facility and other agreements and may not be able to do so on terms that are favorable to us. It is also currently unknown what impact any contract modification will have on our financial statements. Further, the financial markets may be disrupted as a result of the phase out of LIBOR if banks fail to execute a smooth transition to an alternate rate.
Disruption in the financial markets or the inability to renegotiate our agreements to remove and replace LIBOR on favorable terms, or a negative impact from any contract modifications, could have an adverse effect on our business, financial position, and results of operations.
Sales or issuances of shares of our common stock may adversely affect the market price of our common stock.
Future sales or issuances of common stock or other equity related securities may adversely affect the market price of our common stock, including any shares of our common stock issued to finance capital expenditures, finance acquisitions or repay debt. In October 2020, we established the 2020 ATM Program in the amount of $1.5 billion under which we may, from time to time, issue and sell shares of our common stock to or through sales agents up to established limits. As of June 30, 2021, we had $1.4 billion available for sale under the 2020 ATM Program. We expect to refresh our ATM program periodically, which could lead to additional dilution for our stockholders in the future. We may also seek authorization to sell additional shares of common stock through other means which could lead to additional dilution for our stockholders. Please see Note 12 within the Condensed Consolidated Financial Statements of this Quarterly Report on Form 10-Q for sales of our common stock under our ATM programs.
If we are not able to generate sufficient operating cash flows or obtain external financing, our ability to fund incremental expansion plans may be limited.
Our capital expenditures, together with ongoing operating expenses, obligations to service our debt and the cash outlays associated with our REIT distribution requirements, are, and will continue to be, a substantial burden on our cash flow and may decrease our cash balances. Additional debt or equity financing may not be available when needed or, if available, may not be available on satisfactory terms. Our inability to obtain additional debt and/or equity financing or to generate sufficient cash from operations may require us to prioritize projects or curtail capital expenditures which could adversely affect our results of operations.
Fluctuations in foreign currency exchange rates in the markets in which we operate internationally could harm our results of operations.
We may experience gains and losses resulting from fluctuations in foreign currency exchange rates. To date, the majority of revenues and costs in our international operations are denominated in foreign currencies. Where our prices are denominated in U.S. Dollars, our sales and revenues could be adversely affected by declines in foreign currencies relative to the U.S. Dollar, thereby making our offerings more expensive in local currencies. We are also exposed to risks resulting from fluctuations in foreign currency exchange rates in connection with our international operations. To the extent we are paying contractors in foreign currencies, our operations could cost more than anticipated as a result of declines in the U.S. Dollar relative to foreign currencies. In addition, fluctuating foreign currency exchange rates have a direct impact on how our international results of operations translate into U.S. Dollars.
Although we currently undertake, and may decide in the future to further undertake, foreign exchange hedging transactions to reduce foreign currency transaction exposure, we do not currently intend to eliminate all foreign currency transaction exposure. In addition, REIT compliance rules may restrict our ability to enter into hedging transactions. Therefore, any weakness of the U.S. Dollar may have a positive impact on our consolidated results of operations because the currencies in the foreign countries in which we operate may translate into more U.S. Dollars. However, if the U.S. Dollar strengthens relative to the currencies of the foreign countries in which we operate, our consolidated financial position and results of operations may be negatively impacted as amounts in foreign currencies will generally translate into fewer U.S. Dollars. For additional information on foreign currency risks, refer to our discussion of foreign currency risk in "Quantitative and Qualitative Disclosures About Market Risk" included in Item 2 of this Quarterly Report on Form 10-Q.
Our derivative transactions expose us to counterparty credit risk.
Our derivative transactions expose us to risk of financial loss if a counterparty fails to perform under a derivative contract. Disruptions in the financial markets could lead to sudden decreases in a counterparty's liquidity, which could make them unable to perform under the terms of their derivative contract and we may not be able to realize the benefit of the derivative contract.
Risks Related to Environmental Laws and Climate Change Impacts
Environmental regulations may impose upon us new or unexpected costs.
We are subject to various federal, state, local and international environmental and health and safety laws and regulations, including those relating to the generation, storage, handling and disposal of hazardous substances and wastes. Certain of these laws and regulations also impose joint and several liability, without regard to fault, for investigation and cleanup costs on current and former owners and operators of real property and persons who have disposed of or released hazardous substances into the environment. Our operations involve the use of hazardous substances and materials such as petroleum fuel for emergency generators, as well as batteries, cleaning solutions and other materials. In addition, we lease, own or operate real property at which hazardous substances and regulated materials have been used in the past. At some of our locations, hazardous substances or regulated materials are known to be present in soil or groundwater, and there may be additional unknown hazardous substances or regulated materials present at sites we own, operate or lease. At some of our locations, there are land use restrictions in place relating to earlier environmental cleanups that do not materially limit our use of the sites. To the extent any hazardous substances or any other substance or material must be cleaned up or removed
from our property, we may be responsible under applicable laws, permits or leases for the removal or cleanup of such substances or materials, the cost of which could be substantial.
We purchase significant amounts of electricity from generating facilities and utility companies that are subject to environmental laws, regulations and permit requirements. These environmental requirements are subject to material change, which could result in increases in our electricity suppliers' compliance costs that may be passed through to us. Regulations promulgated by the U.S. EPA or other international regulators could limit air emissions from fossil fuel-fired power plants, restrict discharges of cooling water, and otherwise impose new operational restraints on conventional power plants that could increase costs of electricity. Regulatory programs intended to promote increased generation of electricity from renewable sources may also increase our costs of procuring electricity. In addition, we are directly subject to environmental, health and safety laws regulating air emissions, storm water management and other issues arising in our business. For example, our emergency generators are subject to state and federal regulations governing air pollutants, which could limit the operation of those generators or require the installation of new pollution control technologies. While environmental regulations do not normally impose material costs upon our operations, unexpected events, equipment malfunctions, human error and changes in law or regulations, among other factors, can lead to additional capital requirements, limitations upon our operations and unexpected increased costs.
Regulation of greenhouse gas ("GHG") emissions could increase the cost of electricity by reducing amounts of electricity generated from fossil fuels, by requiring the use of more expensive generating methods or by imposing taxes or fees upon electricity generation or use. There has been interest in the U.S. Congress and in countries where we operate abroad in addressing climate change. In the U.S., with the current presidential administration, we believe there is a likelihood that new regulations or legislation will be proposed and potentially enacted that would seek to limit carbon dioxide emissions and the use of fossil fuels. Past legislative proposals to address climate change include measures ranging from "carbon taxes," to tax credits, to federally imposed limitations on GHG emissions. The course of future legislation and regulation in the U.S. and abroad remains difficult to predict and the potential increased costs associated with GHG regulation or taxes cannot be estimated at this time.
State regulations also have the potential to increase our costs of obtaining electricity. Certain states and countries in which we operate have issued or are considering and may enact environmental regulations that could materially affect our facilities and electricity costs. For example, California has limited GHG emissions from new and existing conventional power plants by imposing regulatory caps and by auctioning the rights to emission allowances. Washington, Oregon and Massachusetts have issued regulations to implement similar carbon cap and trade programs, and other states are considering proposals to limit carbon emissions through cap and trade programs, carbon pricing programs and other mechanisms. Some northeastern states adopted a multi-state program for limiting carbon emissions through the Regional Greenhouse Gas Initiative ("RGGI") cap and trade program. State and international programs have not had a material adverse effect on our electricity costs to date, but due to the market-driven nature of some of the programs, they could have a material adverse effect on electricity costs in the future.
Aside from regulatory requirements, we have separately undertaken efforts to procure energy from renewable energy projects in order to support new renewables development. The costs of procuring such energy may exceed the costs of procuring electricity from existing sources, such as existing utilities or electric service provided through conventional grids. These efforts to support and enhance renewable electricity generation may increase our costs of electricity above those that would be incurred through procurement of conventional electricity from existing sources.
Our business may be adversely affected by climate change and responses to it.
Severe weather events, such as droughts, fires, flooding, heat waves, hurricanes, typhoons and other winter storms, pose a threat to our IBX data centers and our customers' IT infrastructure through physical damage to facilities or equipment, power supply disruption, and long-term effects on the cost of electricity. The frequency and intensity of severe weather events are reportedly increasing locally and regionally as part of broader climate changes. Global weather pattern changes may also pose long-term risks of physical impacts to our business.
We maintain disaster recovery and business continuity plans that would be implemented in the event of severe weather events that interrupt our business or affect our customers' IT infrastructure housed in our IBX data centers. While these plans are designed to allow us to recover from natural disasters or other events that can interrupt our
business, we cannot be certain that our plans will work as intended, facilitating our response to such disasters or events. Failure to prevent impact to customers from such events could adversely affect our business.
We are dedicated to sustainability and face pressures from our customers and stockholders, who are increasingly focused on climate change, to prioritize sustainable energy practices, reduce our carbon footprint and promote sustainability. To address these goals and concerns, we pursue opportunities to improve energy efficiency and implement energy-saving retrofits. In addition, we have established a long-term goal of using 100% clean and renewable energy. As a result of these and other initiatives, we have made progress towards reducing our carbon footprint. It is possible, however, that our customers and investors might not be satisfied with our sustainability efforts or the speed of their adoption. If we do not meet our customers' or stockholders' expectations, our business and/or our share price could be harmed.
Concern about climate change in various jurisdictions may result in more stringent laws and regulatory requirements regarding emissions of carbon dioxide or other GHGs. As described above under "RISK FACTORS - Environmental regulations may impose upon us new or unexpected costs," restrictions on carbon dioxide or other GHG emissions could result in significant increases in operating or capital costs, including higher energy costs generally, and increased costs from carbon taxes, emission cap and trade programs and renewable portfolio standards that are imposed upon our electricity suppliers. These higher energy costs, and the cost of complying across our global platform, or of failing to comply with these and other climate change regulations, may have an adverse effect on our business and our results of operations.
Risks Related to Certain Regulations and Laws, Including Tax Laws
Changes in U.S. or foreign tax laws, regulations, or interpretations thereof, including changes to tax rates, may adversely affect our financial statements and cash taxes.
We are a U.S. company with global subsidiaries and are subject to income and other taxes in the U.S. (although currently limited due to our taxation as a REIT) and many foreign jurisdictions. Significant judgment is required in determining our worldwide provision for income and other taxes. Although we believe that we have adequately assessed and accounted for our potential tax liabilities, and that our tax estimates are reasonable, there can be no certainty that additional taxes will not be due upon audit of our tax returns or as a result of changes to the tax laws and interpretations thereof. For example, we are currently undergoing audits and appealing the tentative assessments in a number of jurisdictions where we operate. The final results of these audits and the outcomes of the appeals are uncertain and may not be resolved in our favor. Additionally, the current presidential administration of the U.S. has proposed a potential minimum tax as well as changes to the laws governing the US taxation of foreign earned income under the GILTI (Global Intangible Low Taxed Income) rules. It is unclear under the current proposal whether REITs might be exempt from these laws. Changes in tax laws, including the addition of a minimum tax threshold and to the GILTI rules, could have a material adverse effect on our tax liability and increase our REIT dividend distribution meaningfully.
The Organisation for Economic Co-operation and Development ("OECD") is an international association made up of over 30 countries including the U.S. The OECD has proposed and made numerous changes to long-standing tax principles, which, if adopted by the member countries, could have a materially adverse effect on our tax liabilities. For example, various jurisdictions are starting to explore the taxation of digital service through the adoption of tax principles which could have a negative effect on Equinix’s tax liability.
The ongoing COVID-19 pandemic has led to increased spending by many governments. Because of this, there could be pressure to increase taxes in the future to pay back debts and generate revenues. The nature and timing of any future changes to each jurisdiction's tax laws and the impact on our future tax liabilities because of the COVID-19 pandemic or for any other reason cannot be predicted with any accuracy but could materially and adversely impact our results of operations and financial position or cash flows.
Government regulation or failure to comply with laws and regulations may adversely affect our business.
Various laws and governmental regulations, both in the U.S. and abroad, governing internet-related services, related communications services and information technologies remain largely unsettled, even in areas where there has been some legislative action. For example, the Federal Communications Commission ("FCC") recently overturned network neutrality rules, which may result in material changes in the regulations and contribution regime affecting us and our customers. Furthermore, the U.S. Congress and state legislatures are reviewing and considering changes to the new FCC rules making the future of network neutrality uncertain. Changes to these laws
and regulations could have a material adverse effect on us and our customers. There may also be forthcoming regulation in the U.S. on a federal or state level in the areas of cybersecurity, data privacy, taxation and data security, any of which could impact Equinix and our customers. Similarly, data privacy regulations continue to evolve and must be addressed by Equinix as a global company.
We remain focused on whether and how existing and changing laws, such as those governing intellectual property, privacy, libel, telecommunications services, data flows/data localization, carbon emissions impact, competition and antitrust, and taxation apply to our business and those which might have a material effect on our customers’ decisions to purchase our services. Substantial resources may be required to comply with regulations or bring any non-compliant business practices into compliance with such regulations. In addition, the continuing development of the market for online commerce and the displacement of traditional telephony service by the internet and related communications services may prompt an increased call for more stringent consumer protection laws or other regulation both in the U.S. and abroad that may impose additional burdens on companies conducting business online and their service providers.
While our business and IBX data centers are currently all operational and have been designated "critical infrastructure" or "essential services" in order to remain open in many jurisdictions during the ongoing COVID-19 pandemic, any regulations restricting our ability to operate our business due to the COVID-19 pandemic could have a material adverse effect on our business. Additionally, the "essential services" and "critical infrastructure" designations we have experienced could lead countries or local regulators to impose additional regulations on the data center industry due to the COVID-19 pandemic in order to have better visibility and control over our industry for future events.
We strive to comply with all laws and regulations that apply to our business. However, as these laws evolve, they can be subject to varying interpretations and regulator discretion. To the extent a regulator or court disagrees with our interpretation of these laws and determines that our practices are not in compliance with applicable laws and regulations, we could be subject to civil and criminal penalties that could adversely affect our business operations. The adoption, or modification of laws or regulations relating to the internet and our business, or interpretations of existing laws, could have a material adverse effect on our business, financial condition and results of operations.
Risks Related to Our Taxation as a REIT
We may not remain qualified for taxation as a REIT.
We elected to be taxed as a REIT for U.S. federal income tax purposes beginning with our 2015 taxable year. We believe that our organization and method of operation comply with the rules and regulations promulgated under the Internal Revenue Code of 1986, as amended (the "Code"), such that we will continue to qualify for taxation as a REIT. However, we cannot assure you that we have qualified for taxation as a REIT or that we will remain so qualified. Qualification for taxation as a REIT involves the application of highly technical and complex provisions of the Code to our operations as well as various factual determinations concerning matters and circumstances not entirely within our control. There are limited judicial or administrative interpretations of applicable REIT provisions of the Code.
If, in any taxable year, we fail to remain qualified for taxation as a REIT and are not entitled to relief under the Code:
•we will not be allowed a deduction for distributions to stockholders in computing our taxable income;
•we will be subject to the U.S. federal and state income tax on our taxable income at regular corporate income tax rates; and
•we would not be eligible to elect REIT status again until the fifth taxable year that begins after the first year for which we failed to qualify for taxation as a REIT.
Any such corporate tax liability could be substantial and would reduce the amount of cash available for other purposes. If we fail to remain qualified for taxation as a REIT, we may need to borrow additional funds or liquidate some investments to pay any additional tax liability. Accordingly, funds available for investment and distributions to stockholders could be reduced.
As a REIT, failure to make required distributions would subject us to federal corporate income tax.
We paid quarterly distributions in March and June of 2021 and have declared a quarterly distribution to be paid on September 22, 2021. The amount, timing and form of any future distributions will be determined, and will be subject to adjustment, by our Board of Directors. To remain qualified for taxation as a REIT, we are generally required to distribute at least 90% of our REIT taxable income (determined without regard to the dividends paid deduction and excluding net capital gain) each year, or in limited circumstances, the following year, to our stockholders. Generally, we expect to distribute all or substantially all of our REIT taxable income. If our cash available for distribution falls short of our estimates, we may be unable to maintain distributions that approximate our REIT taxable income and may fail to remain qualified for taxation as a REIT. In addition, our cash flows from operations may be insufficient to fund required distributions as a result of differences in timing between the actual receipt of income and the payment of expenses and the recognition of income and expenses for federal income tax purposes, or the effect of nondeductible expenditures, such as capital expenditures, payments of compensation for which Section 162(m) of the Code denies a deduction, interest expense deductions limited by Section 163(j) of the Code, the creation of reserves or required debt service or amortization payments.
To the extent that we satisfy the 90% distribution requirement but distribute less than 100% of our REIT taxable income, we will be subject to federal corporate income tax on our undistributed taxable income. In addition, we will be subject to a 4% nondeductible excise tax on our undistributed taxable income if the actual amount that we distribute to our stockholders for a calendar year is less than the minimum amount specified under the Code.
We may be required to borrow funds, sell assets or raise equity to satisfy our REIT distribution requirements.
Due to the size and timing of future distributions, including any distributions made to satisfy REIT distribution requirements, we may need to borrow funds, sell assets or raise equity, even if the then-prevailing market conditions are not favorable for these borrowings, sales or offerings.
Any insufficiency of our cash flows to cover our REIT distribution requirements could adversely impact our ability to raise short- and long-term debt, to sell assets, or to offer equity securities in order to fund distributions required to maintain our qualification and taxation as a REIT. Furthermore, the REIT distribution requirements may increase the financing we need to fund capital expenditures, future growth and expansion initiatives. This would increase our indebtedness. A significant increase in our outstanding debt could lead to a downgrade of our credit rating. A downgrade of our credit rating could negatively impact our ability to access credit markets. Further, certain of our current debt instruments limit the amount of indebtedness we and our subsidiaries may incur. Significantly more financing, therefore, may be unavailable, more expensive or restricted by the terms of our outstanding indebtedness. For a discussion of risks related to our substantial level of indebtedness, see other risks described elsewhere in this Quarterly Report on Form 10-Q.
Whether we issue equity, at what price and the amount and other terms of any such issuances will depend on many factors, including alternative sources of capital, our then-existing leverage, our need for additional capital, market conditions and other factors beyond our control. If we raise additional funds through the issuance of equity securities or debt convertible into equity securities, the percentage of stock ownership by our existing stockholders may be reduced. In addition, new equity securities or convertible debt securities could have rights, preferences and privileges senior to those of our current stockholders, which could substantially decrease the value of our securities owned by them. Depending on the share price we are able to obtain, we may have to sell a significant number of shares in order to raise the capital we deem necessary to execute our long-term strategy, and our stockholders may experience dilution in the value of their shares as a result.
Complying with REIT requirements may limit our flexibility or cause us to forgo otherwise attractive opportunities.
To remain qualified for taxation as a REIT for U.S. federal income tax purposes, we must satisfy tests concerning, among other things, the sources of our income, the nature and diversification of our assets and the amounts we distribute to our stockholders. For example, under the Code, no more than 20% of the value of the assets of a REIT may be represented by securities of one or more TRSs. Similar rules apply to other nonqualifying assets. These limitations may affect our ability to make large investments in other non-REIT qualifying operations or assets. In addition, in order to maintain our qualification for taxation as a REIT, we must distribute at least 90% of our REIT taxable income, determined without regard to the dividends paid deduction and excluding any net capital gains. Even if we maintain our qualification for taxation as a REIT, we will be subject to U.S. federal income tax at regular corporate income tax rates for our undistributed REIT taxable income, as well as U.S. federal income tax at regular corporate income tax rates for income recognized by our TRSs; we also pay taxes in the foreign jurisdictions in which our international assets and operations are held and conducted regardless of our qualification for taxation as a REIT. Because of these distribution requirements, we will likely not be able to fund future capital needs and investments from operating cash flow. As such, compliance with REIT tests may hinder our ability to make certain attractive investments, including the purchase of significant nonqualifying assets and the material expansion of non-real estate activities.
Our ability to fully deduct our interest expense may be limited, or we may be required to adjust the tax depreciation of our real property in order to maintain the full deductibility of our interest expense.
The Code limits interest deductions for businesses, whether in corporate or passthrough form, to the sum of the taxpayer's business interest income for the tax year and 30% of the taxpayer's adjusted taxable income for that tax year. This limitation does not apply to an "electing real property trade or business". Although REITs are permitted to make such an election, we do not currently intend to do so. If we so elect in the future, depreciable real property that we hold (including specified improvements) would be required to be depreciated for U.S. federal income tax purposes under the alternative depreciation system of the Code, which generally imposes a class life for depreciable real property as long as 40 years.
As a REIT, we are limited in our ability to fund distribution payments using cash generated through our TRSs.
Our ability to receive distributions from our TRSs is limited by the rules with which we must comply to maintain our qualification for taxation as a REIT. In particular, at least 75% of our gross income for each taxable year as a REIT must be derived from real estate. Consequently, no more than 25% of our gross income may consist of dividend income from our TRSs and other nonqualifying types of income. Thus, our ability to receive distributions from our TRSs may be limited and may impact our ability to fund distributions to our stockholders using cash flows from our TRSs. Specifically, if our TRSs become highly profitable, we might become limited in our ability to receive net income from our TRSs in an amount required to fund distributions to our stockholders commensurate with that profitability.
In addition, a significant amount of our income and cash flows from our TRSs is generated from our international operations. In many cases, there are local withholding taxes and currency controls that may impact our ability or willingness to repatriate funds to the United States to help satisfy REIT distribution requirements.
Our extensive use of TRSs, including for certain of our international operations, may cause us to fail to remain qualified for taxation as a REIT.
Our operations include an extensive use of TRSs. The net income of our TRSs is not required to be distributed to us, and income that is not distributed to us generally is not subject to the REIT income distribution requirement. However, there may be limitations on our ability to accumulate earnings in our TRSs and the accumulation or reinvestment of significant earnings in our TRSs could result in adverse tax treatment. In particular, if the accumulation of cash in our TRSs causes (1) the fair market value of our securities in our TRSs to exceed 20% of the fair market value of our assets or (2) the fair market value of our securities in our TRSs and other nonqualifying assets to exceed 25% of the fair market value of our assets, then we will fail to remain qualified for taxation as a REIT. Further, a substantial portion of our TRSs are overseas, and a material change in foreign currency rates could also negatively impact our ability to remain qualified for taxation as a REIT.
The Code imposes limitations on the ability of our TRSs to utilize specified income tax deductions, including limits on the use of net operating losses and limits on the deductibility of interest expense.
Our cash distributions are not guaranteed and may fluctuate.
A REIT generally is required to distribute at least 90% of its REIT taxable income to its stockholders.
Our Board of Directors, in its sole discretion, will determine on a quarterly basis the amount of cash to be distributed to our stockholders based on a number of factors including, but not limited to, our results of operations, cash flow and capital requirements, economic conditions, tax considerations, borrowing capacity and other factors, including debt covenant restrictions that may impose limitations on cash payments, future acquisitions and divestitures and any stock repurchase program. Consequently, our distribution levels may fluctuate.
Even if we remain qualified for taxation as a REIT, some of our business activities are subject to corporate level income tax and foreign taxes, which will continue to reduce our cash flows, and we will have potential deferred and contingent tax liabilities.
Even if we remain qualified for taxation as a REIT, we may be subject to some federal, state, local and foreign taxes, including taxes on any undistributed income, and state, local or foreign income, franchise, property and transfer taxes. In addition, we could in certain circumstances be required to pay an excise or penalty tax, which could be significant in amount, in respect of dealer property income or in order to utilize one or more relief provisions under the Code to maintain our qualification for taxation as a REIT.
A portion of our business is conducted through wholly-owned TRSs because certain of our business activities could generate nonqualifying REIT income as currently structured and operated. The income of our U.S. TRSs will continue to be subject to federal and state corporate income taxes. In addition, our international assets and operations will continue to be subject to taxation in the foreign jurisdictions where those assets are held or those operations are conducted. Any of these taxes would decrease our earnings and our available cash.
We will also be subject to a U.S. federal corporate level income tax at the highest regular corporate income tax rate (currently 21%) on gain recognized from a sale of a REIT asset where our basis in the asset is determined by reference to the basis of the asset in the hands of a C corporation (such as an asset that we or our QRSs hold following the liquidation or other conversion of a former TRS). This 21% tax is generally applicable to any disposition of such an asset during the five-year period after the date we first owned the asset as a REIT asset, to the extent of the built-in-gain based on the fair market value of such asset on the date we first held the asset as a REIT asset.
Complying with REIT requirements may limit our ability to hedge effectively and increase the cost of our hedging and may cause us to incur tax liabilities.
The REIT provisions of the Code limit our ability to hedge assets, liabilities, revenues and expenses. Generally, income from hedging transactions that we enter into to manage risk of interest rate changes or fluctuations with respect to borrowings made or to be made by us to acquire or carry real estate assets and income from certain currency hedging transactions related to our non-U.S. operations, as well as income from qualifying counteracting hedges, do not constitute "gross income" for purposes of the REIT gross income tests. To the extent that we enter into other types of hedging transactions, the income from those transactions may be treated as nonqualifying income for purposes of the REIT gross income tests. As a result of these rules, we have from time to time limited our use of advantageous hedging techniques or implemented those hedges through our TRSs, and our future hedging strategies may continue to be so affected. This increases the cost of our hedging activities because our TRSs are subject to tax on income or gains resulting from hedges entered into by them and may expose us to greater risks associated with changes in interest rates or exchange rates than we would otherwise want to bear. In addition, hedging losses in any of our TRSs may not provide any tax benefit, except for being carried forward for possible use against future income or gain in the TRSs. As a result, our financial performance, including our AFFO, may also fluctuate.
Distributions payable by REITs generally do not qualify for preferential tax rates.
Dividends payable by U.S. corporations to noncorporate stockholders, such as individuals, trusts and estates, are generally eligible for reduced U.S. federal income tax rates applicable to "qualified dividends." Distributions paid by REITs generally are not treated as "qualified dividends" under the Code, and the reduced rates applicable to such dividends do not generally apply. However, for tax years beginning before 2026, REIT dividends paid to noncorporate stockholders that meet specified holding period requirements are generally taxed at an effective tax rate lower than applicable ordinary income tax rates due to the availability of a deduction under the Code for specified forms of income from passthrough entities. More favorable rates will nevertheless continue to apply to regular corporate "qualified" dividends, which may cause some investors to perceive that an investment in a REIT is less attractive than an investment in a non-REIT entity that pays dividends, thereby reducing the demand and market price of our common stock.
Our certificate of incorporation contains restrictions on the ownership and transfer of our stock, though they may not be successful in preserving our qualification for taxation as a REIT.
In order for us to remain qualified for taxation as a REIT, no more than 50% of the value of outstanding shares of our stock may be owned, beneficially or constructively, by five or fewer individuals at any time during the last half of each taxable year. In addition, rents from "affiliated tenants" will not qualify as qualifying REIT income if we own 10% or more by vote or value of the customer, whether directly or after application of attribution rules under the Code. Subject to certain exceptions, our certificate of incorporation prohibits any stockholder from owning, beneficially or constructively, more than (i) 9.8% in value of the outstanding shares of all classes or series of our capital stock or (ii) 9.8% in value or number, whichever is more restrictive, of the outstanding shares of any class or series of our capital stock. We refer to these restrictions collectively as the "ownership limits" and we included them in our certificate of incorporation to facilitate our compliance with REIT tax rules. The constructive ownership rules under the Code are complex and may cause the outstanding stock owned by a group of related individuals or entities to be deemed to be constructively owned by one individual or entity. As a result, the acquisition of less than 9.8% of our outstanding common stock (or the outstanding shares of any class or series of our stock) by an individual or entity could cause that individual or entity or another individual or entity to own constructively in excess of the relevant ownership limits. Any attempt to own or transfer shares of our common stock or of any of our other capital stock in violation of these restrictions may result in the shares being automatically transferred to a charitable trust or may be void. Even though our certificate of incorporation contains the ownership limits, there can be no assurance that these provisions will be effective to prevent our qualification for taxation as a REIT from being jeopardized, including under the affiliated tenant rule. Furthermore, there can be no assurance that we will be able to monitor and enforce the ownership limits. If the restrictions in our certificate of incorporation are not effective and, as a result, we fail to satisfy the REIT tax rules described above, then absent an applicable relief provision, we will fail to remain qualified for taxation as a REIT.
In addition, the ownership and transfer restrictions could delay, defer or prevent a transaction or a change in control that might involve a premium price for our stock or otherwise be in the best interest of our stockholders. As a result, the overall effect of the ownership and transfer restrictions may be to render more difficult or discourage any attempt to acquire us, even if such acquisition may be favorable to the interests of our stockholders.
Legislative or other actions affecting REITs could have a negative effect on us or our stockholders.
At any time, U.S. federal or state income tax laws governing REITs, or the administrative interpretations of those laws, may be amended. U.S. federal and state tax laws are constantly under review by persons involved in the legislative process, the Internal Revenue Service, the U.S. Department of the Treasury and state taxing authorities. Changes to the tax laws, regulations and administrative interpretations, which may have retroactive application, could adversely affect us. In addition, some of these changes could have a more significant impact on us as compared to other REITs due to the nature of our business and our substantial use of TRSs, particularly non-U.S. TRSs.
We could incur adverse tax consequences if we fail to integrate an acquisition target in compliance with the requirements to qualify for taxation as a REIT.
We periodically explore and occasionally consummate merger and acquisition transactions. When we consummate these transactions, we structure the acquisition to successfully manage the REIT income, asset, and distribution tests that we must satisfy. We believe that we have and will in the future successfully integrate our acquisition targets in a manner that has and will allow us to timely satisfy the REIT tests applicable to us, but if we failed or in the future fail to do so, then we could jeopardize or lose our qualification for taxation as a REIT, particularly if we were not eligible to utilize relief provisions set forth in the Code.
General Risk Factors
Adverse global economic conditions, like the ones we are currently experiencing during the COVID-19 pandemic, could adversely impact our business and financial condition.
Adverse global economic conditions like the ones we recently experienced because of the ongoing COVID-19 pandemic and uncertain conditions in the credit markets have created, and in the future may increase risk to our financial outlook. The uncertain global economy could also result in material churn in our customer base, reductions in revenues from our offerings, adverse effects to our DSO, longer sales cycles, slower adoption of new technologies and increased price competition, which could adversely affect our liquidity. Customers and vendors filing for bankruptcy could also lead to costly and time-intensive actions with adverse effects, including greater difficulty or delay in accounts receivable collection. The uncertain economic environment could also have an impact on our foreign exchange forward contracts if our counterparties' credit deteriorates or if they are otherwise unable to perform their obligations. Finally, volatility in the financial markets like we are currently experiencing could affect our ability to access the capital markets at a time when we desire, or need, to do so which could have an impact on our flexibility to pursue additional expansion opportunities and maintain our desired level of revenue growth in the future.
The market price of our stock may continue to be highly volatile, and the value of an investment in our common stock may decline.
The market price of the shares of our common stock has recently been and may continue to be highly volatile. General economic and market conditions, like the instability due to the ongoing COVID-19 pandemic, and market conditions for telecommunications and real estate investment trust stocks in general, may affect the market price of our common stock.
Announcements by us or others, or speculations about our future plans, may also have a significant impact on the market price of our common stock. These may relate to:
•news or regulations regarding the ongoing COVID-19 pandemic;
•our results of operations or forecasts;
•new issuances of equity, debt or convertible debt by us, including issuances through our 2020 ATM Program;
•increases in market interest rates and changes in other general market and economic conditions, including inflationary concerns;
•changes to our capital allocation, tax planning or business strategy;
•our qualification for taxation as a REIT and our declaration of distributions to our stockholders;
•changes in U.S. or foreign tax laws;
•changes in management or key personnel;
•developments in our relationships with customers;
•announcements by our customers or competitors;
•changes in regulatory policy or interpretation;
•governmental investigations;
•changes in the ratings of our debt or stock by rating agencies or securities analysts;
•our purchase or development of real estate and/or additional IBX data centers;
•our acquisitions of complementary businesses; or
•the operational performance of our IBX data centers.
The stock market has from time to time experienced extreme price and volume fluctuations, which have particularly affected the market prices for telecommunications companies, and which have often been unrelated to their operating performance. These broad market fluctuations may adversely affect the market price of our common stock. One of the factors that investors may consider in deciding whether to buy or sell our common stock is our distribution rate as a percentage of our stock price relative to market interest rates. If market interest rates increase, prospective investors may demand a higher distribution rate or seek alternative investments paying higher dividends or interest. As a result, interest rate fluctuations and conditions in the capital markets may affect the market value of our common stock. Furthermore, companies that have experienced volatility in the market price of their stock have been subject to securities class action litigation. We may be the target of this type of litigation in the future. Securities litigation against us could result in substantial costs and/or damages, and divert management's attention from other business concerns, which could seriously harm our business.
Inadequate or inaccurate external and internal information, including budget and planning data, could lead to inaccurate financial forecasts and inappropriate financial decisions.
Our financial forecasts are dependent on estimates and assumptions regarding budget and planning data, market growth, foreign exchange rates, our ability to remain qualified for taxation as a REIT, and our ability to generate sufficient cash flow to reinvest in the business, fund internal growth, make acquisitions, pay dividends and meet our debt obligations. Our financial projections are based on historical experience and on various other assumptions that our management believes to be reasonable under the circumstances and at the time they are made.
The ongoing COVID-19 pandemic is expected to have a material effect on many aspects of the economy, but the extent of its impact on Equinix is difficult to predict at this time. We continue to evolve our forecasting models as the situation unfolds but if our predictions are inaccurate and our results differ materially from our forecasts, we could make inappropriate financial decisions. Additionally, inaccuracies in our models could adversely impact our compliance with REIT asset tests, future profitability, stock price and/or stockholder confidence.
If our internal controls are found to be ineffective, our financial results or our stock price may be adversely affected.
Our most recent evaluation of our controls resulted in our conclusion that, as of December 31, 2020, in compliance with Section 404 of the Sarbanes-Oxley Act of 2002, our internal controls over financial reporting were effective. Our ability to manage our operations and growth through, for example, the integration of recently acquired businesses, the adoption of new accounting principles and tax laws, and our overhaul of our back office systems that, for example, support the customer experience from initial quote to customer billing and our revenue recognition process, will require us to further develop our controls and reporting systems and implement or amend new or existing controls and reporting systems in those areas where the implementation and integration is still ongoing. All of these changes to our financial systems and the implementation and integration of acquisitions create an increased risk of deficiencies in our internal controls over financial reporting. If, in the future, our internal control over financial reporting is found to be ineffective, or if a material weakness is identified in our controls over financial reporting, our financial results may be adversely affected. Investors may also lose confidence in the reliability of our financial statements which could adversely affect our stock price.
We may be subject to securities class action and other litigation, which may harm our business and results of operations.
We may be subject to securities class action or other litigation. For example, securities class action litigation has often been brought against a company following periods of volatility in the market price of its securities. Litigation can be lengthy, expensive, and divert management's attention and resources. Results cannot be predicted with certainty and an adverse outcome in litigation could result in monetary damages or injunctive relief. Further, any payments made in settlement may directly reduce our revenue under U.S. GAAP and could negatively impact our results of operations for the period. For all of these reasons, litigation could seriously harm our business, results of operations, financial condition or cash flows.
We may not be able to protect our intellectual property rights.
We cannot make assurances that the steps taken by us to protect our intellectual property rights will be adequate to deter misappropriation of proprietary information or that we will be able to detect unauthorized use and take appropriate steps to enforce our intellectual property rights. We also are subject to the risk of litigation alleging infringement of third-party intellectual property rights. Any such claims could require us to spend significant sums in litigation, pay damages, develop non-infringing intellectual property or acquire licenses to the intellectual property that is the subject of the alleged infringement.
We have various mechanisms in place that may discourage takeover attempts.
Certain provisions of our certificate of incorporation and bylaws may discourage, delay or prevent a third party from acquiring control of us in a merger, acquisition or similar transaction that a stockholder may consider favorable. Such provisions include:
•ownership limitations and transfer restrictions relating to our stock that are intended to facilitate our compliance with certain REIT rules relating to share ownership;
•authorization for the issuance of "blank check" preferred stock;
•the prohibition of cumulative voting in the election of directors;
•limits on the persons who may call special meetings of stockholders;
•limits on stockholder action by written consent; and
•advance notice requirements for nominations to the Board of Directors or for proposing matters that can be acted on by stockholders at stockholder meetings.
In addition, Section 203 of the Delaware General Corporation Law, which restricts certain business combinations with interested stockholders in certain situations, may also discourage, delay or prevent someone from acquiring or merging with us.
| | | | | |
| Item 2. | Unregistered Sales of Equity Securities and Use of Proceeds |
None.
| | | | | |
| Item 3. | Defaults Upon Senior Securities |
None.
| | | | | |
| Item 4. | Mine Safety Disclosure |
Not applicable.
None.
| | | | | | | | | | | | | | | | | | | | | | | | | | | | | | | | |
| | | | Incorporated by Reference | | |
| Exhibit Number | | Exhibit Description | | Form | | Filing Date/
Period End Date | | Exhibit | | Filed
Herewith |
| | | | | | | | | | |
| | | | 8-K | | 5/29/2015 | | 2.1 | | |
| | | | | | | | | | |
| | | | 8-K | | 5/29/2015 | | 2.2 | | |
| | | | | | | | | | |
| | | | 10-K | | 12/31/2015 | | 2.3 | | |
| | | | | | | | | | |
| | | | 8-K | | 12/6/2016 | | 2.1 | | |
| | | | | | | | | | |
| | | | 10-K | | 12/31/2016 | | 2.5 | | |
| | | | | | | | | | |
| | | | 8-K | | 5/1/2017 | | 2.1 | | |
| | | | | | | | | | |
| | | | 10-Q | | 8/8/2018 | | 2.7 | | |
| | | | | | | | | | |
| | | | 10-K/A | | 12/31/2002 | | 3.1 | | |
| | | | | | | | | | |
| | | | 8-K | | 6/14/2011 | | 3.1 | | |
| | | | | | | | | | |
| | | | 8-K | | 6/11/2013 | | 3.1 | | |
| | | | | | | | | | |
| | | | 10-Q | | 6/30/2014 | | 3.4 | | |
| | | | | | | | | | |
| | | | 10-K/A | | 12/31/2002 | | 3.3 | | |
| | | | | | | | | | |
| | | | 8-K | | 3/29/2016 | | 3.1 | | |
| | | | | | | | | | |
| 4.1 | | Reference is made to Exhibits 3.1, 3.2, 3.3, 3.4, 3.5 and 3.6. | | | | | | | | |
| | | | | | | | | | |
| | | | 8-K | | 11/20/2014 | | 4.1 | | |
| | | | | | | | | | |
| | | | 8-K | | 3/22/2017 | | 4.2 | | |
| | | | | | | | | | |
| | | | | | | | | | | | | | | | | | | | | | | | | | | | | | | | |
| 4.4 | | Form of 5.375% Senior Notes due 2027 (see Exhibit 4.3). | | | | | | | | |
| | | | | | | | | | |
| | | | 8-K | | 9/20/2017 | | 4.2 | | |
| | | | | | | | | | |
| | | | 8-K | | 12/5/2017 | | 4.1 | | |
| | | | | | | | | | |
| | | | 8-K | | 4/3/2018 | | 4.2 | | |
| | | | | | | | | | |
| 4.8 | | Form of 5.00% Senior Notes due October 2020 (see Exhibit 4.7). | | | | | | | | |
| | | | | | | | | | |
| 4.9 | | Form of 5.00% Senior Notes due April 2021 (see Exhibit 4.7). | | | | | | | | |
| | | | | | | | | | |
| | | | 8-K | | 11/18/2019 | | 4.2 | | |
| | | | | | | | | | |
| 4.11 | | Form of 2.625% Senior Notes due 2024 (See Exhibit 4.10). | | | | | | | | |
| | | | | | | | | | |
| | | | 8-K | | 11/18/2019 | | 4.4 | | |
| | | | | | | | | | |
| 4.13 | | Form of 2.900% Senior Notes due 2026 (See Exhibit 4.12). | | | | | | | | |
| | | | | | | | | | |
| | | | 8-K | | 11/18/2019 | | 4.6 | | |
| | | | | | | | | | |
| 4.15 | | Form of 3.200% Senior Notes due 2029 (See Exhibit 4.14) | | 8-K | | 6/22/2020 | | | | |
| | | | | | | | | | |
| | | | 8-K | | 6/22/2020 | | 4.2 | | |
| | | | | | | | | | |
| 4.17 | | Form of 1.250% Senior Note due 2025 (See Exhibit 4.16) | | 8-K | | 6/22/2020 | | 4.3 | | |
| | | | | | | | | | |
| | | | 8-K | | 6/22/2020 | | 4.4 | | |
| | | | | | | | | | |
| 4.19 | | Form of 1.800% Senior Note due 2027 (See Exhibit 4.18) | | 8-K | | 6/22/2020 | | 4.5 | | |
| | | | | | | | | | |
| | | | 8-K | | 6/22/2020 | | 4.6 | | |
| | | | | | | | | | |
| 4.21 | | Form of 2.150% Senior Note due 2030 (see Exhibit 4.20) | | 8-K | | 6/22/2020 | | 4.7 | | |
| | | | | | | | | | |
| | | | 8-K | | 6/22/2020 | | 4.8 | | |
| | | | | | | | | | |
| 4.23 | | Form of 3.000% Senior Note due 2050 (See Exhibit 4.22) | | 8-K | | 6/22/2020 | | 4.9 | | |
| | | | | | | | | | |
| | | | | | | | | | | | | | | | | | | | | | | | | | | | | | | | |
| | | | 8-K | | 10/7/2020 | | 4.2 | | |
| | | | | | | | | | |
| 4.25 | | Form of 1.000% Senior Note due 2025 (included in Exhibit 4.24) | | 8-K | | 10/7/2020 | | 4.3 | | |
| | | | | | | | | | |
| | | | 8-K | | 10/7/2020 | | 4.4 | | |
| | | | | | | | | | |
| 4.27 | | Form of 1.550% Senior Note due 2028 (included in Exhibit 4.26) | | 8-K | | 10/7/2020 | | 4.5 | | |
| | | | | | | | | | |
| | | | 8-K | | 10/7/2020 | | 4.6 | | |
| | | | | | | | | | |
| 4.29 | | Form of 2.950% Senior Note due 2051 (included in Exhibit 4.28) | | 8-K | | 10/7/2020 | | 4.7 | | |
| | | | | | | | | | |
| | | | 8-K | | 3/11/2021 | | 4.2 | | |
| | | | | | | | | | |
| 4.31 | | Form of 0.250% Senior Note due 2027 (included in Exhibit 4.30) | | 8-K | | 3/11/2021 | | 4.3 | | |
| | | | | | | | | | |
| | | | 8-K | | 3/11/2021 | | 4.4 | | |
| | | | | | | | | | |
| 4.33 | | Form of 1.000% Senior Note due 2033 (included in Exhibit 4.32) | | 8-K | | 3/11/2021 | | 4.5 | | |
| | | | | | | | | | |
| | | | 8-K | | 5/17/2021 | | 4.2 | | |
| | | | | | | | | | |
| 4.35 | | Form of 1.450% Senior Note due 2026 (included in Exhibit 4.34)Form of 1.450% Senior Note due 2026 (included in Exhibit 4.34) | | 8-K | | 5/17/2021 | | 4.3 | | |
| | | | | | | | | | |
| | | | 8-K | | 5/17/2021 | | 4.4 | | |
| | | | | | | | | | |
| 4.37 | | Form of 2.000% Senior Note due 2028 (included in Exhibit 4.36) | | 8-K | | 5/17/2021 | | 4.5 | | |
| | | | | | | | | | |
| | | | 8-K | | 5/17/2021 | | 4.6 | | |
| | | | | | | | | | |
| 4.39 | | Form of 2.500% Senior Note due 2031 (included in Exhibit 4.38) | | 8-K | | 5/17/2021 | | 4.7 | | |
| | | | | | | | | | |
| | | | 8-K | | 5/17/2021 | | 4.8 | | |
| | | | | | | | | | |
| 4.41 | | Form of 3.400% Senior Note due 2052 (included in Exhibit 4.40) | | 8-K | | 5/17/2021 | | 4.9 | | |
| | | | | | | | | | |
| | | | 10-K | | 12/31/2014 | | 4.13 | | |
| | | | | | | | | | |
| | | | S-4 (File No. 333-93749) | | 12/29/1999 | | 10.5 | | |
| | | | | | | | | | |
| | | | | | | | | | | | | | | | | | | | | | | | | | | | | | | | |
| | | | 10-K | | 12/31/2016 | | 10.2 | | |
| | | | | | | | | | |
| |
| | DEF14A | | 4/27/2020 | | Appendix A | | |
| | | | | | | | | | |
| | | | 10-Q | | 6/30/2014 | | 10.5 | | |
| | | | | | | | | | |
| | | | 10-Q | | 3/31/2019 | | 10.29 | | |
| | | | | | | | | | |
| | | | 10-Q | | 3/31/2019 | | 10.30 | | |
| | | | | | | | | | |
| | | | 10-Q | | 3/31/2019 | | 10.31 | | |
| | | | | | | | | | |
| | | | 10-Q | | 3/31/2020 | | 10.19 | | |
| | | | | | | | | | |
| | | | 10-Q | | 3/31/2020 | | 10.20 | | |
| | | | | | | | | | |
| | | | 10-Q | | 3/31/2020 | | 10.21 | | |
| | | | | | | | | | |
| | | | 10-Q | | 3/31/2021 | | 10.11 | | |
| | | | | | | | | | |
| | | | 10-Q | | 3/31/2021 | | 10.12 | | |
| | | | | | | | | | |
| | | | 10-Q | | 3/31/2021 | | 10.13 | | |
| | | | | | | | | | |
| | | | 10-Q | | 3/31/2021 | | 10.14 | | |
| | | | | | | | | | |
| | | | 10-Q | | 9/30/2014 | | 10.67 | | |
| | | | | | | | | | |
| | | | 10-Q | | 6/30/2016 | | 10.55 | | |
| | | | | | | | | | |
| | | | | | | | | | | | | | | | | | | | | | | | | | | | | | | | |
| | Credit Agreement dated as of December 12, 2017 among Equinix, Inc. as Borrower, The Guarantors Parties (defined therein), Bank of America, N.A., as Administrative Agent, Lender and L/C issuer, Barclays Bank PLS, Goldman Sachs Bank USA, HSBC Securities (USA) Inc. ING Capital LLC, TD Securities (USA) LLC, and Wells Fargo Bank, National Association as Co-Documentation Agents, the Other Lenders Party (defined therein) and Bank of America, N.A., Citibank, N.A., JPMorgan Chase Bank, N.A., MUFG, and RBC Capital Markets as Joint Lead Arrangers and Joint Book Runners. | | 10-K | | 12/31/2017 | | 10.40 | | |
| | | | | | | | | | |
| | | | 10-Q | | 8/8/2018 | | 10.35 | | |
| | | | | | | | | | |
| | Second Amendment to Credit Agreement, dated as of July 26, 2018, by and between Equinix, Inc. as Borrower, the financial institutions defined therein, MUFG Bank, Ltd., as Technical Agent and Bank of America, N.A. as Administrative Agent, under that certain Credit Agreement dated December 12, 2017. | | 10-Q | | 8/8/2018 | | 10.36 | | |
| | | | | | | | | | |
| | Third Amendment to Credit Agreement, dated as of April 26, 2019, by and among Equinix, Inc., Delaware corporation ("Equinix" or the "Borrower"), each "Lender" (as such term is defined in the Credit Agreement referred to therein) party hereto, and BANK OF AMERICA, N.A., as Administrative Agent, under that certain Credit Agreement dated December 12, 2017. | | 10-Q | | 6/30/2019 | | 10.34 | | |
| | | | | | | | | | |
| | Credit Agreement dated April 15, 2020, by and among Equinix, as borrower, a syndicate of financial institutions, as lenders, MUFG Bank, Ltd.as administrative agent, and MUFG Union Bank, N.A., Sumitomo, Mitsui Banking Corporation, TD Securities (USA) LLC and Mizuho Bank, Ltd., as joint lead arrangers. | | 10-Q | | 6/30/2020 | | 10.25 | |
|
| | | | | | | | | | |
| | | | 10-K | | 2/22/2019 | | 10.37 | | |
| | | | | | | | | | |
| | | | 10-Q | | 9/30/2019 | | 10.25 | | |
| | | | | | | | | | |
| | | | 10-Q | | 9/30/2019 | | 10.26 | | |
| | | | | | | | | | |
| | | | 10-Q | | 9/30/2019 | | 10.27 | | |
| | | | | | | | | | |
| | | | 10-Q | | 9/30/2019 | | 10.28 | | |
| | | | | | | | | | |
| | | | | | | | | | | | | | | | | | | | | | | | | | | | | | | | |
| | | | 10-Q | | 9/30/2019 | | 10.29 | | |
| | | | | | | | | | |
| | | | 10-Q | | 9/30/2019 | | 10.31 | | |
| | | | | | | | | | |
| | | | 10-Q | | 9/30/2019 | | 10.32 | | |
| | | | | | | | | | |
| | | | 10-Q | | 9/30/2019 | | 10.33 | | |
| | | | | | | | | | |
| | | | 10-Q | | 9/30/2019 | | 10.34 | | |
| | | | | | | | | | |
| | | | 10-Q | | 9/30/2019 | | 10.36 | | |
| | | | | | | | | | |
| | | | 10-Q | | 9/30/2019 | | 10.37 | | |
| | | | | | | | | | |
| | | | 10-Q | | 9/30/2019 | | 10.38 | | |
| | | | | | | | | | |
| | | | 10-Q | | 9/30/2019 | | 10.39 | | |
| | | | | | | | | | |
| | | | 10-Q | | 9/30/2019 | | 10.40 | | |
| | | | | | | | | | |
| | | | | | | | | | X |
| | | | | | | | | | |
| | | | | | | | | | X |
| | | | | | | | | | |
| | | | | | | | | | X |
| | | | | | | | | | |
| | | | | | | | | | X |
| | | | | | | | | | |
| | | | | | | | | | X |
| | | | | | | | | | |
| 101.INS | | XBRL Instance Document - the instance document does not appear in the Interactive Data File because its XBRL tags are embedded within the Inline XBRL document. | | | | | | | | X |
| | | | | | | | | | |
| 101.SCH | | Inline XBRL Taxonomy Extension Schema Document. | | | | | | | | X |
| | | | | | | | | | |
| 101.CAL | | Inline XBRL Taxonomy Extension Calculation Linkbase Document. | | | | | | | | X |
| | | | | | | | | | |
| 101.DEF | | Inline XBRL Taxonomy Extension Definition Linkbase Document. | | | | | | | | X |
| | | | | | | | | | |
| | | | | | | | | | | | | | | | | | | | | | | | | | | | | | | | |
| 101.LAB | | Inline XBRL Taxonomy Extension Label Linkbase Document. | | | | | | | | X |
| | | | | | | | | | |
| 101.PRE | | Inline XBRL Taxonomy Extension Presentation Linkbase Document. | | | | | | | | X |
| | | | | | | | | | |
| 104 | | Cover Page Interactive Data File - the cover page interactive data file does not appear in the Interactive Data File because its XBRL tags are embedded within the Inline XBRL document. | | | | | | | | X |
** Management contracts or compensation plans or arrangements in which directors or executive officers are eligible to participate.
EQUINIX, INC.
SIGNATURES
Pursuant to the requirements of the Securities Exchange Act of 1934, the Registrant has duly caused this report to be signed on its behalf by the undersigned thereunto duly authorized.
| | | | | | | | |
| EQUINIX, INC. |
| Date: July 30, 2021 | | |
| By: | /s/ KEITH D. TAYLOR |
| | Chief Financial Officer |
| | (Principal Financial Officer) |
INDEX TO EXHIBITS
| | | | | | | | | | | | | | | |
Exhibit
Number | | Description of Document | | | | | | | |
| | | | | | | | | |
| | | | | | | | | |
| | | | | | | | | |
| | | | | | | | | |
| | | | | | | | | |
| | | | | | | | | |
| | | | | | | | | |
| | | | | | | | | |
| | | | | | | | | |
| | | | | | | | | |
| | | | | | | | | |
| | | | | | | | | |
| 101.INS | | XBRL Instance Document - the instance document does not appear in the Interactive Data File because its XBRL tags are embedded within the Inline XBRL document. | | | | | | | |
| | | | | | | | | |
| 101.SCH | | Inline XBRL Taxonomy Extension Schema Document. | | | | | | | |
| | | | | | | | | |
| 101.CAL | | Inline XBRL Taxonomy Extension Calculation Document. | | | | | | | |
| | | | | | | | | |
| 101.DEF | | Inline XBRL Taxonomy Extension Definition Document. | | | | | | | |
| | | | | | | | | |
| 101.LAB | | Inline XBRL Taxonomy Extension Labels Document. | | | | | | | |
| | | | | | | | | |
| 101. PRE | | Inline XBRL Taxonomy Extension Presentation Document. | | | | | | | |
| | | | | | | | | |
| 104 | | Cover Page Interactive Data File - the cover page interactive data file does not appear in the Interactive Data File because its XBRL tags are embedded within the Inline XBRL document. | | | | | | | |