false2022FY0001101239truetrueP2YP1Y303http://fasb.org/us-gaap/2022#RevenueFromContractWithCustomerExcludingAssessedTaxhttp://fasb.org/us-gaap/2022#PropertyPlantAndEquipmentNethttp://fasb.org/us-gaap/2022#PropertyPlantAndEquipmentNet00011012392022-01-012022-12-310001101239us-gaap:CommonClassAMember2022-01-012022-12-310001101239eqix:ZeroPointTwoFiveZeroSeniorNotesDueTwoThousandTwentySevenMember2022-01-012022-12-310001101239eqix:OnePointZeroZeroZeroSeniorNotesDueTwoThousandThirtyThreeMember2022-01-012022-12-3100011012392022-06-30iso4217:USD00011012392023-02-16xbrli:shares00011012392022-12-3100011012392021-12-31iso4217:USDxbrli:shares00011012392021-01-012021-12-3100011012392020-01-012020-12-310001101239us-gaap:CommonStockMember2019-12-310001101239us-gaap:TreasuryStockCommonMember2019-12-310001101239us-gaap:AdditionalPaidInCapitalMember2019-12-310001101239us-gaap:AccumulatedDistributionsInExcessOfNetIncomeMember2019-12-310001101239us-gaap:AccumulatedOtherComprehensiveIncomeMember2019-12-310001101239us-gaap:RetainedEarningsMember2019-12-310001101239us-gaap:ParentMember2019-12-310001101239us-gaap:NoncontrollingInterestMember2019-12-3100011012392019-12-310001101239srt:CumulativeEffectPeriodOfAdoptionAdjustmentMemberus-gaap:RetainedEarningsMember2019-12-310001101239us-gaap:ParentMembersrt:CumulativeEffectPeriodOfAdoptionAdjustmentMember2019-12-310001101239srt:CumulativeEffectPeriodOfAdoptionAdjustmentMember2019-12-310001101239us-gaap:RetainedEarningsMember2020-01-012020-12-310001101239us-gaap:ParentMember2020-01-012020-12-310001101239us-gaap:NoncontrollingInterestMember2020-01-012020-12-310001101239us-gaap:AccumulatedOtherComprehensiveIncomeMember2020-01-012020-12-310001101239us-gaap:CommonStockMember2020-01-012020-12-310001101239us-gaap:TreasuryStockCommonMember2020-01-012020-12-310001101239us-gaap:AdditionalPaidInCapitalMember2020-01-012020-12-310001101239eqix:PublicOfferingMemberus-gaap:CommonStockMember2020-01-012020-12-310001101239eqix:PublicOfferingMemberus-gaap:AdditionalPaidInCapitalMember2020-01-012020-12-310001101239eqix:PublicOfferingMemberus-gaap:ParentMember2020-01-012020-12-310001101239eqix:PublicOfferingMember2020-01-012020-12-310001101239us-gaap:CommonStockMembereqix:ATMProgramMember2020-01-012020-12-310001101239eqix:ATMProgramMemberus-gaap:AdditionalPaidInCapitalMember2020-01-012020-12-310001101239us-gaap:ParentMembereqix:ATMProgramMember2020-01-012020-12-310001101239eqix:ATMProgramMember2020-01-012020-12-310001101239us-gaap:AccumulatedDistributionsInExcessOfNetIncomeMember2020-01-012020-12-310001101239us-gaap:CommonStockMember2020-12-310001101239us-gaap:TreasuryStockCommonMember2020-12-310001101239us-gaap:AdditionalPaidInCapitalMember2020-12-310001101239us-gaap:AccumulatedDistributionsInExcessOfNetIncomeMember2020-12-310001101239us-gaap:AccumulatedOtherComprehensiveIncomeMember2020-12-310001101239us-gaap:RetainedEarningsMember2020-12-310001101239us-gaap:ParentMember2020-12-310001101239us-gaap:NoncontrollingInterestMember2020-12-3100011012392020-12-310001101239us-gaap:RetainedEarningsMember2021-01-012021-12-310001101239us-gaap:ParentMember2021-01-012021-12-310001101239us-gaap:NoncontrollingInterestMember2021-01-012021-12-310001101239us-gaap:AccumulatedOtherComprehensiveIncomeMember2021-01-012021-12-310001101239us-gaap:CommonStockMember2021-01-012021-12-310001101239us-gaap:TreasuryStockCommonMember2021-01-012021-12-310001101239us-gaap:AdditionalPaidInCapitalMember2021-01-012021-12-310001101239us-gaap:CommonStockMembereqix:ATMProgramMember2021-01-012021-12-310001101239eqix:ATMProgramMemberus-gaap:AdditionalPaidInCapitalMember2021-01-012021-12-310001101239us-gaap:ParentMembereqix:ATMProgramMember2021-01-012021-12-310001101239eqix:ATMProgramMember2021-01-012021-12-310001101239us-gaap:AccumulatedDistributionsInExcessOfNetIncomeMember2021-01-012021-12-310001101239us-gaap:CommonStockMember2021-12-310001101239us-gaap:TreasuryStockCommonMember2021-12-310001101239us-gaap:AdditionalPaidInCapitalMember2021-12-310001101239us-gaap:AccumulatedDistributionsInExcessOfNetIncomeMember2021-12-310001101239us-gaap:AccumulatedOtherComprehensiveIncomeMember2021-12-310001101239us-gaap:RetainedEarningsMember2021-12-310001101239us-gaap:ParentMember2021-12-310001101239us-gaap:NoncontrollingInterestMember2021-12-310001101239us-gaap:RetainedEarningsMember2022-01-012022-12-310001101239us-gaap:ParentMember2022-01-012022-12-310001101239us-gaap:NoncontrollingInterestMember2022-01-012022-12-310001101239us-gaap:AccumulatedOtherComprehensiveIncomeMember2022-01-012022-12-310001101239us-gaap:CommonStockMember2022-01-012022-12-310001101239us-gaap:TreasuryStockCommonMember2022-01-012022-12-310001101239us-gaap:AdditionalPaidInCapitalMember2022-01-012022-12-310001101239us-gaap:CommonStockMembereqix:ATMProgramMember2022-01-012022-12-310001101239eqix:ATMProgramMemberus-gaap:AdditionalPaidInCapitalMember2022-01-012022-12-310001101239us-gaap:ParentMembereqix:ATMProgramMember2022-01-012022-12-310001101239eqix:ATMProgramMember2022-01-012022-12-310001101239us-gaap:AccumulatedDistributionsInExcessOfNetIncomeMember2022-01-012022-12-310001101239us-gaap:CommonStockMember2022-12-310001101239us-gaap:TreasuryStockCommonMember2022-12-310001101239us-gaap:AdditionalPaidInCapitalMember2022-12-310001101239us-gaap:AccumulatedDistributionsInExcessOfNetIncomeMember2022-12-310001101239us-gaap:AccumulatedOtherComprehensiveIncomeMember2022-12-310001101239us-gaap:RetainedEarningsMember2022-12-310001101239us-gaap:ParentMember2022-12-310001101239us-gaap:NoncontrollingInterestMember2022-12-31eqix:providereqix:centereqix:market0001101239eqix:AxtelMember2020-01-080001101239eqix:BellDataCentersMember2020-10-010001101239eqix:BellDataCentersMember2020-11-020001101239eqix:GPXIndiaAcquisitionMember2021-09-010001101239eqix:MainOneCableCompanyLtdMember2022-04-010001101239eqix:EmpresaNacionalDeTelecomunicacionesSAMember2022-05-020001101239srt:MinimumMember2022-01-012022-12-310001101239srt:MaximumMember2022-01-012022-12-310001101239us-gaap:SalesMemberus-gaap:GeographicConcentrationRiskMembereqix:AmericasSegmentMember2022-01-012022-12-31xbrli:pure0001101239us-gaap:SalesMemberus-gaap:GeographicConcentrationRiskMembereqix:AmericasSegmentMember2021-01-012021-12-310001101239us-gaap:SalesMemberus-gaap:GeographicConcentrationRiskMembereqix:AmericasSegmentMember2020-01-012020-12-310001101239us-gaap:SalesMembereqix:EMEASegmentMemberus-gaap:GeographicConcentrationRiskMember2022-01-012022-12-310001101239us-gaap:SalesMembereqix:EMEASegmentMemberus-gaap:GeographicConcentrationRiskMember2021-01-012021-12-310001101239us-gaap:SalesMembereqix:EMEASegmentMemberus-gaap:GeographicConcentrationRiskMember2020-01-012020-12-310001101239us-gaap:SalesMembereqix:AsiaPacificSegmentMemberus-gaap:GeographicConcentrationRiskMember2022-01-012022-12-310001101239us-gaap:SalesMembereqix:AsiaPacificSegmentMemberus-gaap:GeographicConcentrationRiskMember2021-01-012021-12-310001101239us-gaap:SalesMembereqix:AsiaPacificSegmentMemberus-gaap:GeographicConcentrationRiskMember2020-01-012020-12-310001101239eqix:CoreSystemsMembersrt:MinimumMember2022-01-012022-12-310001101239eqix:CoreSystemsMembersrt:MaximumMember2022-01-012022-12-310001101239us-gaap:BuildingMembersrt:MinimumMember2022-01-012022-12-310001101239us-gaap:BuildingMembersrt:MaximumMember2022-01-012022-12-310001101239us-gaap:LeaseholdImprovementsMembersrt:MinimumMember2022-01-012022-12-310001101239us-gaap:LeaseholdImprovementsMembersrt:MaximumMember2022-01-012022-12-310001101239srt:MinimumMembereqix:PersonalPropertyIncludingCapitalizedInternalUseSoftwareMember2022-01-012022-12-310001101239srt:MaximumMembereqix:PersonalPropertyIncludingCapitalizedInternalUseSoftwareMember2022-01-012022-12-310001101239us-gaap:PropertyPlantAndEquipmentMember2020-01-012020-12-310001101239us-gaap:PropertyPlantAndEquipmentMember2022-01-012022-12-310001101239us-gaap:PropertyPlantAndEquipmentMember2021-01-012021-12-31eqix:segment0001101239eqix:IBXDataCenterMembersrt:MinimumMember2022-01-012022-12-310001101239eqix:IBXDataCenterMembersrt:MaximumMember2022-01-012022-12-310001101239us-gaap:RestrictedStockUnitsRSUMember2022-01-012022-12-310001101239srt:MinimumMembersrt:ExecutiveOfficerMember2022-01-012022-12-310001101239srt:MaximumMembersrt:ExecutiveOfficerMember2022-01-012022-12-310001101239us-gaap:RestrictedStockMember2022-01-012022-12-310001101239srt:MinimumMember2022-12-310001101239srt:MaximumMember2022-12-3100011012392023-01-012022-12-3100011012392025-01-012022-12-310001101239eqix:EntelChileMember2022-05-020001101239eqix:EntelChileMember2022-05-022022-05-020001101239eqix:EntelPeruMember2022-08-012022-08-010001101239eqix:MainOneCableCompanyLtdMember2022-04-012022-04-010001101239eqix:GPXMember2021-09-010001101239eqix:GPXMember2021-09-012021-09-01iso4217:INR0001101239eqix:EntelPeruMember2022-08-01eqix:acquisition0001101239us-gaap:CustomerRelationshipsMembereqix:GPXMember2021-09-012021-09-010001101239us-gaap:MeasurementInputDiscountRateMemberus-gaap:CustomerRelationshipsMembereqix:GPXMember2021-09-010001101239eqix:EntelPeruMemberus-gaap:CustomerRelationshipsMember2022-08-012022-08-010001101239eqix:EntelPeruMemberus-gaap:MeasurementInputDiscountRateMemberus-gaap:CustomerRelationshipsMember2022-08-010001101239us-gaap:CustomerRelationshipsMembereqix:EntelChileMember2022-05-022022-05-020001101239srt:MinimumMemberus-gaap:CustomerRelationshipsMembereqix:EntelChileMember2022-05-022022-05-020001101239srt:MaximumMemberus-gaap:CustomerRelationshipsMembereqix:EntelChileMember2022-05-022022-05-020001101239us-gaap:MeasurementInputDiscountRateMembersrt:MinimumMemberus-gaap:CustomerRelationshipsMembereqix:EntelChileMember2022-05-020001101239us-gaap:MeasurementInputDiscountRateMembersrt:MaximumMemberus-gaap:CustomerRelationshipsMembereqix:EntelChileMember2022-05-020001101239us-gaap:CustomerRelationshipsMembereqix:MainOneCableCompanyLtdMember2022-04-012022-04-010001101239srt:MinimumMemberus-gaap:CustomerRelationshipsMembereqix:MainOneCableCompanyLtdMember2022-04-012022-04-010001101239srt:MaximumMemberus-gaap:CustomerRelationshipsMembereqix:MainOneCableCompanyLtdMember2022-04-012022-04-010001101239us-gaap:MeasurementInputDiscountRateMemberus-gaap:CustomerRelationshipsMembereqix:MainOneCableCompanyLtdMember2022-04-010001101239us-gaap:TradeNamesMembereqix:MainOneCableCompanyLtdMember2022-04-012022-04-010001101239us-gaap:MeasurementInputDiscountRateMemberus-gaap:TradeNamesMembereqix:MainOneCableCompanyLtdMember2022-04-010001101239us-gaap:TradeNamesMembereqix:MeasurementInputRoyaltyRateMembereqix:MainOneCableCompanyLtdMember2022-04-010001101239eqix:EntelChileEntelPeruAndMainOneMember2022-01-012022-12-310001101239eqix:EntelChileAndEntelPeruMember2022-12-31eqix:Center0001101239eqix:BellDataCentersMember2020-11-022020-11-02iso4217:CAD0001101239eqix:PacketHostInc.Member2020-03-022020-03-020001101239eqix:PacketHostInc.Member2020-01-012020-03-310001101239eqix:PacketHostInc.Member2020-03-020001101239eqix:AxtelMember2020-01-082020-01-080001101239us-gaap:StockCompensationPlanMember2022-01-012022-12-310001101239us-gaap:StockCompensationPlanMember2021-01-012021-12-310001101239us-gaap:StockCompensationPlanMember2020-01-012020-12-310001101239eqix:Warsaw4WA4DataCenterSiteMembereqix:EMEA2JointVentureMemberus-gaap:DisposalGroupDisposedOfBySaleNotDiscontinuedOperationsMember2021-06-012021-06-300001101239eqix:Warsaw4WA4DataCenterSiteMembereqix:EMEA2JointVentureMemberus-gaap:DisposalGroupDisposedOfBySaleNotDiscontinuedOperationsMember2022-06-012022-06-300001101239eqix:Sydney9SY9DataCenterSiteMembereqix:AsiaPacific2JointVentureMemberus-gaap:DisposalGroupDisposedOfBySaleNotDiscontinuedOperationsMember2022-03-012022-03-310001101239eqix:AsiaPacific2JointVentureMember2022-03-310001101239us-gaap:DisposalGroupHeldForSaleOrDisposedOfBySaleNotDiscontinuedOperationsMembereqix:MX3Member2022-12-310001101239us-gaap:DisposalGroupHeldForSaleOrDisposedOfBySaleNotDiscontinuedOperationsMembereqix:SY9MX3AndWA4DataCentersToBeSoldMember2021-12-310001101239eqix:XScaleDataCentersMembereqix:EMEA2JointVentureMemberus-gaap:DisposalGroupDisposedOfBySaleNotDiscontinuedOperationsMember2021-09-012021-09-300001101239eqix:EMEA2JointVentureMember2021-09-300001101239eqix:SP5DataCenterMembereqix:EMEA2JointVentureMemberus-gaap:DisposalGroupDisposedOfBySaleNotDiscontinuedOperationsMember2021-10-012021-10-310001101239eqix:EMEA1JointVentureMembereqix:DB5DataCenterMemberus-gaap:DisposalGroupDisposedOfBySaleNotDiscontinuedOperationsMember2021-07-012021-07-310001101239eqix:EMEA1JointVentureMembereqix:DB5DataCenterMember2021-01-012021-12-310001101239eqix:EMEA1JointVentureMember2022-12-310001101239eqix:EMEA1JointVentureMember2021-12-310001101239eqix:VariableInterestEntityVIEJointVentureMemberus-gaap:VariableInterestEntityNotPrimaryBeneficiaryMember2022-12-310001101239eqix:VariableInterestEntityVIEJointVentureMemberus-gaap:VariableInterestEntityNotPrimaryBeneficiaryMember2021-12-310001101239eqix:JointVentureMember2022-12-310001101239eqix:JointVentureMember2021-12-310001101239eqix:EMEA1JointVentureMembereqix:EquityContributionCommitmentMember2022-12-310001101239eqix:AsiaPacific3JointVentureMember2022-04-060001101239eqix:VariableInterestEntityVIEJointVentureMember2022-12-310001101239eqix:VIEJointVentureMemberus-gaap:VariableInterestEntityNotPrimaryBeneficiaryMemberus-gaap:CorporateJointVentureMember2022-12-310001101239eqix:EMEA2JointVentureCreditFacilityMembereqix:VariableInterestEntityVIEJointVentureMemberus-gaap:VariableInterestEntityNotPrimaryBeneficiaryMember2022-12-310001101239us-gaap:VariableInterestEntityNotPrimaryBeneficiaryMembereqix:EMEA2JointVentureMember2022-12-310001101239eqix:EMEA2JointVentureCreditFacilityMemberus-gaap:VariableInterestEntityNotPrimaryBeneficiaryMembereqix:EMEA2JointVentureMember2022-12-310001101239us-gaap:CashMember2022-12-310001101239us-gaap:CashMember2021-12-310001101239us-gaap:MoneyMarketFundsMember2022-12-310001101239us-gaap:MoneyMarketFundsMember2021-12-310001101239srt:CumulativeEffectPeriodOfAdoptionAdjustmentMember2020-01-012020-12-310001101239eqix:CoreSystemsMember2022-12-310001101239eqix:CoreSystemsMember2021-12-310001101239us-gaap:BuildingMember2022-12-310001101239us-gaap:BuildingMember2021-12-310001101239us-gaap:LeaseholdImprovementsMember2022-12-310001101239us-gaap:LeaseholdImprovementsMember2021-12-310001101239us-gaap:ConstructionInProgressMember2022-12-310001101239us-gaap:ConstructionInProgressMember2021-12-310001101239eqix:PersonalPropertyIncludingCapitalizedInternalUseSoftwareMember2022-12-310001101239eqix:PersonalPropertyIncludingCapitalizedInternalUseSoftwareMember2021-12-310001101239us-gaap:LandMember2022-12-310001101239us-gaap:LandMember2021-12-310001101239eqix:AmericasSegmentMember2022-12-310001101239eqix:AmericasSegmentMember2021-12-310001101239eqix:EMEASegmentMember2022-12-310001101239eqix:EMEASegmentMember2021-12-310001101239eqix:AsiaPacificSegmentMember2022-12-310001101239eqix:AsiaPacificSegmentMember2021-12-310001101239us-gaap:CustomerRelationshipsMember2022-12-310001101239us-gaap:CustomerRelationshipsMember2021-12-310001101239us-gaap:TradeNamesMember2022-12-310001101239us-gaap:TradeNamesMember2021-12-310001101239us-gaap:LeasesAcquiredInPlaceMember2022-12-310001101239us-gaap:LeasesAcquiredInPlaceMember2021-12-310001101239us-gaap:LicenseMember2022-12-310001101239us-gaap:LicenseMember2021-12-310001101239eqix:AtMoneyContractsMember2022-12-310001101239eqix:AtMoneyContractsMember2021-12-310001101239us-gaap:OtherIntangibleAssetsMember2022-12-310001101239us-gaap:OtherIntangibleAssetsMember2021-12-310001101239eqix:AmericasSegmentMember2020-12-310001101239eqix:EMEASegmentMember2020-12-310001101239eqix:AsiaPacificSegmentMember2020-12-310001101239eqix:GPXMembereqix:AmericasSegmentMember2021-01-012021-12-310001101239eqix:EMEASegmentMembereqix:GPXMember2021-01-012021-12-310001101239eqix:AsiaPacificSegmentMembereqix:GPXMember2021-01-012021-12-310001101239eqix:GPXMember2021-01-012021-12-310001101239eqix:AmericasSegmentMember2021-01-012021-12-310001101239eqix:EMEASegmentMember2021-01-012021-12-310001101239eqix:AsiaPacificSegmentMember2021-01-012021-12-310001101239eqix:MainOneCableCompanyLtdMembereqix:AmericasSegmentMember2022-01-012022-12-310001101239eqix:EMEASegmentMembereqix:MainOneCableCompanyLtdMember2022-01-012022-12-310001101239eqix:AsiaPacificSegmentMembereqix:MainOneCableCompanyLtdMember2022-01-012022-12-310001101239eqix:MainOneCableCompanyLtdMember2022-01-012022-12-310001101239eqix:EntelChileMembereqix:AmericasSegmentMember2022-01-012022-12-310001101239eqix:EMEASegmentMembereqix:EntelChileMember2022-01-012022-12-310001101239eqix:AsiaPacificSegmentMembereqix:EntelChileMember2022-01-012022-12-310001101239eqix:EntelChileMember2022-01-012022-12-310001101239eqix:EntelPeruMembereqix:AmericasSegmentMember2022-01-012022-12-310001101239eqix:EntelPeruMembereqix:EMEASegmentMember2022-01-012022-12-310001101239eqix:EntelPeruMembereqix:AsiaPacificSegmentMember2022-01-012022-12-310001101239eqix:EntelPeruMember2022-01-012022-12-310001101239eqix:AmericasSegmentMember2022-01-012022-12-310001101239eqix:EMEASegmentMember2022-01-012022-12-310001101239eqix:AsiaPacificSegmentMember2022-01-012022-12-310001101239eqix:AmericasSegmentMember2019-12-310001101239eqix:EMEASegmentMember2019-12-310001101239eqix:AsiaPacificSegmentMember2019-12-310001101239eqix:AxtelMembereqix:AmericasSegmentMember2020-01-012020-12-310001101239eqix:EMEASegmentMembereqix:AxtelMember2020-01-012020-12-310001101239eqix:AsiaPacificSegmentMembereqix:AxtelMember2020-01-012020-12-310001101239eqix:AxtelMember2020-01-012020-12-310001101239eqix:PacketHostInc.Membereqix:AmericasSegmentMember2020-01-012020-12-310001101239eqix:EMEASegmentMembereqix:PacketHostInc.Member2020-01-012020-12-310001101239eqix:AsiaPacificSegmentMembereqix:PacketHostInc.Member2020-01-012020-12-310001101239eqix:PacketHostInc.Member2020-01-012020-12-310001101239eqix:BellDataCentersMembereqix:AmericasSegmentMember2020-01-012020-12-310001101239eqix:BellDataCentersMembereqix:EMEASegmentMember2020-01-012020-12-310001101239eqix:BellDataCentersMembereqix:AsiaPacificSegmentMember2020-01-012020-12-310001101239eqix:BellDataCentersMember2020-01-012020-12-310001101239eqix:AmericasSegmentMember2020-01-012020-12-310001101239eqix:EMEASegmentMember2020-01-012020-12-310001101239eqix:AsiaPacificSegmentMember2020-01-012020-12-310001101239us-gaap:NetInvestmentHedgingMemberus-gaap:DesignatedAsHedgingInstrumentMembereqix:ForeignCurrencyDebtMember2022-12-310001101239us-gaap:NetInvestmentHedgingMemberus-gaap:DesignatedAsHedgingInstrumentMembereqix:ForeignCurrencyDebtMember2021-12-310001101239us-gaap:NetInvestmentHedgingMemberus-gaap:CrossCurrencyInterestRateContractMemberus-gaap:DesignatedAsHedgingInstrumentMember2022-12-310001101239us-gaap:NetInvestmentHedgingMemberus-gaap:CrossCurrencyInterestRateContractMemberus-gaap:DesignatedAsHedgingInstrumentMember2021-12-310001101239us-gaap:NetInvestmentHedgingMemberus-gaap:DesignatedAsHedgingInstrumentMemberus-gaap:ForeignExchangeForwardMember2022-12-310001101239us-gaap:NetInvestmentHedgingMemberus-gaap:DesignatedAsHedgingInstrumentMemberus-gaap:ForeignExchangeForwardMember2021-12-310001101239us-gaap:NetInvestmentHedgingMembereqix:ForeignCurrencyDebtMember2022-01-012022-12-310001101239us-gaap:NetInvestmentHedgingMembereqix:ForeignCurrencyDebtMember2021-01-012021-12-310001101239us-gaap:NetInvestmentHedgingMembereqix:ForeignCurrencyDebtMember2020-01-012020-12-310001101239us-gaap:NetInvestmentHedgingMemberus-gaap:CurrencySwapMember2022-01-012022-12-310001101239us-gaap:NetInvestmentHedgingMemberus-gaap:CurrencySwapMember2021-01-012021-12-310001101239us-gaap:NetInvestmentHedgingMemberus-gaap:CurrencySwapMember2020-01-012020-12-310001101239us-gaap:NetInvestmentHedgingMembereqix:ForeignCurrencyForwardContractMember2022-01-012022-12-310001101239us-gaap:NetInvestmentHedgingMembereqix:ForeignCurrencyForwardContractMember2021-01-012021-12-310001101239us-gaap:NetInvestmentHedgingMembereqix:ForeignCurrencyForwardContractMember2020-01-012020-12-310001101239us-gaap:NetInvestmentHedgingMember2022-01-012022-12-310001101239us-gaap:NetInvestmentHedgingMember2021-01-012021-12-310001101239us-gaap:NetInvestmentHedgingMember2020-01-012020-12-310001101239us-gaap:ForeignExchangeContractMemberus-gaap:CashFlowHedgingMember2022-12-310001101239us-gaap:ForeignExchangeContractMemberus-gaap:CashFlowHedgingMember2021-12-310001101239us-gaap:CashFlowHedgingMemberus-gaap:InterestRateLockCommitmentsMember2022-12-310001101239us-gaap:CashFlowHedgingMemberus-gaap:InterestRateLockCommitmentsMember2021-12-310001101239us-gaap:CashFlowHedgingMemberus-gaap:InterestRateLockCommitmentsMember2022-01-012022-12-310001101239us-gaap:CrossCurrencyInterestRateContractMemberus-gaap:CashFlowHedgingMember2022-12-310001101239us-gaap:CrossCurrencyInterestRateContractMemberus-gaap:CashFlowHedgingMember2021-12-310001101239us-gaap:ForeignExchangeContractMemberus-gaap:CashFlowHedgingMember2022-01-012022-12-310001101239us-gaap:ForeignExchangeContractMemberus-gaap:CashFlowHedgingMember2021-01-012021-12-310001101239us-gaap:ForeignExchangeContractMemberus-gaap:CashFlowHedgingMember2020-01-012020-12-310001101239us-gaap:ForeignExchangeOptionMemberus-gaap:CashFlowHedgingMember2022-01-012022-12-310001101239us-gaap:ForeignExchangeOptionMemberus-gaap:CashFlowHedgingMember2021-01-012021-12-310001101239us-gaap:ForeignExchangeOptionMemberus-gaap:CashFlowHedgingMember2020-01-012020-12-310001101239us-gaap:CrossCurrencyInterestRateContractMemberus-gaap:CashFlowHedgingMember2022-01-012022-12-310001101239us-gaap:CrossCurrencyInterestRateContractMemberus-gaap:CashFlowHedgingMember2021-01-012021-12-310001101239us-gaap:CrossCurrencyInterestRateContractMemberus-gaap:CashFlowHedgingMember2020-01-012020-12-310001101239us-gaap:CashFlowHedgingMemberus-gaap:InterestRateLockCommitmentsMember2021-01-012021-12-310001101239us-gaap:CashFlowHedgingMemberus-gaap:InterestRateLockCommitmentsMember2020-01-012020-12-310001101239us-gaap:CashFlowHedgingMember2022-01-012022-12-310001101239us-gaap:CashFlowHedgingMember2021-01-012021-12-310001101239us-gaap:CashFlowHedgingMember2020-01-012020-12-310001101239us-gaap:SalesMemberus-gaap:CashFlowHedgingMemberus-gaap:ForeignExchangeForwardMember2022-01-012022-12-310001101239us-gaap:SalesMemberus-gaap:CashFlowHedgingMemberus-gaap:ForeignExchangeForwardMember2021-01-012021-12-310001101239us-gaap:SalesMemberus-gaap:CashFlowHedgingMemberus-gaap:ForeignExchangeForwardMember2020-01-012020-12-310001101239us-gaap:CashFlowHedgingMemberus-gaap:ForeignExchangeForwardMembereqix:CostOfSalesAndOperatingExpensesMember2022-01-012022-12-310001101239us-gaap:CashFlowHedgingMemberus-gaap:ForeignExchangeForwardMembereqix:CostOfSalesAndOperatingExpensesMember2021-01-012021-12-310001101239us-gaap:CashFlowHedgingMemberus-gaap:ForeignExchangeForwardMembereqix:CostOfSalesAndOperatingExpensesMember2020-01-012020-12-310001101239us-gaap:InterestExpenseMemberus-gaap:CashFlowHedgingMemberus-gaap:InterestRateLockCommitmentsMember2022-01-012022-12-310001101239us-gaap:InterestExpenseMemberus-gaap:CashFlowHedgingMemberus-gaap:InterestRateLockCommitmentsMember2021-01-012021-12-310001101239us-gaap:InterestExpenseMemberus-gaap:CashFlowHedgingMemberus-gaap:InterestRateLockCommitmentsMember2020-01-012020-12-310001101239us-gaap:NondesignatedMembereqix:ForeignCurrencyForwardContractMember2022-12-310001101239us-gaap:NondesignatedMembereqix:ForeignCurrencyForwardContractMember2021-12-310001101239us-gaap:SalesMemberus-gaap:EmbeddedDerivativeFinancialInstrumentsMember2022-01-012022-12-310001101239us-gaap:SalesMemberus-gaap:EmbeddedDerivativeFinancialInstrumentsMember2021-01-012021-12-310001101239us-gaap:SalesMemberus-gaap:EmbeddedDerivativeFinancialInstrumentsMember2020-01-012020-12-310001101239eqix:EmbeddedDerivativeEconomicHedgeMemberus-gaap:SalesMember2022-01-012022-12-310001101239eqix:EmbeddedDerivativeEconomicHedgeMemberus-gaap:SalesMember2021-01-012021-12-310001101239eqix:EmbeddedDerivativeEconomicHedgeMemberus-gaap:SalesMember2020-01-012020-12-310001101239us-gaap:OtherOperatingIncomeExpenseMembereqix:ForeignCurrencyForwardContractMember2022-01-012022-12-310001101239us-gaap:OtherOperatingIncomeExpenseMembereqix:ForeignCurrencyForwardContractMember2021-01-012021-12-310001101239us-gaap:OtherOperatingIncomeExpenseMembereqix:ForeignCurrencyForwardContractMember2020-01-012020-12-310001101239us-gaap:ForeignExchangeContractMemberus-gaap:DesignatedAsHedgingInstrumentMemberus-gaap:CashFlowHedgingMember2022-12-310001101239us-gaap:ForeignExchangeContractMemberus-gaap:DesignatedAsHedgingInstrumentMemberus-gaap:CashFlowHedgingMember2021-12-310001101239us-gaap:CrossCurrencyInterestRateContractMemberus-gaap:DesignatedAsHedgingInstrumentMemberus-gaap:CashFlowHedgingMember2022-12-310001101239us-gaap:CrossCurrencyInterestRateContractMemberus-gaap:DesignatedAsHedgingInstrumentMemberus-gaap:CashFlowHedgingMember2021-12-310001101239us-gaap:DesignatedAsHedgingInstrumentMemberus-gaap:CashFlowHedgingMemberus-gaap:InterestRateLockCommitmentsMember2022-12-310001101239us-gaap:DesignatedAsHedgingInstrumentMemberus-gaap:CashFlowHedgingMemberus-gaap:InterestRateLockCommitmentsMember2021-12-310001101239us-gaap:NetInvestmentHedgingMembereqix:ForeignCurrencyForwardContractMemberus-gaap:DesignatedAsHedgingInstrumentMember2022-12-310001101239us-gaap:NetInvestmentHedgingMembereqix:ForeignCurrencyForwardContractMemberus-gaap:DesignatedAsHedgingInstrumentMember2021-12-310001101239us-gaap:DesignatedAsHedgingInstrumentMember2022-12-310001101239us-gaap:DesignatedAsHedgingInstrumentMember2021-12-310001101239us-gaap:NondesignatedMemberus-gaap:EmbeddedDerivativeFinancialInstrumentsMember2022-12-310001101239us-gaap:NondesignatedMemberus-gaap:EmbeddedDerivativeFinancialInstrumentsMember2021-12-310001101239eqix:EmbeddedDerivativeEconomicHedgeMemberus-gaap:NondesignatedMember2022-12-310001101239eqix:EmbeddedDerivativeEconomicHedgeMemberus-gaap:NondesignatedMember2021-12-310001101239us-gaap:NondesignatedMember2022-12-310001101239us-gaap:NondesignatedMember2021-12-310001101239us-gaap:FairValueMeasurementsRecurringMemberus-gaap:MoneyMarketFundsMember2022-12-310001101239us-gaap:FairValueMeasurementsRecurringMemberus-gaap:FairValueInputsLevel1Memberus-gaap:MoneyMarketFundsMember2022-12-310001101239us-gaap:FairValueInputsLevel2Memberus-gaap:FairValueMeasurementsRecurringMemberus-gaap:MoneyMarketFundsMember2022-12-310001101239us-gaap:FairValueMeasurementsRecurringMember2022-12-310001101239us-gaap:FairValueMeasurementsRecurringMemberus-gaap:FairValueInputsLevel1Member2022-12-310001101239us-gaap:FairValueInputsLevel2Memberus-gaap:FairValueMeasurementsRecurringMember2022-12-310001101239us-gaap:FairValueMeasurementsRecurringMember2021-12-310001101239us-gaap:FairValueMeasurementsRecurringMemberus-gaap:FairValueInputsLevel1Member2021-12-310001101239us-gaap:FairValueInputsLevel2Memberus-gaap:FairValueMeasurementsRecurringMember2021-12-310001101239eqix:Atlanta1AT1DataCenterMember2022-01-012022-03-310001101239eqix:Atlanta1AT1DataCenterMember2022-03-31eqix:option0001101239eqix:HK6NewLandAndBuildingConstructSiteMember2022-04-012022-06-300001101239eqix:HK6NewLandAndBuildingConstructSiteMember2022-06-300001101239eqix:HK2DataCenterPhase1Member2022-06-300001101239eqix:HK2HONGKONGMETROCHINAMember2022-06-300001101239eqix:NewYork3NY3DataCenterMember2022-10-012022-12-310001101239eqix:NewYork3NY3DataCenterMember2022-12-31eqix:country0001101239us-gaap:UnsecuredDebtMember2022-12-310001101239us-gaap:UnsecuredDebtMember2021-12-310001101239eqix:MortgagePayableAndOtherLoansPayableMember2022-12-310001101239eqix:MortgagePayableAndOtherLoansPayableMember2021-12-310001101239us-gaap:MortgagesMember2022-12-310001101239us-gaap:MortgagesMember2021-12-310001101239eqix:A2017SeniorCreditFacilityMemberus-gaap:LineOfCreditMember2017-12-310001101239eqix:A2017SeniorCreditFacilityMemberus-gaap:RevolvingCreditFacilityMemberus-gaap:LineOfCreditMember2017-12-310001101239eqix:A2017SeniorCreditFacilityMemberus-gaap:UnsecuredDebtMemberus-gaap:LineOfCreditMember2017-12-310001101239eqix:JPYUnsecuredTermLoanMemberus-gaap:UnsecuredDebtMemberus-gaap:LineOfCreditMember2017-12-310001101239us-gaap:UnsecuredDebtMembereqix:SEKUnsecuredTermLoanMember2021-05-172021-05-170001101239eqix:JPYUnsecuredTermLoanMemberus-gaap:UnsecuredDebtMember2021-05-172021-05-170001101239eqix:A2022SeniorCreditFacilityMemberus-gaap:RevolvingCreditFacilityMemberus-gaap:LineOfCreditMember2022-01-070001101239us-gaap:UnsecuredDebtMembereqix:A2022SeniorCreditFacilityMemberus-gaap:LineOfCreditMember2022-01-07iso4217:GBP0001101239us-gaap:UnsecuredDebtMembereqix:A2022SeniorCreditFacilityMemberus-gaap:LineOfCreditMember2022-01-072022-01-070001101239eqix:A2017SeniorCreditFacilityMemberus-gaap:UnsecuredDebtMemberus-gaap:LineOfCreditMember2022-01-072022-01-070001101239srt:MinimumMembereqix:A2022SeniorCreditFacilityMemberus-gaap:SecuredOvernightFinancingRateSofrOvernightIndexSwapRateMemberus-gaap:LineOfCreditMember2022-01-012022-12-310001101239srt:MaximumMembereqix:A2022SeniorCreditFacilityMemberus-gaap:SecuredOvernightFinancingRateSofrOvernightIndexSwapRateMemberus-gaap:LineOfCreditMember2022-01-012022-12-310001101239eqix:SterlingOvernightIndexAverageRateMembersrt:MinimumMembereqix:A2022SeniorCreditFacilityMemberus-gaap:LineOfCreditMember2022-01-012022-12-310001101239eqix:SterlingOvernightIndexAverageRateMembersrt:MaximumMembereqix:A2022SeniorCreditFacilityMemberus-gaap:LineOfCreditMember2022-01-012022-12-310001101239srt:MinimumMembereqix:A2022SeniorCreditFacilityMemberus-gaap:LineOfCreditMember2022-01-012022-12-310001101239srt:MaximumMembereqix:A2022SeniorCreditFacilityMemberus-gaap:LineOfCreditMember2022-01-012022-12-310001101239us-gaap:UnsecuredDebtMemberus-gaap:LineOfCreditMember2022-12-310001101239us-gaap:UnsecuredDebtMemberus-gaap:LineOfCreditMember2021-12-310001101239us-gaap:LetterOfCreditMemberus-gaap:LineOfCreditMember2022-12-31eqix:credit0001101239us-gaap:RevolvingCreditFacilityMemberus-gaap:LineOfCreditMember2022-12-310001101239us-gaap:SeniorNotesMembereqix:TwoPointSixTwoFiveSeniorNotesDueInTwoThousandTwentyFourMember2022-12-310001101239us-gaap:SeniorNotesMembereqix:TwoPointSixTwoFiveSeniorNotesDueInTwoThousandTwentyFourMember2021-12-310001101239us-gaap:SeniorNotesMembereqix:OnePointTwoFiveZeroPercentSeniorNotesDueTwoThousandTwentyFiveMember2022-12-310001101239us-gaap:SeniorNotesMembereqix:OnePointTwoFiveZeroPercentSeniorNotesDueTwoThousandTwentyFiveMember2021-12-310001101239us-gaap:SeniorNotesMembereqix:OnePointZeroZeroZeroPercentSeniorNotesDueTwentyTwentyFiveMember2022-12-310001101239us-gaap:SeniorNotesMembereqix:OnePointZeroZeroZeroPercentSeniorNotesDueTwentyTwentyFiveMember2021-12-310001101239us-gaap:SeniorNotesMembereqix:TwoPointNineZeroZeroSeniorNotesDueTwoThousandTwentySixMember2022-12-310001101239us-gaap:SeniorNotesMembereqix:TwoPointNineZeroZeroSeniorNotesDueTwoThousandTwentySixMember2021-12-310001101239us-gaap:SeniorNotesMembereqix:OnePointFourFiveZeroPercentSeniorNotesDueTwoThousandTwentySixMember2022-12-310001101239us-gaap:SeniorNotesMembereqix:OnePointFourFiveZeroPercentSeniorNotesDueTwoThousandTwentySixMember2021-12-310001101239us-gaap:SeniorNotesMembereqix:ZeroPointTwoFiveZeroPercentEuroSeniorNotesDueTwoThousandTwentySevenMember2022-12-310001101239us-gaap:SeniorNotesMembereqix:ZeroPointTwoFiveZeroPercentEuroSeniorNotesDueTwoThousandTwentySevenMember2021-12-310001101239us-gaap:SeniorNotesMembereqix:OnePointEightPercentSeniorNotesDueTwoThousandTwentySevenMember2022-12-310001101239us-gaap:SeniorNotesMembereqix:OnePointEightPercentSeniorNotesDueTwoThousandTwentySevenMember2021-12-310001101239us-gaap:SeniorNotesMembereqix:OnePointFiveFiveZeroPercentNotesDueTwoThousandTwentyEightMember2022-12-310001101239us-gaap:SeniorNotesMembereqix:OnePointFiveFiveZeroPercentNotesDueTwoThousandTwentyEightMember2021-12-310001101239eqix:TwoPointZeroZeroZeroPercentSeniorNotesDueTwoThousandTwentyEightMemberus-gaap:SeniorNotesMember2022-12-310001101239eqix:TwoPointZeroZeroZeroPercentSeniorNotesDueTwoThousandTwentyEightMemberus-gaap:SeniorNotesMember2021-12-310001101239us-gaap:SeniorNotesMembereqix:ThreePointTwoZeroZeroPercentSeniorNotesDueInTwoThousandTwentyNineMember2022-12-310001101239us-gaap:SeniorNotesMembereqix:ThreePointTwoZeroZeroPercentSeniorNotesDueInTwoThousandTwentyNineMember2021-12-310001101239us-gaap:SeniorNotesMembereqix:TwoPointOneFiveZeroPercentSeniorNotesDueTwoThousandThirtyMember2022-12-310001101239us-gaap:SeniorNotesMembereqix:TwoPointOneFiveZeroPercentSeniorNotesDueTwoThousandThirtyMember2021-12-310001101239us-gaap:SeniorNotesMembereqix:TwoPointFiveZeroZeroPercentSeniorNotesDueTwoThousandThirtyOneMember2022-12-310001101239us-gaap:SeniorNotesMembereqix:TwoPointFiveZeroZeroPercentSeniorNotesDueTwoThousandThirtyOneMember2021-12-310001101239us-gaap:SeniorNotesMembereqix:ThreePointNineZeroZeroPercentSeniorNotesDueTwoThousandThirtyTwoMember2022-12-310001101239us-gaap:SeniorNotesMembereqix:ThreePointNineZeroZeroPercentSeniorNotesDueTwoThousandThirtyTwoMember2021-12-310001101239us-gaap:SeniorNotesMembereqix:OnePointZeroZeroZeroPercentEuroSeniorNotesDueTwoThousandThirtyThreeMember2022-12-310001101239us-gaap:SeniorNotesMembereqix:OnePointZeroZeroZeroPercentEuroSeniorNotesDueTwoThousandThirtyThreeMember2021-12-310001101239us-gaap:SeniorNotesMembereqix:ThreePointZeroPercentSeniorNotesDueTwoThousandFiftyMember2022-12-310001101239us-gaap:SeniorNotesMembereqix:ThreePointZeroPercentSeniorNotesDueTwoThousandFiftyMember2021-12-310001101239us-gaap:SeniorNotesMembereqix:TwoPointNineFiveZeroPercentSeniorNotesDueTwoThousandFiftyOneMember2022-12-310001101239us-gaap:SeniorNotesMembereqix:TwoPointNineFiveZeroPercentSeniorNotesDueTwoThousandFiftyOneMember2021-12-310001101239us-gaap:SeniorNotesMembereqix:ThreePointFourZeroZeroPercentSeniorNotesDueTwoThousandFiftyTwoMember2022-12-310001101239us-gaap:SeniorNotesMembereqix:ThreePointFourZeroZeroPercentSeniorNotesDueTwoThousandFiftyTwoMember2021-12-310001101239us-gaap:SeniorNotesMember2022-12-310001101239us-gaap:SeniorNotesMember2021-12-310001101239us-gaap:SeniorNotesMembereqix:ZeroPointTwoFiveZeroPercentEuroSeniorNotesDueTwoThousandTwentySevenMember2021-03-100001101239us-gaap:SeniorNotesMembereqix:OnePointZeroZeroZeroPercentEuroSeniorNotesDueTwoThousandThirtyThreeMember2021-03-10iso4217:EUR0001101239us-gaap:SeniorNotesMembereqix:ZeroPointTwoFiveZeroPercentEuroSeniorNotesDueTwoThousandTwentySevenMember2022-03-150001101239us-gaap:SeniorNotesMembereqix:OnePointZeroZeroZeroPercentEuroSeniorNotesDueTwoThousandThirtyThreeMember2022-03-150001101239us-gaap:SeniorNotesMembereqix:TwoPointEightSevenFivePercentEuroSeniorNotesDueTwoThousandTwentySixMember2021-03-240001101239us-gaap:SeniorNotesMembereqix:TwoPointEightSevenFivePercentEuroSeniorNotesDueTwoThousandTwentySixMember2021-03-242021-03-240001101239us-gaap:SeniorNotesMembereqix:TwoPointEightSevenFivePercentEuroSeniorNotesDueTwoThousandTwentySixMember2021-01-012021-12-310001101239us-gaap:SeniorNotesMembereqix:OnePointFourFiveZeroPercentSeniorNotesDueTwoThousandTwentySixMember2021-05-170001101239eqix:TwoPointZeroZeroZeroPercentSeniorNotesDueTwoThousandTwentyEightMemberus-gaap:SeniorNotesMember2021-05-170001101239us-gaap:SeniorNotesMembereqix:TwoPointFiveZeroZeroPercentSeniorNotesDueTwoThousandThirtyOneMember2021-05-170001101239us-gaap:SeniorNotesMembereqix:ThreePointFourZeroZeroPercentSeniorNotesDueTwoThousandFiftyTwoMember2021-05-170001101239us-gaap:SeniorNotesMembereqix:OnePointFourFiveZeroPercentSeniorNotesDueTwoThousandTwentySixMember2021-05-150001101239eqix:TwoPointZeroZeroZeroPercentSeniorNotesDueTwoThousandTwentyEightMemberus-gaap:SeniorNotesMember2021-05-150001101239us-gaap:SeniorNotesMembereqix:TwoPointFiveZeroZeroPercentSeniorNotesDueTwoThousandThirtyOneMember2021-05-150001101239us-gaap:SeniorNotesMembereqix:ThreePointFourZeroZeroPercentSeniorNotesDueTwoThousandFiftyTwoMember2021-05-150001101239us-gaap:SeniorNotesMembereqix:FivePointThreeSevenFivePercentSeniorNotesDueTwoThousandTwentySevenMember2021-06-020001101239us-gaap:SeniorNotesMembereqix:FivePointThreeSevenFivePercentSeniorNotesDueTwoThousandTwentySevenMember2021-06-022021-06-020001101239us-gaap:SeniorNotesMembereqix:ThreePointNineZeroZeroPercentSeniorNotesDueTwoThousandThirtyTwoMember2022-04-050001101239us-gaap:SeniorNotesMember2022-01-012022-12-310001101239us-gaap:SeriesAPreferredStockMember2022-12-310001101239eqix:SeriesA1PreferredStockMember2022-12-310001101239eqix:UndesignatedPreferredStockMember2022-12-3100011012392020-05-012020-05-310001101239eqix:A2020ATMProgramMember2020-10-310001101239eqix:A2022ATMProgramMember2022-11-300001101239eqix:A2020ATMProgramAndEquityForwardAmendmentMember2022-02-012022-02-28eqix:alternative0001101239eqix:EquityForwardAmendmentUnderThe2020ATMProgramMember2022-06-30eqix:agreement0001101239eqix:EquityForwardAmendmentUnderThe2020ATMProgramMember2022-01-012022-12-310001101239eqix:EquityForwardAmendmentUnderThe2020ATMProgramMember2022-08-032022-08-030001101239eqix:EquityForwardAmendmentUnderThe2020ATMProgramMember2022-08-030001101239eqix:A2020ATMProgramMember2022-12-310001101239eqix:A2022ATMProgramMember2022-12-310001101239eqix:A2020ATMProgramMember2022-01-012022-12-310001101239eqix:A2020ATMProgramMember2021-01-012021-12-310001101239eqix:A2018ATMProgramMember2020-01-012020-12-310001101239eqix:A2022ATMProgramMember2022-01-012022-12-310001101239eqix:CommonStockOptionAndRestrictedStockUnitsMember2022-12-310001101239eqix:EmployeeStockPurchasePlanMember2022-12-310001101239us-gaap:AccumulatedTranslationAdjustmentMember2019-12-310001101239us-gaap:AccumulatedTranslationAdjustmentMember2020-01-012020-12-310001101239us-gaap:AccumulatedTranslationAdjustmentMember2020-12-310001101239us-gaap:AccumulatedTranslationAdjustmentMember2021-01-012021-12-310001101239us-gaap:AccumulatedTranslationAdjustmentMember2021-12-310001101239us-gaap:AccumulatedTranslationAdjustmentMember2022-01-012022-12-310001101239us-gaap:AccumulatedTranslationAdjustmentMember2022-12-310001101239us-gaap:AccumulatedGainLossNetCashFlowHedgeParentMember2019-12-310001101239us-gaap:AccumulatedGainLossNetCashFlowHedgeParentMember2020-01-012020-12-310001101239us-gaap:AccumulatedGainLossNetCashFlowHedgeParentMember2020-12-310001101239us-gaap:AccumulatedGainLossNetCashFlowHedgeParentMember2021-01-012021-12-310001101239us-gaap:AccumulatedGainLossNetCashFlowHedgeParentMember2021-12-310001101239us-gaap:AccumulatedGainLossNetCashFlowHedgeParentMember2022-01-012022-12-310001101239us-gaap:AccumulatedGainLossNetCashFlowHedgeParentMember2022-12-310001101239eqix:AccumulatedForeignCurrencyGainLossNetInvestmentHedgesAttributableToParentMember2019-12-310001101239eqix:AccumulatedForeignCurrencyGainLossNetInvestmentHedgesAttributableToParentMember2020-01-012020-12-310001101239eqix:AccumulatedForeignCurrencyGainLossNetInvestmentHedgesAttributableToParentMember2020-12-310001101239eqix:AccumulatedForeignCurrencyGainLossNetInvestmentHedgesAttributableToParentMember2021-01-012021-12-310001101239eqix:AccumulatedForeignCurrencyGainLossNetInvestmentHedgesAttributableToParentMember2021-12-310001101239eqix:AccumulatedForeignCurrencyGainLossNetInvestmentHedgesAttributableToParentMember2022-01-012022-12-310001101239eqix:AccumulatedForeignCurrencyGainLossNetInvestmentHedgesAttributableToParentMember2022-12-310001101239us-gaap:AccumulatedDefinedBenefitPlansAdjustmentNetUnamortizedGainLossMember2019-12-310001101239us-gaap:AccumulatedDefinedBenefitPlansAdjustmentNetUnamortizedGainLossMember2020-01-012020-12-310001101239us-gaap:AccumulatedDefinedBenefitPlansAdjustmentNetUnamortizedGainLossMember2020-12-310001101239us-gaap:AccumulatedDefinedBenefitPlansAdjustmentNetUnamortizedGainLossMember2021-01-012021-12-310001101239us-gaap:AccumulatedDefinedBenefitPlansAdjustmentNetUnamortizedGainLossMember2021-12-310001101239us-gaap:AccumulatedDefinedBenefitPlansAdjustmentNetUnamortizedGainLossMember2022-01-012022-12-310001101239us-gaap:AccumulatedDefinedBenefitPlansAdjustmentNetUnamortizedGainLossMember2022-12-3100011012392022-01-012022-03-3100011012392022-04-012022-06-3000011012392022-07-012022-09-3000011012392022-10-012022-12-3100011012392021-01-012021-03-3100011012392021-04-012021-06-3000011012392021-07-012021-09-3000011012392021-10-012021-12-3100011012392020-01-012020-03-3100011012392020-04-012020-06-3000011012392020-07-012020-09-3000011012392020-10-012020-12-310001101239eqix:SpecialDistributionMember2022-12-310001101239eqix:SpecialDistributionMember2021-12-310001101239eqix:EmployeeStockPurchasePlanMember2022-01-012022-12-31eqix:period0001101239eqix:TwoThousandTwentyEquityIncentivePlanMember2020-01-012020-12-310001101239eqix:TwoThousandTwentyEquityIncentivePlanMember2020-12-310001101239eqix:EmployeeStockPurchasePlanMember2022-12-310001101239eqix:TwoThousandTwentyEquityIncentivePlanMember2022-12-310001101239us-gaap:RestrictedStockUnitsRSUMember2019-12-310001101239us-gaap:RestrictedStockUnitsRSUMember2020-01-012020-12-310001101239us-gaap:RestrictedStockUnitsRSUMember2020-12-310001101239us-gaap:RestrictedStockUnitsRSUMember2021-01-012021-12-310001101239us-gaap:RestrictedStockUnitsRSUMember2021-12-310001101239us-gaap:RestrictedStockUnitsRSUMember2022-12-310001101239eqix:EmployeeStockPurchasePlanMember2021-01-012021-12-310001101239eqix:EmployeeStockPurchasePlanMember2020-01-012020-12-310001101239eqix:EmployeeStockPurchasePlanMembersrt:MinimumMember2022-01-012022-12-310001101239eqix:EmployeeStockPurchasePlanMembersrt:MaximumMember2022-01-012022-12-310001101239eqix:EmployeeStockPurchasePlanMembersrt:MinimumMember2021-01-012021-12-310001101239eqix:EmployeeStockPurchasePlanMembersrt:MaximumMember2021-01-012021-12-310001101239eqix:EmployeeStockPurchasePlanMembersrt:MinimumMember2020-01-012020-12-310001101239eqix:EmployeeStockPurchasePlanMembersrt:MaximumMember2020-01-012020-12-310001101239us-gaap:CostOfSalesMember2022-01-012022-12-310001101239us-gaap:CostOfSalesMember2021-01-012021-12-310001101239us-gaap:CostOfSalesMember2020-01-012020-12-310001101239us-gaap:SellingAndMarketingExpenseMember2022-01-012022-12-310001101239us-gaap:SellingAndMarketingExpenseMember2021-01-012021-12-310001101239us-gaap:SellingAndMarketingExpenseMember2020-01-012020-12-310001101239us-gaap:GeneralAndAdministrativeExpenseMember2022-01-012022-12-310001101239us-gaap:GeneralAndAdministrativeExpenseMember2021-01-012021-12-310001101239us-gaap:GeneralAndAdministrativeExpenseMember2020-01-012020-12-310001101239us-gaap:RestrictedStockMember2021-01-012021-12-310001101239us-gaap:RestrictedStockMember2020-01-012020-12-310001101239us-gaap:EmployeeStockMember2022-01-012022-12-310001101239us-gaap:EmployeeStockMember2021-01-012021-12-310001101239us-gaap:EmployeeStockMember2020-01-012020-12-310001101239eqix:MetronodeMemberus-gaap:IndemnificationGuaranteeMember2022-12-310001101239eqix:MetronodeMemberus-gaap:IndemnificationGuaranteeMember2021-12-310001101239eqix:TaxPeriodNextYearMemberus-gaap:DomesticCountryMember2022-12-310001101239eqix:TaxPeriodNextYearMemberus-gaap:StateAndLocalJurisdictionMember2022-12-310001101239us-gaap:ForeignCountryMembereqix:TaxPeriodNextYearMember2022-12-310001101239eqix:TaxPeriodNextYearMember2022-12-310001101239eqix:TaxPeriodTwoMemberus-gaap:DomesticCountryMember2022-12-310001101239eqix:TaxPeriodTwoMemberus-gaap:StateAndLocalJurisdictionMember2022-12-310001101239eqix:TaxPeriodTwoMemberus-gaap:ForeignCountryMember2022-12-310001101239eqix:TaxPeriodTwoMember2022-12-310001101239eqix:TaxPeriodThreeMemberus-gaap:DomesticCountryMember2022-12-310001101239us-gaap:StateAndLocalJurisdictionMembereqix:TaxPeriodThreeMember2022-12-310001101239us-gaap:ForeignCountryMembereqix:TaxPeriodThreeMember2022-12-310001101239eqix:TaxPeriodThreeMember2022-12-310001101239eqix:TaxPeriodFourMemberus-gaap:DomesticCountryMember2022-12-310001101239us-gaap:StateAndLocalJurisdictionMembereqix:TaxPeriodFourMember2022-12-310001101239us-gaap:ForeignCountryMembereqix:TaxPeriodFourMember2022-12-310001101239eqix:TaxPeriodFourMember2022-12-310001101239eqix:TaxPeriodFiveMemberus-gaap:DomesticCountryMember2022-12-310001101239eqix:TaxPeriodFiveMemberus-gaap:StateAndLocalJurisdictionMember2022-12-310001101239eqix:TaxPeriodFiveMemberus-gaap:ForeignCountryMember2022-12-310001101239eqix:TaxPeriodFiveMember2022-12-310001101239eqix:TaxPeriodSixMemberus-gaap:DomesticCountryMember2022-12-310001101239eqix:TaxPeriodSixMemberus-gaap:StateAndLocalJurisdictionMember2022-12-310001101239eqix:TaxPeriodSixMemberus-gaap:ForeignCountryMember2022-12-310001101239eqix:TaxPeriodSixMember2022-12-310001101239eqix:TaxPeriodSevenMemberus-gaap:DomesticCountryMember2022-12-310001101239eqix:TaxPeriodSevenMemberus-gaap:StateAndLocalJurisdictionMember2022-12-310001101239eqix:TaxPeriodSevenMemberus-gaap:ForeignCountryMember2022-12-310001101239eqix:TaxPeriodSevenMember2022-12-310001101239us-gaap:DomesticCountryMember2022-12-310001101239us-gaap:StateAndLocalJurisdictionMember2022-12-310001101239us-gaap:ForeignCountryMember2022-12-310001101239us-gaap:DomesticCountryMember2022-01-012022-12-310001101239us-gaap:StateAndLocalJurisdictionMember2022-01-012022-12-310001101239us-gaap:CapitalLossCarryforwardMember2022-12-310001101239us-gaap:CapitalAdditionsMember2022-12-310001101239eqix:MiscellaneousPurchaseCommitmentsMember2022-12-31eqix:claim0001101239us-gaap:IndemnificationGuaranteeMember2022-12-310001101239eqix:IndemnificationAgreementTwoMember2022-12-310001101239eqix:IndemnificationAgreementThreeMember2022-12-310001101239eqix:ServiceLevelCreditsAgreementMember2022-12-310001101239eqix:EMEA1JointVentureMemberus-gaap:CorporateJointVentureMember2022-01-012022-12-310001101239eqix:EMEA1JointVentureMemberus-gaap:CorporateJointVentureMember2021-01-012021-12-310001101239eqix:EMEA1JointVentureMemberus-gaap:CorporateJointVentureMember2020-01-012020-12-310001101239eqix:VIEJointVentureMemberus-gaap:CorporateJointVentureMember2022-01-012022-12-310001101239eqix:VIEJointVentureMemberus-gaap:CorporateJointVentureMember2021-01-012021-12-310001101239eqix:VIEJointVentureMemberus-gaap:CorporateJointVentureMember2020-01-012020-12-310001101239eqix:SubleaseEquinixsLondon102DataCenterMembereqix:EMEA1JointVentureMemberus-gaap:CorporateJointVentureMember2022-01-012022-12-310001101239eqix:EMEA1JointVentureMemberus-gaap:CorporateJointVentureMember2022-12-310001101239eqix:EMEA1JointVentureMemberus-gaap:CorporateJointVentureMember2021-12-310001101239eqix:VIEJointVentureMemberus-gaap:VariableInterestEntityNotPrimaryBeneficiaryMemberus-gaap:CorporateJointVentureMember2021-12-310001101239eqix:ColocationMembereqix:AmericasSegmentMember2022-01-012022-12-310001101239eqix:ColocationMembereqix:EMEASegmentMember2022-01-012022-12-310001101239eqix:ColocationMembereqix:AsiaPacificSegmentMember2022-01-012022-12-310001101239eqix:ColocationMember2022-01-012022-12-310001101239eqix:InterconnectionMembereqix:AmericasSegmentMember2022-01-012022-12-310001101239eqix:EMEASegmentMembereqix:InterconnectionMember2022-01-012022-12-310001101239eqix:AsiaPacificSegmentMembereqix:InterconnectionMember2022-01-012022-12-310001101239eqix:InterconnectionMember2022-01-012022-12-310001101239eqix:ManagedInfrastructureMembereqix:AmericasSegmentMember2022-01-012022-12-310001101239eqix:ManagedInfrastructureMembereqix:EMEASegmentMember2022-01-012022-12-310001101239eqix:ManagedInfrastructureMembereqix:AsiaPacificSegmentMember2022-01-012022-12-310001101239eqix:ManagedInfrastructureMember2022-01-012022-12-310001101239eqix:OtherMembereqix:AmericasSegmentMember2022-01-012022-12-310001101239eqix:OtherMembereqix:EMEASegmentMember2022-01-012022-12-310001101239eqix:OtherMembereqix:AsiaPacificSegmentMember2022-01-012022-12-310001101239eqix:OtherMember2022-01-012022-12-310001101239eqix:RecurringRevenuesMembereqix:AmericasSegmentMember2022-01-012022-12-310001101239eqix:EMEASegmentMembereqix:RecurringRevenuesMember2022-01-012022-12-310001101239eqix:RecurringRevenuesMembereqix:AsiaPacificSegmentMember2022-01-012022-12-310001101239eqix:RecurringRevenuesMember2022-01-012022-12-310001101239eqix:NonRecurringRevenuesMembereqix:AmericasSegmentMember2022-01-012022-12-310001101239eqix:NonRecurringRevenuesMembereqix:EMEASegmentMember2022-01-012022-12-310001101239eqix:NonRecurringRevenuesMembereqix:AsiaPacificSegmentMember2022-01-012022-12-310001101239eqix:NonRecurringRevenuesMember2022-01-012022-12-310001101239eqix:ColocationMembereqix:AmericasSegmentMember2021-01-012021-12-310001101239eqix:ColocationMembereqix:EMEASegmentMember2021-01-012021-12-310001101239eqix:ColocationMembereqix:AsiaPacificSegmentMember2021-01-012021-12-310001101239eqix:ColocationMember2021-01-012021-12-310001101239eqix:InterconnectionMembereqix:AmericasSegmentMember2021-01-012021-12-310001101239eqix:EMEASegmentMembereqix:InterconnectionMember2021-01-012021-12-310001101239eqix:AsiaPacificSegmentMembereqix:InterconnectionMember2021-01-012021-12-310001101239eqix:InterconnectionMember2021-01-012021-12-310001101239eqix:ManagedInfrastructureMembereqix:AmericasSegmentMember2021-01-012021-12-310001101239eqix:ManagedInfrastructureMembereqix:EMEASegmentMember2021-01-012021-12-310001101239eqix:ManagedInfrastructureMembereqix:AsiaPacificSegmentMember2021-01-012021-12-310001101239eqix:ManagedInfrastructureMember2021-01-012021-12-310001101239eqix:OtherMembereqix:AmericasSegmentMember2021-01-012021-12-310001101239eqix:OtherMembereqix:EMEASegmentMember2021-01-012021-12-310001101239eqix:OtherMembereqix:AsiaPacificSegmentMember2021-01-012021-12-310001101239eqix:OtherMember2021-01-012021-12-310001101239eqix:RecurringRevenuesMembereqix:AmericasSegmentMember2021-01-012021-12-310001101239eqix:EMEASegmentMembereqix:RecurringRevenuesMember2021-01-012021-12-310001101239eqix:RecurringRevenuesMembereqix:AsiaPacificSegmentMember2021-01-012021-12-310001101239eqix:RecurringRevenuesMember2021-01-012021-12-310001101239eqix:NonRecurringRevenuesMembereqix:AmericasSegmentMember2021-01-012021-12-310001101239eqix:NonRecurringRevenuesMembereqix:EMEASegmentMember2021-01-012021-12-310001101239eqix:NonRecurringRevenuesMembereqix:AsiaPacificSegmentMember2021-01-012021-12-310001101239eqix:NonRecurringRevenuesMember2021-01-012021-12-310001101239eqix:ColocationMembereqix:AmericasSegmentMember2020-01-012020-12-310001101239eqix:ColocationMembereqix:EMEASegmentMember2020-01-012020-12-310001101239eqix:ColocationMembereqix:AsiaPacificSegmentMember2020-01-012020-12-310001101239eqix:ColocationMember2020-01-012020-12-310001101239eqix:InterconnectionMembereqix:AmericasSegmentMember2020-01-012020-12-310001101239eqix:EMEASegmentMembereqix:InterconnectionMember2020-01-012020-12-310001101239eqix:AsiaPacificSegmentMembereqix:InterconnectionMember2020-01-012020-12-310001101239eqix:InterconnectionMember2020-01-012020-12-310001101239eqix:ManagedInfrastructureMembereqix:AmericasSegmentMember2020-01-012020-12-310001101239eqix:ManagedInfrastructureMembereqix:EMEASegmentMember2020-01-012020-12-310001101239eqix:ManagedInfrastructureMembereqix:AsiaPacificSegmentMember2020-01-012020-12-310001101239eqix:ManagedInfrastructureMember2020-01-012020-12-310001101239eqix:OtherMembereqix:AmericasSegmentMember2020-01-012020-12-310001101239eqix:OtherMembereqix:EMEASegmentMember2020-01-012020-12-310001101239eqix:OtherMembereqix:AsiaPacificSegmentMember2020-01-012020-12-310001101239eqix:OtherMember2020-01-012020-12-310001101239eqix:RecurringRevenuesMembereqix:AmericasSegmentMember2020-01-012020-12-310001101239eqix:EMEASegmentMembereqix:RecurringRevenuesMember2020-01-012020-12-310001101239eqix:RecurringRevenuesMembereqix:AsiaPacificSegmentMember2020-01-012020-12-310001101239eqix:RecurringRevenuesMember2020-01-012020-12-310001101239eqix:NonRecurringRevenuesMembereqix:AmericasSegmentMember2020-01-012020-12-310001101239eqix:NonRecurringRevenuesMembereqix:EMEASegmentMember2020-01-012020-12-310001101239eqix:NonRecurringRevenuesMembereqix:AsiaPacificSegmentMember2020-01-012020-12-310001101239eqix:NonRecurringRevenuesMember2020-01-012020-12-310001101239country:USeqix:AmericasSegmentMember2022-01-012022-12-310001101239country:USeqix:AmericasSegmentMember2021-01-012021-12-310001101239country:USeqix:AmericasSegmentMember2020-01-012020-12-310001101239country:USeqix:AmericasSegmentMember2022-12-310001101239country:USeqix:AmericasSegmentMember2021-12-310001101239us-gaap:SubsequentEventMember2023-02-152023-02-150001101239us-gaap:SeniorNotesMemberus-gaap:SubsequentEventMembersrt:ScenarioForecastMembereqix:JPYSeniorNotesMember2023-03-31iso4217:JPY0001101239us-gaap:SeniorNotesMemberus-gaap:SubsequentEventMembereqix:JPYSeniorNotesMember2023-02-160001101239eqix:AT1ATLANTAMETROMembereqix:AmericasSegmentMember2022-12-310001101239eqix:AT2ATLANTAMETROMembereqix:AmericasSegmentMember2022-12-310001101239eqix:AT3ATLANTAMETROMembereqix:AmericasSegmentMember2022-12-310001101239eqix:AT4ATLANTAMETROMembereqix:AmericasSegmentMember2022-12-310001101239eqix:AT5ATLANTAMETROMembereqix:AmericasSegmentMember2022-12-310001101239eqix:BG1BOGOTAMETROCOLOMBIAMembereqix:AmericasSegmentMember2022-12-310001101239eqix:BG2BOGOTAMETROCOLOMBIAMembereqix:AmericasSegmentMember2022-12-310001101239eqix:BO2BOSTONMETROMembereqix:AmericasSegmentMember2022-12-310001101239eqix:CH1CHICAGOMETROMembereqix:AmericasSegmentMember2022-12-310001101239eqix:CH2CHICAGOMETROMembereqix:AmericasSegmentMember2022-12-310001101239eqix:CH3CHICAGOMETROMembereqix:AmericasSegmentMember2022-12-310001101239eqix:CH4CHICAGOMETROMembereqix:AmericasSegmentMember2022-12-310001101239eqix:CH7CHICAGOMETROMembereqix:AmericasSegmentMember2022-12-310001101239eqix:CL1CALGARYMETROCANADAMembereqix:AmericasSegmentMember2022-12-310001101239eqix:CL2CALGARYMETROCANADAMembereqix:AmericasSegmentMember2022-12-310001101239eqix:CL3CALGARYMETROCANADAMembereqix:AmericasSegmentMember2022-12-310001101239eqix:CU1CULPEPERMETROMembereqix:AmericasSegmentMember2022-12-310001101239eqix:CU2CULPEPERMETROMembereqix:AmericasSegmentMember2022-12-310001101239eqix:CU3CULPEPERMETROMembereqix:AmericasSegmentMember2022-12-310001101239eqix:CU4CULPEPERMETROMembereqix:AmericasSegmentMember2022-12-310001101239eqix:DA1DALLASMETROMembereqix:AmericasSegmentMember2022-12-310001101239eqix:DA2DALLASMETROMembereqix:AmericasSegmentMember2022-12-310001101239eqix:DA3DALLASMETROMembereqix:AmericasSegmentMember2022-12-310001101239eqix:DA4DALLASMETROMembereqix:AmericasSegmentMember2022-12-310001101239eqix:DA6DALLASMETROMembereqix:AmericasSegmentMember2022-12-310001101239eqix:DA7DALLASMETROMembereqix:AmericasSegmentMember2022-12-310001101239eqix:DA9DALLASMETROMembereqix:AmericasSegmentMember2022-12-310001101239eqix:DA11DALLASMETROMembereqix:AmericasSegmentMember2022-12-310001101239eqix:INFOMARTBUILDINGDALLASMETROMembereqix:AmericasSegmentMember2022-12-310001101239eqix:DC1WASHINGTONDCMETROMembereqix:AmericasSegmentMember2022-12-310001101239eqix:DC2WASHINGTONDCMETROMembereqix:AmericasSegmentMember2022-12-310001101239eqix:DC3WASHINGTONDCMETROMembereqix:AmericasSegmentMember2022-12-310001101239eqix:DC4WASHINGTONDCMETROMembereqix:AmericasSegmentMember2022-12-310001101239eqix:DC5WASHINGTONDCMETROMembereqix:AmericasSegmentMember2022-12-310001101239eqix:DC6WASHINGTONDCMETROMembereqix:AmericasSegmentMember2022-12-310001101239eqix:DC7WASHINGTONDCMETROMembereqix:AmericasSegmentMember2022-12-310001101239eqix:DC10WASHINGTONDCMETROMembereqix:AmericasSegmentMember2022-12-310001101239eqix:DC11WASHINGTONDCMETROMembereqix:AmericasSegmentMember2022-12-310001101239eqix:DC12WASHINGTONDCMETROMembereqix:AmericasSegmentMember2022-12-310001101239eqix:DC13WASHINGTONDCMETROMembereqix:AmericasSegmentMember2022-12-310001101239eqix:DC14WASHINGTONDCMETROMembereqix:AmericasSegmentMember2022-12-310001101239eqix:DC15WASHINGTONDCMETROMembereqix:AmericasSegmentMember2022-12-310001101239eqix:DC16WASHINGTONDCMETROMembereqix:AmericasSegmentMember2022-12-310001101239eqix:DC21WASHINGTONDCMETROMembereqix:AmericasSegmentMember2022-12-310001101239eqix:DC97WASHINGTONDCMETROMembereqix:AmericasSegmentMember2022-12-310001101239eqix:DE1DENVERMETROMembereqix:AmericasSegmentMember2022-12-310001101239eqix:DE2DENVERMETROMembereqix:AmericasSegmentMember2022-12-310001101239eqix:HO1HOUSTONMETROMembereqix:AmericasSegmentMember2022-12-310001101239eqix:KA1KAMLOOPSMETROCANADAMembereqix:AmericasSegmentMember2022-12-310001101239eqix:LA1LOSANGELESMETROMembereqix:AmericasSegmentMember2022-12-310001101239eqix:LA2LOSANGELESMETROMembereqix:AmericasSegmentMember2022-12-310001101239eqix:LA3LOSANGELESMETROMembereqix:AmericasSegmentMember2022-12-310001101239eqix:LA4LOSANGELESMETROMembereqix:AmericasSegmentMember2022-12-310001101239eqix:LA7LOSANGELESMETROMembereqix:AmericasSegmentMember2022-12-310001101239eqix:LM1LIMAMETROPERUMembereqix:AmericasSegmentMember2022-12-310001101239eqix:MI1MIAMIMETROMembereqix:AmericasSegmentMember2022-12-310001101239eqix:MI2MIAMIMETROMembereqix:AmericasSegmentMember2022-12-310001101239eqix:MI3MIAMIMETROMembereqix:AmericasSegmentMember2022-12-310001101239eqix:MI6MIAMIMETROMembereqix:AmericasSegmentMember2022-12-310001101239eqix:MO1MONTERREYMETROMEXICOMembereqix:AmericasSegmentMember2022-12-310001101239eqix:MT1MONTREALMETROCANADAMembereqix:AmericasSegmentMember2022-12-310001101239eqix:MT2MONTREALMETROCANADAMembereqix:AmericasSegmentMember2022-12-310001101239eqix:MX1MEXICOCITYMETROMEXICOMembereqix:AmericasSegmentMember2022-12-310001101239eqix:MX2MEXICOCITYMETROMEXICOMembereqix:AmericasSegmentMember2022-12-310001101239eqix:NY1NEWYORKMETROMembereqix:AmericasSegmentMember2022-12-310001101239eqix:NY2NEWYORKMETROMembereqix:AmericasSegmentMember2022-12-310001101239eqix:NY3NEWYORKMETROMembereqix:AmericasSegmentMember2022-12-310001101239eqix:NY4NEWYORKMETROMembereqix:AmericasSegmentMember2022-12-310001101239eqix:NY5NEWYORKMETROMembereqix:AmericasSegmentMember2022-12-310001101239eqix:NY6NEWYORKMETROMembereqix:AmericasSegmentMember2022-12-310001101239eqix:NY7NEWYORKMETROMembereqix:AmericasSegmentMember2022-12-310001101239eqix:NY9NEWYORKMETROMembereqix:AmericasSegmentMember2022-12-310001101239eqix:NY11NEWYORKMETROMembereqix:AmericasSegmentMember2022-12-310001101239eqix:NY13NEWYORKMETROMembereqix:AmericasSegmentMember2022-12-310001101239eqix:OT1OTTAWAMETROCANADAMembereqix:AmericasSegmentMember2022-12-310001101239eqix:PH1PHILADELPHIAMETROMembereqix:AmericasSegmentMember2022-12-310001101239eqix:RJ1RIODEJANEIROMETROBRAZILMembereqix:AmericasSegmentMember2022-12-310001101239eqix:RJ2RIODEJANEIROMETROBRAZILMembereqix:AmericasSegmentMember2022-12-310001101239eqix:SE2SEATTLEMETROMembereqix:AmericasSegmentMember2022-12-310001101239eqix:SE3SEATTLEMETROMembereqix:AmericasSegmentMember2022-12-310001101239eqix:SE4SEATTLEMETROMembereqix:AmericasSegmentMember2022-12-310001101239eqix:SJ1SAINTJOHNMETROCANADAMembereqix:AmericasSegmentMember2022-12-310001101239eqix:SP1SOPAULOMETROBRAZILMembereqix:AmericasSegmentMember2022-12-310001101239eqix:SP2SOPAULOMETROBRAZILMembereqix:AmericasSegmentMember2022-12-310001101239eqix:SP3SOPAULOMETROBRAZILMembereqix:AmericasSegmentMember2022-12-310001101239eqix:SP4SOPAULOMETROBRAZILMembereqix:AmericasSegmentMember2022-12-310001101239eqix:ST1SANTIAGOMETROCHILEMembereqix:AmericasSegmentMember2022-12-310001101239eqix:ST2SANTIAGOMETROCHILEMembereqix:AmericasSegmentMember2022-12-310001101239eqix:ST3SANTIAGOMETROCHILEMembereqix:AmericasSegmentMember2022-12-310001101239eqix:ST4SANTIAGOMETROCHILEMembereqix:AmericasSegmentMember2022-12-310001101239eqix:SV1SILICONVALLEYMETROMembereqix:AmericasSegmentMember2022-12-310001101239eqix:SV2SILICONVALLEYMETROMembereqix:AmericasSegmentMember2022-12-310001101239eqix:SV3SILICONVALLEYMETROMembereqix:AmericasSegmentMember2022-12-310001101239eqix:SV4SILICONVALLEYMETROMembereqix:AmericasSegmentMember2022-12-310001101239eqix:SV5SILICONVALLEYMETROMembereqix:AmericasSegmentMember2022-12-310001101239eqix:SV6SILICONVALLEYMETROMembereqix:AmericasSegmentMember2022-12-310001101239eqix:SV8SILICONVALLEYMETROMembereqix:AmericasSegmentMember2022-12-310001101239eqix:SV10SILICONVALLEYMETROMembereqix:AmericasSegmentMember2022-12-310001101239eqix:SV11SILICONVALLEYMETROMembereqix:AmericasSegmentMember2022-12-310001101239eqix:SV12SILICONVALLEYMETROMembereqix:AmericasSegmentMember2022-12-310001101239eqix:SV13SILICONVALLEYMETROMembereqix:AmericasSegmentMember2022-12-310001101239eqix:SV14SILICONVALLEYMETROMembereqix:AmericasSegmentMember2022-12-310001101239eqix:SV15SILICONVALLEYMETROMembereqix:AmericasSegmentMember2022-12-310001101239eqix:SV16SILICONVALLEYMETROMembereqix:AmericasSegmentMember2022-12-310001101239eqix:SV17SILICONVALLEYMETROMembereqix:AmericasSegmentMember2022-12-310001101239eqix:TR1TORONTOMETROCANADAMembereqix:AmericasSegmentMember2022-12-310001101239eqix:TR2TORONTOMETROCANADAMembereqix:AmericasSegmentMember2022-12-310001101239eqix:TR4TORONTOMETROCANADAMembereqix:AmericasSegmentMember2022-12-310001101239eqix:TR5MARKHAMMETROCANADAMembereqix:AmericasSegmentMember2022-12-310001101239eqix:TR6BRAMPTONMETROCANADAMembereqix:AmericasSegmentMember2022-12-310001101239eqix:TR7BRAMPTONMETROCANADAMembereqix:AmericasSegmentMember2022-12-310001101239eqix:VA1BURNABYMETROCANADAMembereqix:AmericasSegmentMember2022-12-310001101239eqix:WI1WINNIPEGMETROCANADAMembereqix:AmericasSegmentMember2022-12-310001101239eqix:OTHERSMembereqix:AmericasSegmentMember2022-12-310001101239eqix:AD1ABUDHABIMETROUNITEDARABEMIRATESMembereqix:EMEASegmentMember2022-12-310001101239eqix:EMEASegmentMembereqix:AM1AMSTERDAMMETROTHENETHERLANDSMember2022-12-310001101239eqix:EMEASegmentMembereqix:AM2AMSTERDAMMETROTHENETHERLANDSMember2022-12-310001101239eqix:EMEASegmentMembereqix:AM3AMSTERDAMMETROTHENETHERLANDSMember2022-12-310001101239eqix:AM4AMSTERDAMMETROTHENETHERLANDSMembereqix:EMEASegmentMember2022-12-310001101239eqix:AM5AMSTERDAMMETROTHENETHERLANDSMembereqix:EMEASegmentMember2022-12-310001101239eqix:EMEASegmentMembereqix:AM6AMSTERDAMMETROTHENETHERLANDSMember2022-12-310001101239eqix:EMEASegmentMembereqix:AM7AMSTERDAMMETROTHENETHERLANDSMember2022-12-310001101239eqix:EMEASegmentMembereqix:AM8AMSTERDAMMETROTHENETHERLANDSMember2022-12-310001101239eqix:AM11AMSTERDAMMETROTHENETHERLANDSMembereqix:EMEASegmentMember2022-12-310001101239eqix:BA1BARCELONAMETROSPAINMembereqix:EMEASegmentMember2022-12-310001101239eqix:BA2BARCELONAMETROSPAINMembereqix:EMEASegmentMember2022-12-310001101239eqix:EMEASegmentMembereqix:BX1BORDEAUXMETROSPAINMember2022-12-310001101239eqix:DB1DUBLINMETROIRELANDMembereqix:EMEASegmentMember2022-12-310001101239eqix:EMEASegmentMembereqix:DB2DUBLINMETROIRELANDMember2022-12-310001101239eqix:EMEASegmentMembereqix:DB3DUBLINMETROIRELANDMember2022-12-310001101239eqix:DB4DUBLINMETROIRELANDMembereqix:EMEASegmentMember2022-12-310001101239eqix:DU1DSSELDORFMETROGERMANYMembereqix:EMEASegmentMember2022-12-310001101239eqix:DX1DUBAIMETROUNITEDARABEMIRATESMembereqix:EMEASegmentMember2022-12-310001101239eqix:EMEASegmentMembereqix:DX2DUBAIMETROUNITEDARABEMIRATESMember2022-12-310001101239eqix:EMEASegmentMembereqix:DX3DUBAIMETROUNITEDARABEMIRATESMember2022-12-310001101239eqix:EMEASegmentMembereqix:EN1ENSCHEDEMETROTHENETHERLANDSMember2022-12-310001101239eqix:EMEASegmentMembereqix:FR2FRANKFURTMETROGERMANYMember2022-12-310001101239eqix:EMEASegmentMembereqix:FR4FRANKFURTMETROGERMANYMember2022-12-310001101239eqix:FR5FRANKFURTMETROGERMANYMembereqix:EMEASegmentMember2022-12-310001101239eqix:EMEASegmentMembereqix:FR6FRANKFURTMETROGERMANYMember2022-12-310001101239eqix:EMEASegmentMembereqix:FR7FRANKFURTMETROGERMANYMember2022-12-310001101239eqix:FR8FRANKFURTMETROGERMANYMembereqix:EMEASegmentMember2022-12-310001101239eqix:FR13FRANKFURTMETROGERMANYMembereqix:EMEASegmentMember2022-12-310001101239eqix:EMEASegmentMembereqix:GN1GENOAMETROITALYMember2022-12-310001101239eqix:GV1GENEVAMETROSWITZERLANDMembereqix:EMEASegmentMember2022-12-310001101239eqix:EMEASegmentMembereqix:GV2GENEVAMETROSWITZERLANDMember2022-12-310001101239eqix:HE3HELSINKIMETROFINLANDMembereqix:EMEASegmentMember2022-12-310001101239eqix:EMEASegmentMembereqix:HE4HELSINKIMETROFINLANDMember2022-12-310001101239eqix:EMEASegmentMembereqix:HE5HELSINKIMETROFINLANDMember2022-12-310001101239eqix:EMEASegmentMembereqix:HE6HELSINKIMETROFINLANDMember2022-12-310001101239eqix:HE7HELSINKIMETROFINLANDMembereqix:EMEASegmentMember2022-12-310001101239eqix:HH1HAMBURGMETROGERMANYMembereqix:EMEASegmentMember2022-12-310001101239eqix:IL2ISTANBULMETROTURKEYMembereqix:EMEASegmentMember2022-12-310001101239eqix:EMEASegmentMembereqix:LD3LONDONMETROUNITEDKINGDOMMember2022-12-310001101239eqix:LD4LONDONMETROUNITEDKINGDOMMembereqix:EMEASegmentMember2022-12-310001101239eqix:EMEASegmentMembereqix:LD5LONDONMETROUNITEDKINGDOMMember2022-12-310001101239eqix:LD6LONDONMETROUNITEDKINGDOMMembereqix:EMEASegmentMember2022-12-310001101239eqix:EMEASegmentMembereqix:LD7LONDONMETROUNITEDKINGDOMMember2022-12-310001101239eqix:LD8LONDONMETROUNITEDKINGDOMMembereqix:EMEASegmentMember2022-12-310001101239eqix:LD9LONDONMETROUNITEDKINGDOMMembereqix:EMEASegmentMember2022-12-310001101239eqix:LD10LONDONMETROUNITEDKINGDOMMembereqix:EMEASegmentMember2022-12-310001101239eqix:LS1LISBONMETROPORTUGALMembereqix:EMEASegmentMember2022-12-310001101239eqix:EMEASegmentMembereqix:LAGOS1METROPORTUGALMember2022-12-310001101239eqix:MA1MANCHESTERMETROUNITEDKINGDOMMembereqix:EMEASegmentMember2022-12-310001101239eqix:MA2MANCHESTERMETROUNITEDKINGDOMMembereqix:EMEASegmentMember2022-12-310001101239eqix:EMEASegmentMembereqix:MA3MANCHESTERMETROUNITEDKINGDOMMember2022-12-310001101239eqix:EMEASegmentMembereqix:MA4MANCHESTERMETROUNITEDKINGDOMMember2022-12-310001101239eqix:EMEASegmentMembereqix:MA5MANCHESTERMETROUNITEDKINGDOMMember2022-12-310001101239eqix:EMEASegmentMembereqix:MD1MADRIDMETROSPAINMember2022-12-310001101239eqix:EMEASegmentMembereqix:MD2MADRIDMETROSPAINMember2022-12-310001101239eqix:EMEASegmentMembereqix:MD6MADRIDMETROSPAINMember2022-12-310001101239eqix:ML2MILANMETROITALYMembereqix:EMEASegmentMember2022-12-310001101239eqix:ML3MILANMETROITALYMembereqix:EMEASegmentMember2022-12-310001101239eqix:ML5MILANMETROITALYMembereqix:EMEASegmentMember2022-12-310001101239eqix:EMEASegmentMembereqix:MU1MUNICHMETROGERMANYMember2022-12-310001101239eqix:EMEASegmentMembereqix:MU3MUNICHMETROGERMANYMember2022-12-310001101239eqix:MU4MUNICHMETROGERMANYMembereqix:EMEASegmentMember2022-12-310001101239eqix:EMEASegmentMembereqix:PA2PA3PARISMETROFRANCEMember2022-12-310001101239eqix:PA4PARISMETROFRANCEMembereqix:EMEASegmentMember2022-12-310001101239eqix:EMEASegmentMembereqix:PA5PARISMETROFRANCEMember2022-12-310001101239eqix:PA6PARISMETROFRANCEMembereqix:EMEASegmentMember2022-12-310001101239eqix:EMEASegmentMembereqix:PA7PARISMETROFRANCEMember2022-12-310001101239eqix:PA10PARISMETROFRANCEMembereqix:EMEASegmentMember2022-12-310001101239eqix:EMEASegmentMembereqix:SA1SEVILLEMETROSPAINMember2022-12-310001101239eqix:EMEASegmentMembereqix:SK1STOCKHOLMMETROSWEDENMember2022-12-310001101239eqix:EMEASegmentMembereqix:SK2STOCKHOLMMETROSWEDENMember2022-12-310001101239eqix:EMEASegmentMembereqix:SK3STOCKHOLMMETROSWEDENMember2022-12-310001101239eqix:EMEASegmentMembereqix:SO1SOFIAMETROBULGARIAMember2022-12-310001101239eqix:SO2SOFIAMETROPOLANDMembereqix:EMEASegmentMember2022-12-310001101239eqix:WA1WARSAWMETROPOLANDMembereqix:EMEASegmentMember2022-12-310001101239eqix:EMEASegmentMembereqix:WA2WARSAWMETROPOLANDMember2022-12-310001101239eqix:EMEASegmentMembereqix:WA3WARSAWMETROPOLANDMember2022-12-310001101239eqix:EMEASegmentMembereqix:ZH2ZURICHMETROSWITZERLANDMember2022-12-310001101239eqix:ZH4ZURICHMETROSWITZERLANDMembereqix:EMEASegmentMember2022-12-310001101239eqix:ZH5ZURICHMETROSWITZERLANDMembereqix:EMEASegmentMember2022-12-310001101239eqix:ZW1ZWOLLEMETROTHENETHERLANDSMembereqix:EMEASegmentMember2022-12-310001101239eqix:OTHERSMembereqix:EMEASegmentMember2022-12-310001101239eqix:AE1ADELAIDEMETROAUSTRAILIAMembereqix:AsiaPacificSegmentMember2022-12-310001101239eqix:BR1BRISBANEMETROAUSTRALIAMembereqix:AsiaPacificSegmentMember2022-12-310001101239eqix:AsiaPacificSegmentMembereqix:CA1CANBERRAMETROAUSTRALIAMember2022-12-310001101239eqix:AsiaPacificSegmentMembereqix:CN1CHENNAIMETROINDIAMember2022-12-310001101239eqix:HK1HONGKONGMETROCHINAMembereqix:AsiaPacificSegmentMember2022-12-310001101239eqix:HK2HONGKONGMETROCHINAMembereqix:AsiaPacificSegmentMember2022-12-310001101239eqix:HK3HONGKONGMETROCHINAMembereqix:AsiaPacificSegmentMember2022-12-310001101239eqix:HK4HONGKONGMETROCHINAMembereqix:AsiaPacificSegmentMember2022-12-310001101239eqix:HK5HONGKONGMETROCHINAMembereqix:AsiaPacificSegmentMember2022-12-310001101239eqix:MB1MUMBAIMETROINDIAMembereqix:AsiaPacificSegmentMember2022-12-310001101239eqix:MB2MUMBAIMETROINDIAMembereqix:AsiaPacificSegmentMember2022-12-310001101239eqix:MB3MUMBAIMETROINDIAMembereqix:AsiaPacificSegmentMember2022-12-310001101239eqix:AsiaPacificSegmentMembereqix:ME1MELBOURNEMETROAUSTRALIAMember2022-12-310001101239eqix:ME2MELBOURNEMETROAUSTRALIAMembereqix:AsiaPacificSegmentMember2022-12-310001101239eqix:ME4MELBOURNEMETROAUSTRALIAMembereqix:AsiaPacificSegmentMember2022-12-310001101239eqix:ME5MELBOURNEMETROAUSTRALIAMembereqix:AsiaPacificSegmentMember2022-12-310001101239eqix:OS1OSAKAMETROJAPANMembereqix:AsiaPacificSegmentMember2022-12-310001101239eqix:AsiaPacificSegmentMembereqix:OS3OSAKAMETROJAPANMember2022-12-310001101239eqix:PE1PERTHMETROAUSTRALIAMembereqix:AsiaPacificSegmentMember2022-12-310001101239eqix:PE2PERTHMETROAUSTRALIAMembereqix:AsiaPacificSegmentMember2022-12-310001101239eqix:PE3PERTHMETROAUSTRALIAMembereqix:AsiaPacificSegmentMember2022-12-310001101239eqix:SG1SINGAPOREMETROMembereqix:AsiaPacificSegmentMember2022-12-310001101239eqix:AsiaPacificSegmentMembereqix:SG2SINGAPOREMETROMember2022-12-310001101239eqix:AsiaPacificSegmentMembereqix:SG3SINGAPOREMETROMember2022-12-310001101239eqix:AsiaPacificSegmentMembereqix:SG4SINGAPOREMETROMember2022-12-310001101239eqix:SG5SINGAPOREMETROMembereqix:AsiaPacificSegmentMember2022-12-310001101239eqix:SH2SHANGHAIMETROCHINAMembereqix:AsiaPacificSegmentMember2022-12-310001101239eqix:AsiaPacificSegmentMembereqix:SH3SHANGHAIMETROCHINAMember2022-12-310001101239eqix:AsiaPacificSegmentMembereqix:SH5SHANGHAIMETROCHINAMember2022-12-310001101239eqix:AsiaPacificSegmentMembereqix:SH6SHANGHAIMETROCHINAMember2022-12-310001101239eqix:AsiaPacificSegmentMembereqix:SL1SeoulMetroSouthKoreaMember2022-12-310001101239eqix:SY1SYDNEYMETROAUSTRALIAMembereqix:AsiaPacificSegmentMember2022-12-310001101239eqix:SY2SYDNEYMETROAUSTRALIAMembereqix:AsiaPacificSegmentMember2022-12-310001101239eqix:SY3SYDNEYMETROAUSTRALIAMembereqix:AsiaPacificSegmentMember2022-12-310001101239eqix:SY4SYDNEYMETROAUSTRALIAMembereqix:AsiaPacificSegmentMember2022-12-310001101239eqix:SY5SYDNEYMETROAUSTRALIAMembereqix:AsiaPacificSegmentMember2022-12-310001101239eqix:AsiaPacificSegmentMembereqix:SY6SYDNEYMETROAUSTRALIAMember2022-12-310001101239eqix:SY7SYDNEYMETROAUSTRALIAMembereqix:AsiaPacificSegmentMember2022-12-310001101239eqix:TY1TOKYOMETROJAPANMembereqix:AsiaPacificSegmentMember2022-12-310001101239eqix:AsiaPacificSegmentMembereqix:TY2TOKYOMETROJAPANMember2022-12-310001101239eqix:TY3TOKYOMETROJAPANMembereqix:AsiaPacificSegmentMember2022-12-310001101239eqix:AsiaPacificSegmentMembereqix:TY4TOKYOMETROJAPANMember2022-12-310001101239eqix:TY5TOKYOMETROJAPANMembereqix:AsiaPacificSegmentMember2022-12-310001101239eqix:AsiaPacificSegmentMembereqix:TY6TOKYOMETROJAPANMember2022-12-310001101239eqix:TY7TOKYOMETROJAPANMembereqix:AsiaPacificSegmentMember2022-12-310001101239eqix:TY8TOKYOMETROJAPANMembereqix:AsiaPacificSegmentMember2022-12-310001101239eqix:TY9TOKYOMETROJAPANMembereqix:AsiaPacificSegmentMember2022-12-310001101239eqix:TY10TOKYOMETROJAPANMembereqix:AsiaPacificSegmentMember2022-12-310001101239eqix:TY11TOKYOMETROJAPANMembereqix:AsiaPacificSegmentMember2022-12-310001101239eqix:AsiaPacificSegmentMembereqix:TY15TOKYOMETROJAPANMember2022-12-310001101239eqix:OTHERSMembereqix:AsiaPacificSegmentMember2022-12-310001101239eqix:LesseeOperatingLeaseMember2022-12-31
UNITED STATES
SECURITIES AND EXCHANGE COMMISSION
WASHINGTON, D.C. 20549
__________________________
FORM 10-K
| | | | | |
| ☒ | ANNUAL REPORT PURSUANT TO SECTION 13 OR 15(d) OF THE SECURITIES EXCHANGE ACT OF 1934 |
For the fiscal year ended December 31, 2022
OR
| | | | | |
| ☐ | TRANSITION REPORT PURSUANT TO SECTION 13 OR 15(d) OF THE SECURITIES EXCHANGE ACT OF 1934 |
For the transition period from _____________ to _____________
Commission file number 001-40205
______________________
EQUINIX, INC.
(Exact name of registrant as specified in its charter)
| | | | | | | | |
| Delaware | | 77-0487526 |
(State of incorporation) | | (IRS Employer Identification No.) |
One Lagoon Drive, Redwood City, California 94065
(Address of principal executive offices, including ZIP code)
(650) 598-6000
(Registrant's telephone number, including area code)
Securities registered pursuant to Section 12(b) of the Act:
| | | | | | | | | | | | | | |
| Title of each class | | Trading Symbol | | Name of each exchange on which registered |
| Common Stock, $0.001 | | EQIX | | The Nasdaq Stock Market LLC |
| 0.250% Senior Notes due 2027 | | | | The Nasdaq Stock Market LLC |
| 1.000% Senior Notes due 2033 | | | | The Nasdaq Stock Market LLC |
Securities registered pursuant to Section 12(g) of the Act: None
Indicate by check mark if the registrant is a well-known seasoned issuer, as defined in Rule 405 of the Act. Yes ☒ No ☐
Indicate by check mark if the registrant is not required to file reports pursuant to Section 13 or Section 15(d) of the Act. Yes ☐ No ☒
Indicate by check mark whether the registrant (1) has filed all reports required to be filed by Section 13 or 15(d) of the Securities Exchange Act of 1934 during the preceding 12 months (or for such shorter period that the registrant was required to file such reports), and (2) has been subject to such filing requirements for the past 90 days. Yes ☒ No ☐
Indicate by check mark whether the registrant has submitted electronically every Interactive Data File required to be submitted pursuant to Rule 405 of Regulation S-T (§ 232.405 of this chapter) during the preceding 12 months (or for such shorter period that the registrant was required to submit and post such files). Yes ☒ No ☐
Indicate by check mark whether the registrant is a large accelerated filer, an accelerated filer, a non-accelerated filer, a smaller reporting company, or an emerging growth company. See definitions of "large accelerated filer," "accelerated filer," "smaller reporting company," and "emerging growth company" in Rule 12b-2 of the Exchange Act.
| | | | | | | | | | | |
| Large accelerated filer | ☒ | Accelerated filer | ☐ |
| | | |
| Non-accelerated filer | ☐ | Smaller reporting company | ☐ |
| | | |
| | Emerging growth company | ☐ |
If an emerging growth company, indicate by check mark if the registrant has elected not to use the extended transition period for complying with any new or revised financial accounting standards provided pursuant to Section 13(a) of the Exchange Act. ☐
Indicate by check mark whether the registrant has filed a report on and attestation to its management’s assessment of the effectiveness of its internal control over financial reporting under Section 404(b) of the Sarbanes-Oxley Act (15 U.S.C. 7262(b)) by the registered public accounting firm that prepared or issued its audit report. ☒
Indicate by check mark whether the registrant is a shell company (as defined in Rule 12b-2 of the Exchange Act). Yes ☐ No ☒
The aggregate market value of the voting and non-voting common stock held by non-affiliates computed by reference to the price at which the common stock was last sold as of the last business day of the registrant's most recently completed second fiscal quarter was approximately $60.0 billion. As of February 16, 2023, a total of 92,744,713 shares of the registrant's common stock were outstanding.
DOCUMENTS INCORPORATED BY REFERENCE
Part III – Portions of the registrant's definitive proxy statement to be issued in conjunction with the registrant's 2023 Annual Meeting of Stockholders, which is expected to be filed not later than 120 days after the registrant's fiscal year ended December 31, 2022. Except as expressly incorporated by reference, the registrant's proxy statement shall not be deemed to be a part of this report on Form 10-K.
TABLE OF CONTENTS
| | | | | | | | |
| EQUINIX, INC. | |
| FORM 10-K | |
| December 31, 2022 | |
| | |
| Item | | Page No. |
| | |
| | |
| 1. | | |
1A. | | |
1B. | | |
| 2. | | |
| 3. | | |
| 4. | | |
| | |
| 5. | | |
| 6. | Reserved | |
| 7. | | |
7A. | | |
| 8. | | |
| 9. | | |
9A. | | |
9B. | | |
9C. | | |
| | |
| 10. | | |
| 11. | | |
| 12. | | |
| 13. | | |
| 14. | | |
| | |
| 15. | | |
| 16. | | |
| | |
| | |
PART I
Forward-Looking Statements
The words "Equinix", "we", "our", "ours", "us" and the "Company" refer to Equinix, Inc. All statements in this discussion that are not historical are forward-looking statements within the meaning of Section 21E of the Securities Exchange Act of 1934, as amended, including statements regarding Equinix's "expectations", "beliefs", "intentions", "strategies", "forecasts", "predictions", "plans" or the like. Such statements are based on management's current expectations and are subject to a number of factors and uncertainties that could cause actual results to differ materially from those described in the forward-looking statements. Equinix cautions investors that there can be no assurance that actual results or business conditions will not differ materially from those projected or suggested in such forward-looking statements as a result of various factors, including, but not limited to, the risk factors discussed in this Annual Report on Form 10-K. Equinix expressly disclaims any obligation or undertaking to release publicly any updates or revisions to any forward looking statements contained herein to reflect any change in Equinix's expectations with regard thereto or any change in events, conditions, or circumstances on which any such statements are based.
Summary of Risk Factors
Our business is subject to numerous risks and uncertainties that make an investment in our securities speculative or risky, any one of which could materially adversely affect our results of operations, financial condition or business. These risks include, but are not limited to, those listed below. This list is not complete, and should be read together with the section titled “Risk Factors” in this Annual Report on Form 10-K, as well as the other information in this Annual Report on Form 10-K and the other filings that we make with the U.S. Securities and Exchange Commission (the “SEC”).
Risks Related to the Macro Environment
•Inflation in the global economy, increased interest rates and adverse global economic conditions, like the ones we are currently experiencing, could negatively affect our business and financial condition.
•We are currently operating in a period of economic uncertainty and capital markets disruption, which has been the result of many global macro-economic factors including the ongoing military conflict between Russia and Ukraine. These macro-economic and other factors could negatively affect our business and financial condition.
•Our business could be harmed by increased costs to procure power, prolonged power outages, shortages or capacity constraints as well as restrictions on access to power.
Risks Related to our Operations
•We experienced an information technology security breach in the past and may be vulnerable to future security breaches, which could disrupt our operations and have a material adverse effect on our business, results of operation and financial condition.
•Any failure of our physical infrastructure or negative impact on our ability to meet our obligations to our customers, or damage to customer infrastructure within our IBX data centers, could lead to significant costs and disruptions that could reduce our revenue and harm our business reputation and financial condition.
•We are currently making significant investments in our back-office information technology systems and processes. Difficulties from or disruptions to these efforts may interrupt our normal operations and adversely affect our business and results of operations.
•The level of insurance coverage that we purchase may prove to be inadequate.
•If we are unable to implement our evolving organizational structure or if we are unable to recruit or retain key executives and qualified personnel, our business could be harmed.
•The failure to obtain favorable terms when we renew our IBX data center leases, or the failure to renew such leases, could harm our business and results of operations.
•We depend on a number of third parties to provide internet connectivity to our IBX data centers; if connectivity is interrupted or terminated, our results of operations and cash flow could be materially and adversely affected.
•The use of high power density equipment may limit our ability to fully utilize our older IBX data centers.
Risks Related to our Offerings and Customers
•Our offerings have a long sales cycle that may harm our revenue and results of operations.
•We may not be able to compete successfully against current and future competitors.
•If we cannot continue to develop, acquire, market and provide new offerings or enhancements to existing offerings that meet customer requirements and differentiate us from our competitors, our results of operations could suffer.
•We have government customers, which subjects us to risks including early termination, audits, investigations, sanctions and penalties.
•Because we depend on the development and growth of a balanced customer base, including key magnet customers, failure to attract, grow and retain this base of customers could harm our business and results of operations.
•Industry consolidation may have a negative impact on our business model.
Risks Related to our Financial Results
•Our results of operations may fluctuate.
•We may incur goodwill and other intangible asset impairment charges, or impairment charges to our property, plant and equipment, which could result in a significant reduction to our earnings.
•We have incurred substantial losses in the past and may incur additional losses in the future.
Risks Related to Our Expansion Plans
•Our construction of new IBX data centers or IBX data center expansions could involve significant risks to our business.
•Acquisitions present many risks, and we may not realize the financial or strategic goals that were contemplated at the time of any transaction.
•The anticipated benefits of our joint ventures may not be fully realized, or take longer to realize than expected.
•Joint venture investments could expose us to risks and liabilities in connection with the formation of the new joint ventures, the operation of such joint ventures without sole decision-making authority, and our reliance on joint venture partners who may have economic and business interests that are inconsistent with our business interests.
•If we cannot effectively manage our international operations, and successfully implement our international expansion plans, or comply with evolving laws and regulations, our revenues may not increase, our costs may increase and our business and results of operations would be harmed.
•We continue to invest in our expansion efforts but may not have sufficient customer demand in the future to realize expected returns on these investments.
Risks Related to Our Capital Needs and Capital Strategy
•Our substantial debt could adversely affect our cash flows and limit our flexibility to raise additional capital.
•Sales or issuances of shares of our common stock may adversely affect the market price of our common stock.
•If we are not able to generate sufficient operating cash flows or obtain external financing, our ability to fund incremental expansion plans may be limited.
•Our derivative transactions expose us to counterparty credit risk.
Risks Related to Environmental Laws and Climate Change Impacts
•Environmental regulations may impose upon us new or unexpected costs.
•Our business may be adversely affected by climate change and responses to it.
•We may fail to achieve our environmental goals which may adversely affect public perception of our business and affect our relationship with our customers, our stockholders and/or other stakeholders.
Risks Related to Certain Regulations and Laws, Including Tax Laws
•Changes in U.S. or foreign tax laws, regulations, or interpretations thereof, including changes to tax rates, may adversely affect our financial statements and cash taxes.
•Government regulation or failure to comply with laws and regulations may adversely affect our business.
•Our business could be adversely affected if we are unable to maintain our complex global legal entity structure.
Risks Related to Our REIT Status in the US
•We have a number of risks related to our qualification as a real estate investment trust for federal income tax purposes ("REIT"), including the risk that we may not be able to maintain our qualification as a REIT which could expose us to substantial corporate income tax and have a materially adverse effect on our business, financial condition, and results of operations.
ITEM 1. Business
Overview: Powering the World’s Digital Leaders
Equinix is the world's digital infrastructure companyTM. Digital leaders harness our trusted platform to bring together and interconnect the foundational infrastructure that powers their success. We enable our customers to access all the right places, partners and possibilities they need to accelerate their advantage. Platform Equinix® combines a global footprint of International Business Exchange™ ("IBX®") and xScale® data centers in the Americas, Asia-Pacific, and Europe, the Middle East and Africa ("EMEA") regions, interconnection solutions, digital offerings, unique business and digital ecosystems and expert consulting and support. Equinix was incorporated on June 22, 1998, as a Delaware corporation and operates as a REIT for federal income tax purposes.
Al Avery and Jay Adelson founded Equinix as a network-neutral, multi-tenant data center ("MTDC") provider, where competing networks could connect and share data traffic to help scale the rapid growth of the early internet. The company’s name, Equinix (composed from the words "equality", "neutrality" and "internet exchange"), reflects that vision. The founders also believed they not only had the opportunity but also the responsibility to create a company that would be the steward of some of the most important digital infrastructure assets in the world. Nearly two and a half decades later, we have expanded upon that vision to build Platform Equinix, which we believe is unmatched in scale and reach.
Our interconnected data centers around the world allow our customers to bring together and interconnect the infrastructure they need to fast-track their digital advantage. With Equinix, they can scale with agility, speed the launch of digital offerings, deliver world-class experiences and multiply their value. We enable them to differentiate by distributing infrastructure and removing the distance between clouds, users and applications in order to reduce latency and deliver a superior customer, partner and employee experience. The Equinix global platform, and the quality of our IBX and xScale data centers, interconnection offerings and edge solutions, have enabled us to establish a critical mass of customers. As more customers choose Platform Equinix for bandwidth cost and performance reasons, it benefits their suppliers and business partners to colocate in the same data centers and connect directly with each other. This adjacency creates a network effect that attracts new customers, continuously compounds our existing customers' value and enables them to capture further economic and performance benefits from our offerings.
In 2022, we opened or acquired 13 new IBX data centers, opened three new xScale data centers via our joint ventures, and entered three new markets resulting in an increase in our total number of IBX and xScale data center facilities to 248. 2022 highlights include:
•New data center openings included 13 new IBX sites in the following metros: Abidjan, Accra, Genoa, Lagos, Lima, Munich, Manchester, Paris and Santiago.
•Three additional xScale sites opened in 2022 in Frankfurt, Dublin and Sydney, bringing our total number of xScale data centers to 11. xScale data centers serve the needs of the growing hyperscale data center market, including the world's largest cloud service providers, and are engineered to meet the technical and operational requirements and price points of core hyperscale workload deployments. xScale data centers also offer access to our comprehensive suite of interconnection and edge offerings that tie into the hyperscale companies' existing access points at Equinix, thereby increasing the speed of connectivity to their existing and future enterprise customers. In xScale sites, hyperscale companies can consolidate core and access point deployments into one global provider to streamline and simplify their growth.
•In December, we announced plans to enter the South Africa market with a $160 million IBX data center investment in Johannesburg that augments our current footprint on the African continent. With our South Africa expansion, Equinix is entering one of the largest and most digitally developed nations on the African continent. The new data center is expected to open in the middle of 2024.
•In November, we announced plans to enter the Malaysia market with a $40 million IBX data center investment. Equinix's expansion in Malaysia will offer opportunities for Malaysian businesses expanding internationally and for multinational corporations pursuing growth and innovation in the Malaysian market. Located in Johor, the new data center is expected to open in the first half of 2024.
•In October, we announced our plans for expansion into Indonesia, with an approximately $74 million IBX data center investment in the heart of Jakarta. Driven by rapid business digitalization and a substantial digital-savvy population, Indonesia has emerged as Southeast Asia's largest digital economy in value, and is expected to be a key hub of interconnection in the region.
•We also announced in October a $45 million investment in a new facility in Bogota, Colombia, scheduled to open in the first half of 2023. This will be our second data center in Colombia and further reinforces Equinix’s commitment to strengthening the digital economy across Latin America.
•In September, we opened a new IBX data center in Paris, France. Part of Equinix's Saint-Denis campus, the new site ("PA10") represents the tenth data center opened by Equinix in Paris. The new $163 million facility will incorporate multiple sustainability best practices, including heat recovery technology directly connected to Paris’s Saint-Denis urban heating network.
•In August, we completed our acquisition of a data center in Lima, Peru, from Empresa Nacional De Telecomunicaciones S.A. ("Entel"), a leading Chilean telecommunications provider, for a total purchase consideration of $80.3 million at the exchange rate in effect on the date of signing.
•In June, Equinix and PGIM Real Estate, the real estate investment and financing arm of PGIM, Prudential Financial's global asset management business, opened the first xScale data center in Sydney ("SY9x"). This milestone followed the closing of the $575 million joint venture between the parties in March of 2022.
•Extending our presence deeper into Latin America in May, we completed the acquisition of four data centers in Chile, from Entel, for a total purchase consideration of $638.3 million at the exchange rate in effect on the date of signing.
•In April, we entered Africa, closing on our $278.4 million acquisition of MainOne, a leading West African data center and connectivity solutions provider, with presence in Nigeria, Ghana and Côte d'Ivoire. The completion of the acquisition augmented Equinix's long-term strategy to become a leading African carrier-neutral digital infrastructure company by being able to bring a full range of transformative technologies and connectivity to Nigeria, Ghana and Cote d'Ivoire.
•Our new IBX data center in Aschheim, near Munich, Germany (“MU4”), opened in February to support the growing digital needs of local companies—particularly from the automotive, industrial, financial and healthcare sectors—providing them with direct, secure and fast connectivity to a multitude of cloud providers, services and partners. Like other new Equinix builds in Germany, it was designed in line with Equinix’s global sustainability strategy, featuring a green façade and partially planted roof. Additionally, the data center is expected to be powered by 100% renewable energy—purchased through a green power certificate from local supplier, Mainova.
•In January, we signed a joint venture agreement with GIC in Singapore to develop and operate two xScale data centers in Seoul, Korea. The joint venture will bring our global xScale data center portfolio to more than $8 billion across 36 facilities.
Industry Trends: Large-scale global trends are driving a digital-first strategy
Digital transformation is changing where and how businesses deploy and deliver IT services to employees and is creating new digital business models for partners and customers. The convergence of these global trends has created additional pressure for many companies to transform. The collective influence of these trends is driving complexity and risk that must be addressed in multiple locations for companies to effectively compete in the global digital economy. These trends include:
•The digital presence trend underpins businesses’ prioritization of transformation to engage and deliver value electronically. To compete in the digital economy, organizations are shifting to digital solutions. Digital transformation investment levels for 2022–2024 are expected to be $6.3 trillion and 55% of all Information and Communication Technology ("ICT") investment by the end of 2024. This forces the need for a digital infrastructure optimized for proximity to, and interconnection with, networks and clouds. This in turn enables digital development with elastic scale. IT becomes a revenue-generating function and the basis of competitive advantage for developing connected product bundles.
•The digital participation trend is digitizing trade and accessing digital marketplaces (digital B2B commerce) where goods and services are exchanged in the digital economy. Leveraging ecosystem and network effects optimizes collaboration and compounds business value. By 2023, it is expected that one in two companies will generate more than 40% of their revenues from digital products and services. The Global Interconnection Index 2023 ("GXI 2023"), a market study published by Equinix, shows that this forces the need to interconnect digital infrastructure with research communities, supply chains and marketplaces, enabling composable business models. IT becomes a business technology broker across an ecosystem of digital solutions and facilitates collaboration with network effects.
•The digital proximity trend means digitizing the front office for localized and personalized delivery—to customers, employees and operations where business happens, as well as digitizing the physical world for the physical infrastructure and operations intelligence needed to optimize commercial and environmental impact. By 2028, the global infrastructure edge footprint is expected to be 40 gigawatts, with 63% supporting healthcare, manufacturing, energy, retail and transportation. IT becomes fully integrated with operational technology ("OT") to balance transparency, efficiency and sustainability with greater mobility, security and control.
•The sustainability trend means that companies are now being held accountable by investors, employees and customers to demonstrate progress on Environmental, Social and Governance ("ESG") commitments. Sustainability is believed to be important by 90% of executives, but only 60% of organizations have sustainability strategies. These strategies include setting and measuring sustainability goals through science-based targets and key initiatives. IT must subscribe to the most efficient commodity solutions from sustainability leaders.
These trends are accelerating the need for companies like Equinix that can provide a secure, agile global business platform that leverages digital interconnection—or private data exchange—to deliver real-time interactions around the world.
As part of their digital transformation, businesses in most industries are shifting their centralized IT infrastructures to the edge to bring digital solutions closer to users for better performance, which has become a significant driver of digital business value. To realize the full potential of the edge, IT organizations require greater interconnection bandwidth. Interconnection bandwidth is defined as the total capacity provisioned to privately and directly exchange traffic, with a diverse set of partners and providers, at distributed IT exchange points inside carrier-neutral colocation data centers. Private interconnection capacity between businesses, as reported in GXI 2023, is anticipated to grow at a compound annual growth rate of 40% by 2025, reaching 27,762 terabits per second of data exchanged annually.
Worldwide Interconnection Bandwidth Capacity Growth (2020 - 2025) in Terabits per Second (Tbps)
Source: GXI 2023
Equinix Business Proposition: To be the platform where the world comes together, enabling the innovations that enrich our work, life and planet
In 2022, we continued to build new digital and data center offerings to further our vision to power the world’s digital leaders. On Platform Equinix, digital leaders can reach the most strategic global markets with the largest ecosystem of digital partners, with infrastructure that assembles and deploys virtually in minutes. We enable competitive advantage for our customers and partners by creating the foundational infrastructure capabilities that power worldwide businesses. We offer a comprehensive, integrated suite of data center and digital solutions and products to over 10,000 enterprise and service provider customers worldwide.
The following are the leading revenue-generating product and other offerings that collectively make up Platform Equinix:
Data Center Offerings
Our global, state-of-the-art data centers meet strict standards of security, reliability, certification and sustainability. Offerings in these data centers are typically billed based on the space and power a customer consumes, are delivered under a fixed duration contract and generate monthly recurring revenue ("MRR"). Our footprint consists of 248 data centers:
•International Business Exchange Data Centers are our vendor-neutral colocation data centers worldwide, providing our customers with secure, reliable and robust environments (including space and power) that are necessary to aggregate and distribute information and connect digital and business
ecosystems globally. IBX data centers provide access to vital ecosystems where enterprises, network, cloud and SaaS providers, and business partners, can directly and securely interconnect to each other.
•xScale Data Centers are designed to serve the unique core workload deployment needs of a targeted group of hyperscale companies, which include the world's largest cloud service providers. With xScale data centers, hyperscale customers add to their core hyperscale data center deployments and existing customer access points at Equinix, allowing streamlined expansion with a single global vendor.
Equinix colocation offerings include a suite of comprehensive solutions that provide all the components required by a customer to house its IT infrastructure (or equipment). These offerings are designed to speed and streamline digital transformation and data center deployments for our customers.
•Private Cages are typically designed and built to order for a single customer, with space assigned based on purchased power allocations and planned cabinet quantity. A cage typically includes steel mesh walls with a locking door, interconnection provision such as a demarcation rack with patch panels, and cabling systems such as a ladder rack and fiber raceway. Available security accessories include dedicated cameras, biometric hand scanners and more.
•Secure Cabinets are steel-framed cabinets sized to industry standards, with lockable, fully ventilated doors, and are typically configured to order. Secure Cabinets provide a private, secure, smaller-footprint alternative to a Private Cage. Each cabinet includes an integrated, interconnection-ready demarcation panel and power circuitry sufficient to support planned utilization requirements. Secure cabinets are typically housed in a shared, secured cage within the data center facility.
•Secure Cabinet Express are ready-for-service Secure Cabinets which are pre-configured to an Equinix recommended, and most common, cabinet configuration. This configuration fits the majority of modern IT deployment requirements, providing a simplified and globally consistent colocation module for cabinet-sized deployments.
Equinix offers a variety of enabling solutions which support a customer's need to implement, operate and maintain their colocated deployments. These solutions include both on-consumption and subscription services which may generate monthly recurring revenue ("MRR") as well as non-recurring revenue ("NRR").
•IBX SmartView® is a fully integrated monitoring software which provides customers visibility into the operating data relevant to their specific Equinix footprint as if they were in-house. The software provides online access to real-time environmental and operating data through the Equinix Customer Portal or via either REST (APIs that provide customers the ability to retrieve information about their assets from every IBX location) or streaming API integrations. With real-time alerts and configurable reporting, IBX SmartView allows customers to maintain their IBX operations and plan for future growth.
•Equinix Smart Hands® provides around-the-clock, on-site operational support service for remote management, installation and troubleshooting of customer data center equipment. Using Equinix IBX data center technicians, Smart Hands allows customers to manage their Platform Equinix data center operations from anywhere in the world.
•Equinix Infrastructure Services (EIS) provides customers with a simple one-stop shop to purchase and deploy a world-class colocation deployment. EIS are repeatable, proven processes which address larger, more complex data center jobs, including installation and implementation of new builds, and planned migrations. EIS practices deliver Equinix expertise in colocation design to optimize our customers’ data center needs, including structured cabling, labelling and documentation, procurement recommendations and coordination, and secure de-installation.
Interconnection Offerings
Our interconnection solutions connect businesses directly, securely and dynamically within and between our data centers across our global platform. These solutions are typically billed based on the outbound connections from a customer and generate MRR.
•Equinix Fabric® provides secure, on-demand, software-defined interconnection. Built specifically for digital infrastructure, Equinix Fabric enables businesses to connect globally to their choice of thousands of networking, storage, compute and application service providers in the industry’s largest infrastructure ecosystem. As the foundation of Platform Equinix’s interconnection capability, Equinix Fabric also enables customers to quickly and easily connect between the physical and virtual digital infrastructures they have deployed in Equinix data centers globally.
•Cross Connects provide a point-to-point cable link between two Equinix customers in the same data center. Cross Connects deliver fast, convenient, affordable and highly reliable connectivity and data exchange with business partners and service providers within the Equinix ecosystem.
•Equinix Internet Exchange® enables networks, content providers and large enterprises to exchange internet traffic through the largest global peering solution. Service providers can aggregate traffic to multiple counterparties, called peers, on one physical port and handle multiple small peers while moving high-traffic peers to private interconnections. This reduces latency for end users when accessing content and applications.
•Equinix Internet Access is an agile, scalable, resilient and high-performing internet access solution. With at least two upstream ISPs in each market, Equinix Internet Access offers the resiliency that organizations demand and direct connections to major content destinations, resulting in superior performance. It provides the convenience of a one-stop shop and the flexibility required to connect to the internet as a primary or secondary access solution. Available globally in more than 40 markets, Equinix Internet Access allows businesses to grow as their needs grow, with scalable bandwidth options to meet their emerging usage requirements.
•Fiber Connect provides dark fiber links between customers and partners between multiple Equinix data centers. Fiber Connect enables fast, convenient and affordable integration with partners, customers and service providers across the global Equinix digital ecosystem. It supports highly reliable, extremely low-latency communication, system integration and data exchange.
Digital Offerings
Our edge solutions help businesses rapidly deploy as a service networking, security and hardware across our global data center footprint as an alternative to buying, owning and managing the physical infrastructure. Our edge solutions are typically billed based on the number of instances and the capacity used by a customer and generate MRR.
•Network Edge allows customers to modernize networks within minutes, by deploying network functions virtualization ("NFV") from multiple vendors across Equinix metros. Companies can select, deploy and connect virtual network solutions at the edge quickly, with no additional hardware requirements.
•Equinix Metal® allows enterprises, SaaS companies and digital service providers to provision interconnected bare metal resources in minutes instead of months, while reducing the capital expenditures and operational requirements of owning hardware. They can also reduce cloud costs while retaining the flexibility and operational expenditures of cloud solutions via on-demand, reserved or spot market capacity in Equinix’s global data centers using the Equinix Metal portal or DevOps-friendly APIs and integrations. DevOps, a combination of "development" and "operations", aligns collaboration between software development (Dev) and IT operations (Ops) skills and experiences to build, test and deploy APIs and other functionalities quickly.
•Equinix Precision Time® provides secure Precision Time Protocol ("PTP") and Network Time Protocol ("NTP") Time as a Service for distributed enterprise applications on Platform Equinix. The solution uses redundant and strategically located equipment and the high-performance network backbone of Equinix Fabric to deliver secure, reliable and precise time synchronization. Customers gain access to the product portal, allowing them to provision, manage and monitor their service.
Competition
While a large number of enterprises and service providers, such as hyperscale cloud service providers, own their own data centers, we believe the industry is shifting away from single-tenant solutions to outsourcing some or all of their IT housing and interconnection requirements to third party facilities, such as those operated by us. This shift is being accelerated by the increasing adoption of hybrid multicloud architectures.
Historically, the outsourcing market was served by large telecommunications carriers who bundled their products and services with their colocation offerings. The data center market landscape has evolved to include private and vendor-neutral MTDC providers, public and private cloud providers, managed infrastructure and application hosting providers, and systems integrators. It is estimated that Equinix is one of more than 2,200 companies that provide MTDC offerings around the world. The global MTDC market is highly fragmented. Each of these data center solutions providers can bundle various colocation, interconnection and network offerings, outsourced IT infrastructure solutions and managed services. We believe that this outsourcing trend has
accelerated and is likely to continue to accelerate in the coming years, especially in light of the movement to digital business and the use of multiple cloud service providers.
Equinix is differentiated in this market by being able to offer customers a global platform that reaches over 30 countries and contains the industry’s largest and most active ecosystem of partners in our sites, including access to a leading share of cloud on-ramps, and an increasingly diverse ecosystem of networks and cloud and IT service providers. This ecosystem creates a “network effect” which improves performance and lowers cost for our customers, enabling them to become digital leaders, and is a significant source of competitive advantage for Equinix. Additionally, our digital solutions portfolio enables customers to bring together physical and programmable technologies like compute, storage, network and applications, to build a foundation for their company's digital operations.
Customers
Our customers include telecommunications carriers, mobile and other network services providers, cloud and IT services providers, digital media and content providers, financial services companies, and global enterprise ecosystems in various industries. We provide each company access to a choice of business partners and solutions based on their colocation, interconnection and managed IT service needs, and delivered 99.9999% operational uptime across our global data centers in 2022. As of December 31, 2022, we had over 10,000 customers worldwide. No one customer made up 10% or more of our total business revenues for the year ended December 31, 2022.
The following companies represent some of our leading customers and partners:
We serve our customers with a direct sales force and channel marketing program. We organize our sales force by customer type, as well as by establishing a sales presence in diverse geographic regions, which enables efficient servicing of the customer base from a network of regional offices. We also support our customers with a global customer care organization.
Human Capital
As of December 31, 2022, we had 12,097 employees worldwide with 5,493 based in the Americas, 3,936 based in EMEA and 2,668 based in Asia-Pacific. Of those employees, 5,130 employees were in engineering and operations, 1,985 employees were in sales and marketing and 4,982 employees were in management, finance and administration. As of December 31, 2022, approximately 73% of our workforce identified as men and approximately 26% identified as women. Women's representation in leadership (defined as VP and above) remained constant at 31% year-over-year.
At Equinix, we strive to build a culture where every employee, every day, can say “I’m Safe, I Belong and I Matter” and where our workforce, at all levels, reflects and represents the communities in which we operate. Our objective is to continue to make our culture a critical competitive advantage, engaging every leader and every employee in the process. To ensure we are upholding our core corporate values and making progress towards our aspirational goals, we monitor employee satisfaction through a quarterly pulse survey, which is one of our listening mechanisms. In 2022, employee satisfaction scores remained steady between 81-82 out of 100 each quarter, resulting in a score for Equinix three points higher than the benchmark score of the top 20th percentile of other companies. Managers use their quarterly pulse survey results to engage in dialogue with their teams about what is top of mind for our employees and how we can do better.
Attracting, developing and retaining talent at all levels is vital to our continued success and we offer industry competitive compensation and benefits, along with development opportunities to help every employee achieve their full potential. We continue to benefit from talent sourcing programs such as our global new-to-career programs as well as pathways programs for veterans and women returning to the workforce. In 2022, we continued to enhance our portfolio of development programs for our employees and gained full adoption of a system-enabled approach to goal setting, development planning and performance assessment to support objectivity and accountability in our talent management process. We offer development tools and opportunities to our employees such as online learning, manager training, professional coaching and 360-degree assessments for eligible employees as well as our leadership program specifically designed for high potential employees at the Director level and above.
We believe in equitable pay and equitable opportunity at every level of the organization. Equinix remains committed to attracting more women and other historically underrepresented groups to join the company, and to ensuring we have fair and consistent practices in place to recognize, reward and promote all employees, regardless of gender, ethnicity, sexual orientation, or other protected classes. Equinix operates a rigorous governance framework to manage pay and other compensation elements to ensure that all reward decisions are made fairly and without discrimination or bias. All roles are mapped and graded to one consistent global organizational framework. Each grade has a specific pay range created by benchmarking against the external market in the country in which the role is located. This global framework is also used to determine target levels for annual bonuses and long-term incentives. We strive to annually update our market data globally where information is available.
We are integrating diversity, inclusion and belonging ("DIB") into every aspect of how we run our business. In 2020, we embarked on a multi-year DIB strategy with governance through a DIB Council chaired by our CEO and CHRO, and in partnership with our Sustainability Program Office, that oversees our progress on environmental, social and governance ("ESG") matters. Our DIB strategy focuses on attracting, developing and retaining a diverse, global workforce; building leadership capability and accountability; and empowering our people to bring DIB to life. We have built multiple pathways to reach new talent from diverse communities. In 2022, we continued to forge partnerships and invest in tools and systems to grow and support our inclusive hiring practices and made updates to our recruitment marketing to reach a wider candidate pool more effectively. In 2022, our Talent Acquisition Team partnered with members of two of our Equinix Employee-led Connection Networks ("EECNs"), BlackConnect and GenteConnect, to build new avenues for recruiting Black/African American and Hispanic/Latinx talent to Equinix in the U.S. We also embedded diversity and inclusive behavior competencies in our leadership profiles and added coaching tools as well as manager training on leading inclusive teams to our development program.
Our EECNs are integral to our DIB strategy and play an important role in creating belonging and advocating for the needs and goals of communities with common identities, cultures or backgrounds. Each of our nine EECNs represents an identity/community that has faced historical discrimination or shares unique challenges. We recognize that creating the best workplace and culture we can requires a global effort with localized awareness and approaches. In 2020, we launched WeAreEquinix employee teams empowered to create, localize and promote purpose, inclusion and belonging for their locations across the world. Through live and virtual events, campaigns, and collaboration with the business, these volunteer leaders bring local opportunities to engage in the following
areas: Wellbeing, Green and Sustainability, Community Impact, Fun and Creativity, DIB, and Employee Networks. We currently have WeAreEquinix teams in 35 locations.
Equinix representatives have joined the G100 Talent Consortium Task Force on Racial Inequity in Business to consider core inequity issues, including anti-racism, bias, and hiring and promotability practices, in order to develop tangible best practices that companies can use as guide rails to increase representation and career mobility for black, indigenous and people of color ("BIPOC") employees. In 2022, we hosted a Days of Understanding event as part of an initiative of CEO ACT!ON, a pledge Equinix has taken along with hundreds of other companies to embrace difference in our organizations, educate our people and build more inclusive cultures inside and outside of our workplaces. As part of this partnership, three Equinix employees completed ACT!ON’s inaugural two-year fellowship program focused on identifying, developing, and promoting scalable and sustainable policies and corporate best practices that address systemic racism and social injustice to improve societal wellbeing, and two new fellows joined. Equinix also completed its first year as a member of the Alliance for Global Inclusion, a coalition of global organizations working together to bring inclusivity and full equity to the workplace. This past year, Equinix worked with the Alliance to address inclusive language, leadership representation, and STEM readiness in under-resourced communities. Finally, in 2022 Equinix continued and expanded its programs with McKinsey to provide leadership development not only to our Black/African American leaders, but also to include individuals who identify as part of the Asian and Latinx communities through the Leadership Academy.
Our Community Impact program promotes connection and belonging, and enables employees to give back, with the support of Equinix, to the communities in which we work and live. In 2022, employees volunteered 22,759 service hours and over $2 million was donated through employee giving, corporate matching funds and grants. Additionally, in 2022, The Equinix Foundation was launched with a focus on the advancement of digital inclusion—from access to technology and connectivity to the skills needed to thrive in today's digitally driven world.
We believe our commitment to the highest standards of honesty, integrity and ethical behavior differentiates our business as much as our technology. We promote these high standards through a number of policies including the Equinix Code of Business Conduct. All employees are required to complete trainings on ethics and the company’s anti-bribery and corruption policies. In addition, we maintain a confidential ethics helpline where employees are encouraged to speak up if they have any questions or concerns that our code is being violated. We have a zero-tolerance, non-retaliation policy that protects our employees when they speak up.
We have continued a number of precautionary measures in line with our business continuity and pandemic plans to minimize the risk of operational impacts and to protect the health and safety of employees, customers, partners and our communities. In 2022, we took a careful approach to the opening of our offices based on guidance from health experts and other leaders from around the world. As we look forward to the future of work, and more importantly amplifying Equinix’s vibrant culture, we are providing flexible, hybrid work opportunities in many roles, enhanced collaboration technologies for everyone, and activity-based workspaces at home or onsite. We recognize that the new normal will require changing behaviors. As such, we are providing learning opportunities and best practices to ensure our meetings, events and work sessions are inclusive and equitable for virtual and in-person participation. Employee well-being has been central to these efforts, driven globally through offerings such as health programs, ergonomic support, technology reimbursements, and wellness days.
We believe that all of these programs and initiatives support our human capital goals, align with our company culture, and increase employee satisfaction.
Sustainability
At Equinix, our Future First sustainability strategy rallies our people and partners to envision a better future and then do what it takes to make it happen. As the world’s digital infrastructure leader, we believe we have the responsibility to harness the power of technology to create a more accessible, equitable and sustainable future. The ESG initiatives comprising our Future First strategy focus on the issues that have the greatest impact on our stakeholders and our business. We continue to work to progress on our sustainability goals and look to build a business and world that reflects our purpose to bring the world together on our platform to create the innovations that will enrich our work, life and planet. We document our ESG progress in our Annual Report as well as in the annual Corporate Sustainability Report.
In 2021, we committed to becoming climate neutral across our global operations by 2030 and set a validated near-term science-based target (“SBT”) for emissions reduction across our global operations and supply chain. Our climate commitments are a critical step to ensure that we continue to advance investments and innovations to reduce greenhouse gas ("GHG") emissions and keep global warming to 1.5 degrees Celsius in alignment with the Paris Climate Agreement.
As a part of our Future First sustainability strategy, we published an Environmental Sustainability and Global Climate Change Policy in 2021 to detail our approach and practices related to the environment, climate change, resource efficiency and reporting. In alignment with our strategy and policy, we are also evaluating our material climate change risks and opportunities based on the recommendations of the Task Force on Climate Related Financial Disclosures (“TCFD”). In 2022, we undertook a qualitative and quantitative climate-related scenario analysis across eight climate scenarios in line with TCFD recommendations. This included scenario analysis modeling for the highest priority physical risks. We are continuing our work to embed climate change risk management into our business where relevant.
Environmental Performance
Equinix was the first data center company to commit to a long-term goal of 100% renewable energy across our global portfolio. We use local renewable energy sources where possible, seek new or recently built renewable sources and advocate for favorable renewable energy policies. In the U.S., we purchase nearly 2.5 million megawatt-hours ("MWh") of green power annually from a portfolio of renewable energy projects, including 225 MW of wind power under long-term virtual power purchase agreements ("VPPAs") located in Texas and Oklahoma. We have also recently executed 3 VPPAs in Europe which will bring 129 MW of new wind capacity to Finland when the projects are operational in 2024, 2025 and 2026. In 2021, 95% of our global electricity consumption, and 100% of U.S. electricity consumption, was covered by renewable energy sources.
We are committed to transparently measuring and reporting our global carbon footprint across direct (Scope 1), indirect energy (Scope 2) and indirect value chain (Scope 3) emissions. Since 2019, we have achieved a 12% reduction in GHG emissions on an absolute basis (Scope 1 and Scope 2 market-based metric tons of carbon dioxide-equivalent (mtCO2e)), even as the company doubled its footprint in both energy consumption and number of sites. In 2022, CDP, a global non-governmental organization dedicated to helping investors and companies measure and manage their climate risks, recognized our commitments, actions and progress on climate change.
We received an 'A' CDP leadership score for climate action and annual disclosures within the CDP Climate Change survey.
We are leveraging technology and innovation to encourage commercialization of solutions that will enable the “Data Center of the Future”. To support our ongoing sustainability initiatives and commitment to innovation, we issued green bonds approximating $3.7 billion from 2020 to 2021, with an additional $1.2 billion in 2022. Our Green Finance Framework aligns our sustainability commitments with our long-term financing needs and highlights our pipeline of green projects and data center innovations. As of December 31, 2022, we have allocated $3.7 billion in net proceeds to finance or refinance, in whole or in part, ongoing and new projects in categories of green buildings, renewable energy and energy efficiency.
We are committed to advancing environmental progress across other areas of our operations. While energy usage, specifically electricity, is our largest environmental impact, to address the growing importance of water within our operations, we launched a Sustainable Water Management Program in 2021. This program drove the implementation of tools to aid in the tracking of water usage at our data centers, helping create a 2021 baseline of our Water Usage Effectiveness (WUE) to inform future actions. We consider the consumption of water in the design and operation of our facilities and are developing a coordinated global approach to water measurement and management. Through our efforts to establish the European Climate-Neutral Data Centre Operator Pact in 2021, Equinix and the EU data center industry have also committed to advancing initiatives beyond renewable energy and energy efficiency, including water efficiency, waste reduction, and circular economy principles.
Sustainability Accounting Standards Board ("SASB") Disclosures
SASB published the Sustainability Accounting Standard ("Standard") for the Real Estate Industry in October 2018. We have aligned our SASB disclosures with the Real Estate Standard to enhance corporate disclosure around ESG performance. In our comprehensive disclosures in our annual Corporate Sustainability Report, we also document our progress against metrics as outlined in other frameworks such as the Global Reporting Initiative ("GRI"), UN Sustainable Development Goals ("SDGs") and TCFD. The following tables detail our energy metrics, aligned with the SASB Real Estate Standard. We intend to expand our reporting around the Real Estate Standard in the coming years.
The following metrics represent our colocation facilities performance in the calendar years specified. Energy, renewable energy and GHG emissions are independently assured to ISO 14064-3:2006 Standards for the quantification and reporting of GHG emissions (Scope 1, 2 and 3). Calendar year data for 2022 will become available in Q2 2023 and will be published in our annual Corporate Sustainability Report.
Energy Management: Energy Consumption
| | | | | | | | | | | | | | | | | | | | | | | | | | |
| Year | Energy Consumption Data as a % of Floor Area | Total Energy Consumed by Portfolio Area with Data Coverage (MWh) (1) | Like-for-Like Change in Energy Consumption of Portfolio Area with Data Coverage (MWh) (2) | Grid Electricity Consumption as a % of Energy Consumption | Energy Consumption from Renewable Sources (MWh) (3) | Renewable Energy as a % of Energy Consumption (4) | Like-for-Like Change in Energy Consumption from Renewable Sources of Portfolio Area with Data Coverage (MWh) (2) (3) | Renewable Energy as a % of Electricity Consumption |
2020(5)(6) | 95.8% | 6,432,000 | 6.2% | 93.2% | 5,695,000 | 89% | 5.3% | 91% |
2021(7)(8) | 98.0% | 7,130,000 | 23.3% | 94.6% | 6,689,000 | 94% | 26.1% | 95% |
(1)The scope of energy includes: energy used onsite (natural gas and diesel), energy procured (purchased electricity, electric power from fuel cells under power purchase agreements, and chilled water).
(2)Like-for-like computed for stabilized asset list for the overlapping list of sites designated as stabilized in 2020 and 2021.
(3)Excludes renewable energy inherently supplied by the standard utility grid mix. Equinix buys renewable energy for the entire electricity consumption of sites including customer and overhead load. The instruments used include: Renewable Energy Certificates (RECs) from VPPAs, RECs, International RECs (I-RECs), Guarantees of Origin (GOOs) and Renewable Energy Guarantees of Origin (REGOs) from suppliers, green tariffs and bundled contracts.
(4)Equinix's global renewable energy percentage reported for RE100 and CDP was 95%, which is comprised of 6,773 GWh of renewables out of 7,136 GWh of electric power consumption. The discrepancy in the totals arises from non-IBX data center sites' energy usage and non-electric power energy consumption.
(5)Recently constructed or acquired sites for which no utility data is available are excluded from the 2020 SASB metrics reporting boundary. These include certain data centers in the Americas (DC21) and EMEA (MC1). Reseller sites are also excluded in the energy metrics (OS99, SH1).
(6)2020 portfolio coverage excludes xScaleTM sites: LD10x, LD13x, FR11x, SP5x, PA8x.
(7)Recently constructed or acquired sites for which no utility data is available are excluded from the 2021 SASB metrics reporting boundary. These include certain data centers in EMEA (FR9x) and Asia-Pacific (OS2x, OS3, PE3) and Equinix's GPX (India) acquisition sites (MB1, MB2). Reseller sites are also excluded in both the gross floor area and the energy metrics (DA99, OS99, SH1).
(8)2021 portfolio coverage includes xScaleTM sites: LD11x, LD13x, PA8x, PA9x, SP5x, TY12x.
Energy Management: Green Building Ratings
Our environmental efforts aim to deliver meaningful and measurable progress against sustainability goals that positively impact our customers, partners, investors and employees. Our data centers are designed with high operational standards and energy efficiency in mind. Our data centers are planned holistically to incorporate the needs of our communities and we aim to minimize the use of all resources in our operations. We evaluate cost-efficient opportunities to enhance energy efficiency and buy renewable energy for existing or acquired sites.
We are working to protect our planet's resources by pioneering green data center innovations and building and operating energy-efficient data centers around the world. Our Energy Efficiency Center of Excellence is driving a global approach to cooling our existing data centers more efficiently. The program engages customers to manage their implementations more sustainably at our facilities, leading to overall improved site efficiencies.
We certify our data centers to numerous green buildings and energy management certifications and schemes. These include USGBC LEED green buildings certifications, ISO 14001:2015 Environmental Management Standard, ISO 50001:2011 Energy Management Standard, BCA Green Mark, U.S. EPA Energy Star for Data Centers and others. In 2021, Equinix became a U.S. Green Building Council (USGBC) Gold member, aligning with the developer of the LEED rating system and furthering our commitment to green buildings. To increase the scalability of certification within our portfolio, we developed a global LEED Scorecard that will help us ensure every new build is prioritizing the design and community guidelines developed by USGBC.
Data centers receiving green building ratings in 2021 and 2022 covered 1.6 million gross sq. ft. While we have additional certifications that are pending final submissions, the following new sites received ratings in 2021 or 2022: | | | | | | | | | | | |
| Data Center | Metro Area | Rating Scheme | Level Achieved |
| 2021 |
| DA11 | Dallas, Texas | LEED | Silver |
| ME2 | Melbourne, Australia | LEED | Gold |
| SG4 | Singapore | BCA Green Mark | GoldPlus |
| SV11 | Silicon Valley, California | LEED | Gold |
| TY12x | Tokyo, Japan | LEED | Silver |
| 2022 |
| GN1 | Genoa, Italy | LEED | Gold |
| OS2x | Osaka, Japan | LEED | Certified |
| OS3 | Osaka, Japan | LEED | Silver |
| SG5 | Singapore | BCA Green Mark
LEED | Platinum
Silver |
In 2022, we had 19.1 million gross sq. ft., or 71% of our global footprint, in operation with green buildings and energy management certifications. Within the U.S., we had 4.0 million gross sq. ft., or 45% of our footprint, under certification, including 0.6 million of gross sq. ft., or 7% of U.S. footprint, having achieved U.S. EPA Energy Star for Data Centers. We are currently evaluating enrolling additional sites in the Energy Star program. We disclose these and other site-level details about our data centers on our sustainability website.
| | | | | | | | | | | |
| Year | Total Gross sq. ft. (million)(1) | Area of Eligible Portfolio with Green Building Rating (million sq. ft.)(2) | Eligible Portfolio with Green Building Rating (%) |
| Global Total through 2022 | 27.0 | 19.1 | 71% |
| U.S. Total through 2022 | 8.9 | 4.0
0.6 (Energy Star) | 45%
7% (Energy Star) |
(1)Ratings included in our totals: ISO 50001 Energy Management, ISO 14001 Environmental Management, LEED green buildings certifications, U.S. Environmental Protection Agency Energy Star for Data Centers, BCA Green Mark, NABERS and Green Globes.
(2)We are currently evaluating our approach to U.S. EPA Energy Star for Data Centers. In 2021, three sites received Energy Star for Data Centers recognition, representing 7% of our U.S. portfolio. In contrast, our U.S. portfolio has 19 LEED-certified data centers or 34% of the U.S. portfolio by gross square footage.
Our Business Segment Financial Information
We currently operate in three reportable segments comprised of our Americas, EMEA and Asia-Pacific geographic regions. Information attributable to each of our reportable segments is set forth in Note 17 within the Consolidated Financial Statements.
Available Information
Equinix owns and maintains intellectual property in the form of trademarks, patents, application programming interfaces, customer portals and a variety of products and other offerings.
We were incorporated in Delaware in June 1998. We are required to file reports under the Securities Exchange Act of 1934, as amended, with the Securities and Exchange Commission ("SEC"). The SEC maintains an internet website at http://www.sec.gov that contains reports, proxy and information statements and other information.
You may also obtain copies of our annual reports on Form 10-K, our quarterly reports on Form 10-Q and our current reports on Form 8-K, and any amendments to such reports, free of charge by visiting the Investor Relations page on our website, www.equinix.com. These reports are available as soon as reasonably practical after we file them with the SEC. Information contained on or accessible through our website is not part of this Annual Report on Form 10-K.
ITEM 1A. Risk Factors
In addition to the other information contained in this report, the following risk factors should be considered carefully in evaluating our business:
Risk Factors
Risks Related to the Macro Environment
Inflation in the global economy, increased interest rates and adverse global economic conditions, like the ones we are currently experiencing, could negatively affect our business and financial condition.
Inflation in the United States, Europe and other geographies has risen to levels not experienced in recent decades and we are seeing its impact on various aspects of our business. We are also experiencing an increase in our costs to procure power and supply chain issues globally. Rising prices for materials related to our IBX data center construction and our data center offerings, energy and gas prices, as well as rising wages and benefits costs negatively impact our business by increasing our operating costs. The levels of inflation we are currently experiencing may cause a decrease in sales as some customers may need to take cost cutting measures or scale back their operations. This could result in churn in our customer base, reductions in revenues from our offerings, adverse effects to our DSO, longer sales cycles, slower adoption of new technologies and increased price competition, which could adversely affect our liquidity. Customers and vendors filing for bankruptcy could also lead to costly and time-intensive actions with adverse effects, including greater difficulty or delay in accounts receivable collection. The uncertain economic environment could also have an impact on our foreign exchange forward contracts if our counterparties' credit deteriorates or if they are otherwise unable to perform their obligations. Finally, volatility in the financial markets like we are currently experiencing could affect our ability to access the capital markets at a time when we desire, or need, to do so which could have an impact on our flexibility to pursue additional expansion opportunities and maintain our desired level of revenue growth in the future.
Our efforts to mitigate the risks associated with these adverse conditions may not be successful and our business and growth could be adversely affected.
We are currently operating in a period of economic uncertainty and capital markets disruption, which has been the result of many global macro-economic factors including the ongoing military conflict between Russia and Ukraine. These macro-economic and other factors could negatively affect our business and financial condition.
The war in Ukraine has led to market disruptions, including significant volatility in commodity prices, credit and capital markets, an increase in cyber security incidents as well as supply chain disruptions.
Additionally, various of Russia’s actions have led to sanctions and other penalties being levied by the U.S., the European Union, the United Kingdom, and other countries, as well as other public and private actors and companies, against Russia and certain other geographic areas, including agreement to remove certain Russian financial institutions from the Society for Worldwide Interbank Financial Telecommunication payment system and restrictions on imports of Russian oil, liquified natural gas and coal. We do not have operations in Russia or Ukraine and historically we have had a limited number of Russian and Ukrainian customers, which we continue to screen against applicable sanctions lists per our standard processes. Although we continue to devote resources to this screening effort, including the use of software solutions, the sanctions screening process remains partially manual, and the sanctions lists continue to evolve and vary by country. We continue to address necessary changes in global sanctions laws and modify our processes as necessary in light of these evolving laws. A material failure to comply with global sanctions laws could have a negative effect on our reputation, business and financial condition.
In addition to compliance with applicable sanctions laws, we are currently limiting the ability of Russian customers to place orders for our offerings unless, after reviewing these orders, we believe they are aligned with our stated objectives in support of Ukraine. We have suspended all activities and purchasing with and through Russian partners and suppliers and have committed to not make any direct or indirect investment in Russia absent an end to this conflict. In addition, for our customers located in Ukraine, we are currently providing offerings free of charge and may continue to do so in the future.
The associated disruptions in the oil and gas markets have caused, and could continue to cause, significant increases in energy prices, which could have a material effect on our business. Additional potential sanctions and penalties have also been proposed and/or threatened. Some of our IBX data centers in EMEA partially rely on energy produced in-part from fossil fuels originating from Russia, which Russia has reduced. If Russia further reduces or turns off energy supplies to Europe, our EMEA operations could be adversely affected. Russian military actions and the resulting sanctions could further affect the global economy and financial markets and lead to instability and lack of liquidity in capital markets, potentially making it more difficult for us to obtain additional debt or equity financing on attractive terms in the future.
Prolonged unfavorable economic conditions or uncertainty as a result of the military conflict between Russia and Ukraine may adversely affect our business, financial condition, and results of operations. Any of the foregoing may also magnify the impact of other risks described in this Annual Report on Form 10-K.
Our business could be harmed by increased costs to procure power, prolonged power outages, shortages or capacity constraints as well as restrictions on access to power.
Any power outages, shortages, capacity constraints or significant increases in the cost of power may have an adverse effect on our business and our results of operations.
In each of our markets, we rely on third parties, third party infrastructure, governments, and global suppliers to provide a sufficient amount of power to maintain our IBX data centers and meet the needs of our current and future customers. Any limitation on the delivered energy supply could limit our ability to operate our IBX data centers. These limitations could have a negative impact on a given IBX data center(s) or limit our ability to grow our business which could negatively affect our financial performance and results of operations.
Our IBX data centers are affected by problems accessing electricity sources, such as planned or unplanned power outages and limitations on transmission or distribution of power. Unplanned power outages, including, but not limited to those relating to large storms, earthquakes, fires, tsunamis, cyberattacks, war, and any failures of electrical power grids more generally, and planned power outages by public utilities, such as those related to Pacific Gas and Electric Company's planned outages in California to minimize fire risks, could harm our customers and our business. Employees working from home could be subjected to planned power outages at home which could be difficult to track and could affect the day to day operations of our non-IBX data center employees. Our international operations are sometimes located outside of developed, reliable electricity markets, where we are exposed to some insecurity in supply associated with technical and regulatory problems, as well as transmission constraints. Some of our IBX data centers are located in leased buildings where, depending upon the lease requirements and number of tenants involved, we may or may not control some or all of the infrastructure including generators and fuel tanks. As a result, in the event of a power outage, we could be dependent upon the landlord, as well as the utility company, to restore the power. We attempt to limit our exposure to system downtime by using backup generators, which are in turn supported by onsite fuel storage and through contracts with fuel suppliers, but these measures may not always prevent downtime or solve for long-term or large-scale outages. Any outage or supply disruption could adversely affect our business, customer experience and revenues.
We are currently experiencing inflation and volatility pressures in the energy market globally. In particular, current dislocation in the Singapore power market has resulted in Equinix having to buy power at extremely elevated spot and future rates and this ongoing price volatility impacted elements of our 2022 financial results and long-term models. Various macroeconomic factors are contributing to the instability and global power shortage including the Russia and Ukraine war, the COVID-19 pandemic, severe weather events, governmental regulations, government relations and inflation. The price for power in many of the countries in which we operate has seen significant increases in recent months, and it is unclear when the markets will stabilize. While we have aimed to minimize our risk exposure related to power procurement in Singapore and globally via hedging, conservation, and other efficiencies, we expect the cost for power to continue to be volatile and unpredictable and subject to inflationary pressures. We believe we have made appropriate estimates for these costs in our forecasting but the current unpredictable energy market could materially affect our financial forecasting, results of operations and financial condition.
Each new facility requires access to significant quantities of electricity. Limitations on generation, transmission and distribution may limit our ability to obtain sufficient power capacity for potential expansion sites in new or
existing markets. We may experience significant delays and substantial increased costs demanded by the utilities to provide the level of electrical service required by our current IBX data center designs.
Risks Related to our Operations
We experienced an information technology security breach in the past and may be vulnerable to future security breaches, which could disrupt our operations and have a material adverse effect on our business, results of operation and financial condition.
Despite our efforts to protect against cyber-attacks, we are not fully insulated from these types of security breaches, and such an attack could adversely impact our competitiveness and results of operations. For example, in September 2020, we discovered ransomware on certain of our internal systems. While the incident was resolved and did not cause a material disruption to our systems nor result in any material costs to us, we expect we will continue to face risks associated with unauthorized access to our computer systems, loss or destruction of data, computer viruses, ransomware, malware, distributed denial-of-service attacks or other malicious activities. These threats may result from human error, equipment failure, fraud or malice on the part of employees, vendors or third parties. As techniques used to breach security change frequently and are generally not recognized until launched against a target, we may not be able to promptly detect that a cyber breach has occurred, or implement security measures in a timely manner or, if and when implemented, we may not be able to determine the extent to which these measures could be circumvented. Our adaptation to a hybrid working model that includes both work from home and in an office could continue to expose us to new security risks. A party who is able to compromise the security measures on our networks or the security of our infrastructure could misappropriate either our proprietary information or the personal information of our customers or our employees, or cause interruptions or malfunctions in our operations or our customers' operations. As we provide assurances to our customers that we provide a high level of security, such a compromise could be particularly harmful to our brand and reputation. We may be required to expend significant capital and resources to protect against such threats or to alleviate problems caused by breaches in security. Any breaches that may occur in the future could expose us to increased risk of lawsuits, regulatory penalties, loss of existing or potential customers, damage relating to loss of proprietary information, harm to our reputation and increases in our security costs, which could have a material adverse effect on our financial performance and results of operations. We maintain insurance coverage for cyber risks, but such coverage may be unavailable or insufficient to cover our losses.
We offer professional solutions to our customers where we consult on data center solutions and assist with implementations. We also offer managed services in certain of our foreign jurisdictions outside of the U.S. where we manage the data center infrastructure for our customers. The access to our clients' networks and data, which is gained from these solutions, creates some risk that our clients' networks or data could be improperly accessed. We may also design our clients' cloud storage systems in such a way that exposes our clients to increased risk of data breach. If we were held responsible for any such breach, it could result in a significant loss to us, including damage to our client relationships, harm to our brand and reputation, and legal liability.
Any failure of our physical infrastructure or negative impact on our ability to meet our obligations to our customers, or damage to customer infrastructure within our IBX data centers, could lead to significant costs and disruptions that could reduce our revenue and harm our business reputation and financial condition.
Our business depends on providing customers with highly reliable solutions. We must safeguard our customers' infrastructure and equipment located in our IBX data centers and ensure our IBX data centers and non-IBX offices remain operational at all times. We own certain of our IBX data centers, but others are leased by us, and we rely on the landlord for basic maintenance of our leased IBX data centers and office buildings. If such landlord has not maintained a leased property sufficiently, we may be forced into an early exit from the center which could be disruptive to our business. Furthermore, we continue to acquire IBX data centers not built by us. If we discover that these buildings and their infrastructure assets are not in the condition we expected when they were acquired, we may be required to incur substantial additional costs to repair or upgrade the IBX data centers. Newly acquired data centers also may not have the same power infrastructure and design in place as our own IBX data centers. These legacy designs could require upgrades in order to meet our standards and our customers’ expectations. Until the legacy systems are brought up to our standards, customers in these legacy IBX data centers could be exposed to higher risks of unexpected power outages. We have experienced power outages because of these legacy design issues in the past and we could experience these in the future.
Problems at one or more of our IBX data centers or corporate offices, whether or not within our control, could result in service interruptions or significant infrastructure or equipment damage. These could result from numerous factors, including but not limited to:
•human error;
•equipment failure;
•physical, electronic and cyber security breaches;
•fire, earthquake, hurricane, flood, tornado and other natural disasters;
•extreme temperatures;
•water damage;
•fiber cuts;
•power loss;
•terrorist acts;
•sabotage and vandalism;
•global pandemics such as the COVID-19 pandemic;
•inability of our operations employees to access our IBX data centers for any reason; and
•failure of business partners who provide our resale products.
We have service level commitment obligations to certain customers. As a result, service interruptions or significant equipment damage in our IBX data centers could result in difficulty maintaining service level commitments to these customers and potential claims related to such failures. Because our IBX data centers are critical to many of our customers' businesses, service interruptions or significant equipment damage in our IBX data centers could also result in lost profits or other indirect or consequential damages to our customers. We cannot guarantee that a court would enforce any contractual limitations on our liability in the event that one of our customers brings a lawsuit against us as a result of a problem at one of our IBX data centers and we may decide to reach settlements with affected customers irrespective of any such contractual limitations. Any such settlement may result in a reduction of revenue under U.S. generally accepted accounting principles ("GAAP"). In addition, any loss of service, equipment damage or inability to meet our service level commitment obligations could reduce the confidence of our customers and could consequently impair our ability to obtain and retain customers, which would adversely affect both our ability to generate revenues and our results of operations.
Furthermore, we are dependent upon internet service providers, telecommunications carriers and other website operators in the Americas, Asia-Pacific and EMEA regions and elsewhere, some of which have experienced significant system failures and electrical outages in the past. Our customers may in the future experience difficulties due to system failures unrelated to our systems and offerings. If, for any reason, these providers fail to provide the required services, our business, financial condition and results of operations could be materially and adversely impacted.
Our IBX data center employees are critical to our ability to maintain our business operations and reach our service level commitments. Although we have redundancies built into our workforce, if our IBX employees are unable to access our IBX data centers for any reason, we could experience operational issues at the affected site. Pandemics, weather and climate related crises or any other social, political, or economic disruption in the U.S. or abroad could prevent sufficient staffing at our IBX data centers and have a material adverse impact on our operations.
We are currently making significant investments in our back-office information technology systems and processes. Difficulties from or disruptions to these efforts may interrupt our normal operations and adversely affect our business and results of operations.
We have been investing heavily in our back-office information technology systems and processes for a number of years and expect such investment to continue for the foreseeable future in support of our pursuit of global, scalable solutions across all geographies and functions that we operate in. These continuing investments include: 1) ongoing improvements to the customer experience from initial quote to customer billing and our revenue recognition process; 2) integration of recently-acquired operations onto our various information technology systems; and 3) implementation of new tools and technologies to either further streamline and automate processes, or to support our compliance with evolving U.S. GAAP. Our finance team is also working on a multi-year project to move the
backbone of our finance systems to the cloud. As a result of our continued work on these projects, we may experience difficulties with our systems, management distraction and significant business disruptions. For example, difficulties with our systems may interrupt our ability to accept and deliver customer orders and may adversely impact our overall financial operations, including our accounts payable, accounts receivables, general ledger, fixed assets, revenue recognition, close processes, internal financial controls and our ability to otherwise run and track our business. We may need to expend significant attention, time and resources to correct problems or find alternative sources for performing these functions. All of these changes to our financial systems also create an increased risk of deficiencies in our internal controls over financial reporting until such systems are stabilized. Such significant investments in our back-office systems may take longer to complete and cost more than originally planned. In addition, we may not realize the full benefits we hoped to achieve and there is a risk of an impairment charge if we decide that portions of these projects will not ultimately benefit us or are de-scoped. Finally, the collective impact of these changes to our business has placed significant demands on impacted employees across multiple functions, increasing the risk of errors and control deficiencies in our financial statements, distraction from the effective operation of our business and difficulty in attracting and retaining employees. Any such difficulties or disruptions may adversely affect our business and results of operations.
The level of insurance coverage that we purchase may prove to be inadequate.
We carry liability, property, business interruption and other insurance policies to cover insurable risks to our company. We select the types of insurance, the limits and the deductibles based on our specific risk profile, the cost of the insurance coverage versus its perceived benefit and general industry standards. Our insurance policies contain industry standard exclusions for events such as war and nuclear reaction. We purchase earthquake insurance for certain of our IBX data centers, but for our IBX data centers in high-risk zones, including those in California and Japan, we have elected to self-insure. The earthquake and flood insurance that we do purchase would be subject to high deductibles. Any of the limits of insurance that we purchase, including those for flood or cyber risks, could prove to be inadequate, which could materially and adversely impact our business, financial condition and results of operations.
If we are unable to implement our evolving organizational structure or if we are unable to recruit or retain key executives and qualified personnel, our business could be harmed.
In connection with the evolving needs of our customers and our business, we continue to review our organizational architecture and have made, and will continue to make, changes as appropriate, including recently announced leadership and organizational changes to our digital and data center solutions teams. We must also continue to identify, hire, train and retain key personnel who maintain relationships with our customers and who can provide the technical, strategic and marketing skills required for our company's growth. There is a shortage of qualified personnel in these fields, made more acute in the current tight labor market, and we compete with other companies for the limited pool of talent.
The failure to recruit and retain necessary key executives and personnel could cause disruption, harm our business and hamper our ability to grow our company.
The failure to obtain favorable terms when we renew our IBX data center leases, or the failure to renew such leases, could harm our business and results of operations.
While we own certain of our IBX data centers, others are leased under long-term arrangements. These leased IBX data centers have all been subject to significant development by us in order to convert them from, in most cases, vacant buildings or warehouses into IBX data centers. Most of our IBX data center leases have renewal options available to us. However, many of these renewal options provide for the rent to be set at then-prevailing market rates. To the extent that then-prevailing market rates or negotiated rates are higher than present rates, these higher costs may adversely impact our business and results of operations, or we may decide against renewing the lease. There may also be changes in shared operating costs in connection with our leases, which are commonly referred to as common area maintenance expenses. In the event that an IBX data center lease does not have a renewal option, or we fail to exercise a renewal option in a timely fashion and lose our right to renew the lease, we may not be successful in negotiating a renewal of the lease with the landlord. A failure to renew a lease or termination by a landlord of any lease could force us to exit a building prematurely, which could disrupt our business, harm our customer relationships, impact and harm our joint venture relationships, expose us to liability
under our customer contracts or joint venture agreements, cause us to take impairment charges and affect our results of operations negatively.
We depend on a number of third parties to provide internet connectivity to our IBX data centers; if connectivity is interrupted or terminated, our results of operations and cash flow could be materially and adversely affected.
The presence of diverse telecommunications carriers' fiber networks in our IBX data centers is critical to our ability to retain and attract new customers. We are not a telecommunications carrier, and as such, we rely on third parties to provide our customers with carrier services. We believe that the availability of carrier capacity will directly affect our ability to achieve our projected results. We rely primarily on revenue opportunities from the telecommunications carriers' customers to encourage them to invest the capital and operating resources required to connect from their data centers to our IBX data centers. Carriers will likely evaluate the revenue opportunity of an IBX data center based on the assumption that the environment will be highly competitive. We cannot provide assurance that each and every carrier will elect to offer its services within our IBX data centers or that once a carrier has decided to provide internet connectivity to our IBX data centers that it will continue to do so for any period of time.
Our new IBX data centers require construction and operation of a sophisticated redundant fiber network. The construction required to connect multiple carrier facilities to our IBX data centers is complex and involves factors outside of our control, including regulatory processes and the availability of construction resources. Any hardware or fiber failures on this network may result in significant loss of connectivity to our new IBX data center expansions. This could affect our ability to attract new customers to these IBX data centers or retain existing customers.
To date, the network neutrality of our IBX data centers and the variety of networks available to our customers has often been a competitive advantage for us. In certain of our acquired IBX data centers in the Asia-Pacific region, the limited number of carriers available reduces that advantage. As a result, we may need to adapt our key revenue-generating offerings and pricing to be competitive in those markets.
If the establishment of highly diverse internet connectivity to our IBX data centers does not occur, is materially delayed or is discontinued, or is subject to failure, our results of operations and financial condition will be adversely affected.
The use of high power density equipment may limit our ability to fully utilize our older IBX data centers.
Server technologies continue to evolve and in some instances these changes can result in customers increasing their use of high power density equipment in our IBX data centers which can increase the demand for power on a per cabinet basis. Because many of our IBX data centers were built a number of years ago, the current demand for power may exceed the designed electrical capacity in these IBX data centers. As power, not space, is a limiting factor in many of our IBX data centers, our ability to fully utilize those IBX data centers may be impacted. The ability to increase the power capacity of an IBX data center, should we decide to, is dependent on several factors including, but not limited to, the local utility's ability to provide additional power; the length of time required to provide such power; and/or whether it is feasible to upgrade the electrical infrastructure of an IBX data center to deliver additional power to customers. Although we are currently designing and building to a higher power specification than that of many of our older IBX data centers, there is a risk that demand will continue to increase and our IBX data centers could become underutilized sooner than expected.
Our offerings have a long sales cycle that may harm our revenue and results of operations.
A customer's decision to purchase our offerings typically involves a significant commitment of resources. In addition, some customers will be reluctant to commit to locating in our IBX data centers until they are confident that the IBX data center has adequate carrier connections. As a result, we have a long sales cycle. Furthermore, we may devote significant time and resources to pursuing a particular sale or customer that does not result in revenues.
Delays due to the length of our sales cycle may materially and adversely affect our revenues and results of operations, which could harm our ability to meet our forecasts and cause volatility in our stock price.
We may not be able to compete successfully against current and future competitors.
The global multi-tenant data center market is highly fragmented. It is estimated that we are one of more than 2,200 companies that provide these offerings around the world. We compete with these firms which vary in terms of their data center offerings and the geographies in which they operate. We must continue to evolve our product strategy and be able to differentiate our IBX data centers and product offerings from those of our competitors.
Some of our competitors may adopt aggressive pricing policies, especially if they are not highly leveraged or have lower return thresholds than we do. As a result, we may suffer from pricing pressure that would adversely affect our ability to generate revenues. Some of these competitors may also provide our target customers with additional benefits, including bundled communication services or cloud services, and may do so in a manner that is more attractive to our potential customers than obtaining space in our IBX data centers. Similarly, with growing acceptance of cloud-based technologies, we are at risk of losing customers that may decide to fully leverage cloud infrastructure offerings instead of managing their own. Competitors could also operate more successfully or form alliances to acquire significant market share. Regional competitors may also consolidate to become a global competitor. Consolidation of our customers and/or our competitors may present a risk to our business model and have a negative impact on our revenues.
Failure to compete successfully may materially adversely affect our financial condition, cash flows and results of operations.
If we cannot continue to develop, acquire, market and provide new offerings or enhancements to existing offerings that meet customer requirements and differentiate us from our competitors, our results of operations could suffer.
As our customers evolve their IT strategies, we must remain flexible and evolve along with new technologies and industry and market shifts. Ineffective planning and execution in our cloud and product development strategies may cause difficulty in sustaining our competitive advantages.
The process of developing and acquiring new offerings and enhancing existing offerings is complex. If we fail to anticipate customers’ evolving needs and expectations or do not adapt to technological and IT trends, our results of operations could suffer. In order to adapt effectively, we sometimes must make long-term investments, develop, acquire or obtain certain intellectual property and commit significant resources before knowing whether our predictions will accurately reflect customer demand for the new offerings. Additionally, any delay in the development, acquisition, marketing or launch of a new offering could result in customer dissatisfaction or attrition. If we cannot continue adapting our products, or if our competitors can adapt their products more quickly than us, our business could be harmed.
We have invested in joint ventures in order to develop capacity to serve the large footprint needs of a targeted set of hyperscale customers by leveraging existing capacity and dedicated hyperscale builds. We have announced our intention to seek additional joint ventures for certain of our hyperscale builds. There can be no assurances that our joint ventures will be successful or that we find appropriate partners, or that we will be able to successfully meet the needs of these customers.
In 2020, we acquired Packet Host, Inc. ("Packet"), a bare metal automation company to facilitate a new hardware product offering for us. We expect to continue to consider other new product offerings for our customers. Hardware solutions are a relatively new market area for us which can bring challenges and could harm our business if not executed in the time or manner that we expect. Hardware solutions can also require additional capital and may have lower margins than our data center offerings, thus adversely impacting our results. While we believe this product offering and others we may implement in the future will be desirable to our customers and will complement our other offerings on Platform Equinix, we cannot guarantee the success of this product or any other new product offering.
Failure to successfully execute on our product strategy could materially adversely affect our financial condition, cash flows and results of operations.
We have government customers, which subjects us to risks including early termination, audits, investigations, sanctions and penalties.
We derive revenues from contracts with the U.S. government, state and local governments and foreign governments. Some of these customers may terminate all or part of their contracts at any time, without cause. There is increased pressure for governments and their agencies, both domestically and internationally, to reduce spending. Some of our federal government contracts are subject to the approval of appropriations being made by the U.S. Congress to fund the expenditures under these contracts. Similarly, some of our contracts at the state and local levels are subject to government funding authorizations.
Government contracts often have unique terms and conditions, such as most favored customer obligations, and are generally subject to audits and investigations which could result in various civil and criminal penalties and administrative sanctions, including termination of contracts, refund of a portion of fees received, forfeiture of profits, suspension of payments, fines and suspensions or debarment from future government business.
Because we depend on the development and growth of a balanced customer base, including key magnet customers, failure to attract, grow and retain this base of customers could harm our business and results of operations.
Our ability to maximize revenues depends on our ability to develop and grow a balanced customer base, consisting of a variety of companies, including enterprises, cloud, digital content and financial companies, and network service providers. We consider certain of these customers to be key magnets in that they draw in other customers. The more balanced the customer base within each IBX data center, the better we will be able to generate significant interconnection revenues, which in turn increases our overall revenues. Our ability to attract customers to our IBX data centers will depend on a variety of factors, including the presence of multiple carriers, the mix of our offerings, the overall mix of customers, the presence of key customers attracting business through vertical market ecosystems, the IBX data center's operating reliability and security and our ability to effectively market our offerings. However, some of our customers may face competitive pressures and may ultimately not be successful or may be consolidated through merger or acquisition. If these customers do not continue to use our IBX data centers it may be disruptive to our business. If customers combine businesses, they may require less colocation space, which could lead to churn in our customer base. Finally, any uncertain global economic climate, including the one we are currently experiencing, could harm our ability to attract and retain customers if customers slow spending, or delay decision-making on our offerings, or if customers begin to have difficulty paying us or seek bankruptcy protection and we experience increased churn in our customer base. Any of these factors may hinder the development, growth and retention of a balanced customer base and adversely affect our business, financial condition and results of operations.
Risks Related to our Financial Results
Our results of operations may fluctuate.
We have experienced fluctuations in our results of operations on a quarterly and annual basis. The fluctuations in our results of operations may cause the market price of our common stock to be volatile. We may experience significant fluctuations in our results of operations in the foreseeable future due to a variety of factors, many of which are listed in the Risk Factors section. Additional factors could include, but are not limited to:
•the timing and magnitude of depreciation and interest expense or other expenses related to the acquisition, purchase or construction of additional IBX data centers or the upgrade of existing IBX data centers;
•demand for space, power and solutions at our IBX data centers;
•changes in general economic conditions, such as those stemming from pandemics or other economic downturns, or specific market conditions in the telecommunications and internet industries, any of which could have a material impact on us or on our customer base;
•additions and changes in product offerings and our ability to ramp up and integrate new products within the time period we have forecasted;
•restructuring charges or reversals of restructuring charges, which may be necessary due to revised sublease assumptions, changes in strategy or otherwise;
•the financial condition and credit risk of our customers;
•the provision of customer discounts and credits;
•the mix of current and proposed products and offerings and the gross margins associated with our products and offerings;
•increasing repair and maintenance expenses in connection with aging IBX data centers;
•lack of available capacity in our existing IBX data centers to generate new revenue or delays in opening new or acquired IBX data centers that delay our ability to generate new revenue in markets which have otherwise reached capacity;
•changes in employee stock-based compensation;
•changes in our tax planning strategies or failure to realize anticipated benefits from such strategies;
•changes in income tax benefit or expense; and
•changes in or new GAAP as periodically released by the Financial Accounting Standards Board ("FASB").
Any of the foregoing factors, or other factors discussed elsewhere in this report, could have a material adverse effect on our business, results of operations and financial condition. Although we have experienced growth in revenues in recent quarters, this growth rate is not necessarily indicative of future results of operations. It is possible that we may not be able to generate net income on a quarterly or annual basis in the future. In addition, a relatively large portion of our expenses are fixed in the short-term, particularly with respect to lease and personnel expenses, depreciation and amortization and interest expenses. Therefore, our results of operations are particularly sensitive to fluctuations in revenues. As such, comparisons to prior reporting periods should not be relied upon as indications of our future performance. In addition, our results of operations in one or more future quarters may fail to meet the expectations of securities analysts or investors.
We may incur goodwill and other intangible asset impairment charges, or impairment charges to our property, plant and equipment, which could result in a significant reduction to our earnings.
In accordance with U.S. GAAP, we are required to assess our goodwill and other intangible assets annually, or more frequently whenever events or changes in circumstances indicate potential impairment, such as changing market conditions or any changes in key assumptions. If the testing performed indicates that an asset may not be recoverable, we are required to record a non-cash impairment charge for the difference between the carrying value of the goodwill or other intangible assets and the implied fair value of the goodwill or other intangible assets in the period the determination is made.
We also periodically monitor the remaining net book values of our property, plant and equipment, including at the individual IBX data center level. Although each individual IBX data center is currently performing in accordance with our expectations, the possibility that one or more IBX data centers could begin to under-perform relative to our expectations is possible and may also result in non-cash impairment charges.
These charges could be significant, which could have a material adverse effect on our business, results of operations or financial condition.
We have incurred substantial losses in the past and may incur additional losses in the future.
As of December 31, 2022, our retained earnings were $3.0 billion. We are currently investing heavily in our future growth through the build out of multiple additional IBX data centers, expansions of IBX data centers and acquisitions of complementary businesses. As a result, we will incur higher depreciation and other operating expenses, as well as transaction costs and interest expense, that may negatively impact our ability to sustain profitability in future periods unless and until these new IBX data centers generate enough revenue to exceed their operating costs and cover the additional overhead needed to scale our business for this anticipated growth. The current global financial uncertainty may also impact our ability to sustain profitability if we cannot generate sufficient revenue to offset the increased costs of our recently-opened IBX data centers or IBX data centers currently under construction. In addition, costs associated with the acquisition and integration of any acquired companies, as well as the additional interest expense associated with debt financing, we have undertaken to fund our growth initiatives,
may also negatively impact our ability to sustain profitability. Finally, given the competitive and evolving nature of the industry in which we operate, we may not be able to sustain or increase profitability on a quarterly or annual basis.
Risks Related to Our Expansion Plans
Our construction of new IBX data centers or IBX data center expansions could involve significant risks to our business.
In order to sustain our growth in certain of our existing and new markets, we may have to expand an existing data center, lease a new facility or acquire suitable land, with or without structures, to build new IBX data centers from the ground up. Expansions or new builds are currently underway, or being contemplated, in many of our markets. These construction projects expose us to many risks which could have an adverse effect on our results of operations and financial condition. The current global supply chain and inflation issues have exacerbated many of these construction risks and created additional risks for our business. Some of the risks associated with construction projects include:
•construction delays;
•lack of availability and delays for data center equipment, including items such as generators and switchgear;
•unexpected budget changes;
•increased prices for and delays in obtaining building supplies, raw materials and data center equipment;
•labor availability, labor disputes and work stoppages with contractors, subcontractors and other third parties, including interruptions in work due to the COVID-19 pandemic;
•unanticipated environmental issues and geological problems;
•delays related to permitting and approvals to open from public agencies and utility companies;
•unexpected lack of power access;
•power and power grid constraints;
•delays in site readiness leading to our failure to meet commitments made to customers planning to expand into a new build; and
•unanticipated customer requirements that would necessitate alternative data center design, making our sites less desirable or leading to increased costs in order to make necessary modifications or retrofits.
We are currently experiencing rising construction costs which reflect the increase in cost of labor and raw materials, supply chain and logistic challenges, and high demand in our sector. While we have invested in creating a reserve of materials to mitigate supply chain issues and inflation, it may not be sufficient and ongoing delays, difficulty finding replacement products and continued high inflation could affect our business and growth and could have a material effect on our business. Additional or unexpected disruptions to our supply chain or inflationary pressures could significantly affect the cost of our planned expansion projects and interfere with our ability to meet commitments to customers who have contracted for space in new IBX data centers under construction.
Construction projects are dependent on permitting from public agencies and utility companies. Any delay in permitting could affect our growth. We are currently experiencing permitting delays in most metros due to reduced production from labor availability and from other COVID-19 pandemic related permitting restrictions or stoppages. While we don't currently anticipate any material long-term negative impact to our business because of these construction delays, these types of delays and stoppages related to permitting from public agencies and utility companies could worsen and have an adverse effect on our bookings, revenue or growth.
Additionally, all construction related projects require us to carefully select and rely on the experience of one or more designers, general contractors, and associated subcontractors during the design and construction process. Should a designer, general contractor, significant subcontractor or key supplier experience financial problems or other problems during the design or construction process, we could experience significant delays, increased costs to complete the project and/or other negative impacts to our expected returns.
Site selection is also a critical factor in our expansion plans. There may not be suitable properties available in our markets with the necessary combination of high-power capacity and fiber connectivity, or selection may be
limited. We expect that we will continue to experience limited availability of power and grid constraints in many markets as well as shortages of associated equipment because of the current high demands and finite nature of these resources. These shortages could result in site selection challenges, construction delays or increased costs. Thus, while we may prefer to locate new IBX data centers adjacent to our existing locations, it may not always be possible. In the event we decide to build new IBX data centers separate from our existing IBX data centers, we may provide metro connect solutions to connect these two IBX data centers. Should these solutions not provide the necessary reliability to sustain connection, or if they do not meet the needs of our customers, this could result in lower interconnection revenue and lower margins and could have a negative impact on customer retention over time.
Acquisitions present many risks, and we may not realize the financial or strategic goals that were contemplated at the time of any transaction.
Over the last several years, we have completed numerous acquisitions, including most recently that of five data centers in Peru and Chile from Entel in 2022, MainOne in West Africa in 2022, and GPX Global System's, Inc.'s India operations in 2021. We expect to make additional acquisitions in the future, which may include (i) acquisitions of businesses, products, solutions or technologies that we believe to be complementary, (ii) acquisitions of new IBX data centers or real estate for development of new IBX data centers; (iii) acquisitions through investments in local data center operators; or (iv) acquisitions in new markets with higher risk profiles. We may pay for future acquisitions by using our existing cash resources (which may limit other potential uses of our cash), incurring additional debt (which may increase our interest expense, leverage and debt service requirements) and/or issuing shares (which may dilute our existing stockholders and have a negative effect on our earnings per share). Acquisitions expose us to potential risks, including:
•the possible disruption of our ongoing business and diversion of management's attention by acquisition, transition and integration activities, particularly when multiple acquisitions and integrations are occurring at the same time or when we are entering an emerging market with a higher risk profile;
•our potential inability to successfully pursue or realize some or all of the anticipated revenue opportunities associated with an acquisition or investment;
•the possibility that we may not be able to successfully integrate acquired businesses, or businesses in which we invest, or achieve anticipated operating efficiencies or cost savings;
•the possibility that announced acquisitions may not be completed, due to failure to satisfy the conditions to closing as a result of:
•an injunction, law or order that makes unlawful the consummation of the acquisition;
•inaccuracy or breach of the representations and warranties of, or the non-compliance with covenants by, either party;
•the nonreceipt of closing documents; or
•for other reasons;
•the possibility that there could be a delay in the completion of an acquisition, which could, among other things, result in additional transaction costs, loss of revenue or other adverse effects resulting from such uncertainty;
•the possibility that our projections about the success of an acquisition could be inaccurate and any such inaccuracies could have a material adverse effect on our financial projections;
•the dilution of our existing stockholders as a result of our issuing stock as consideration in a transaction or selling stock in order to fund the transaction;
•the possibility of customer dissatisfaction if we are unable to achieve levels of quality and stability on par with past practices;
•the possibility that we will be unable to retain relationships with key customers, landlords and/or suppliers of the acquired businesses, some of which may terminate their contracts with the acquired business as a result of the acquisition or which may attempt to negotiate changes in their current or future business relationships with us;
•the possibility that we could lose key employees from the acquired businesses;
•the possibility that we may be unable to integrate certain IT systems that do not meet Equinix's standard requirements with respect to security, privacy or any other standard;
•the potential deterioration in our ability to access credit markets due to increased leverage;
•the possibility that our customers may not accept either the existing equipment infrastructure or the "look-and-feel" of a new or different IBX data center;
•the possibility that additional capital expenditures may be required or that transaction expenses associated with acquisitions may be higher than anticipated;
•the possibility that required financing to fund an acquisition may not be available on acceptable terms or at all;
•the possibility that we may be unable to obtain required approvals from governmental authorities under antitrust and competition laws on a timely basis or at all, which could, among other things, delay or prevent us from completing an acquisition, limit our ability to realize the expected financial or strategic benefits of an acquisition or have other adverse effects on our current business and operations;
•the possible loss or reduction in value of acquired businesses;
•the possibility that future acquisitions may present new complexities in deal structure, related complex accounting and coordination with new partners, particularly in light of our desire to maintain our qualification for taxation as a REIT;
•the possibility that we may not be able to prepare and issue our financial statements and other public filings in a timely and accurate manner, and/or maintain an effective control environment, due to the strain on the finance organization when multiple acquisitions and integrations are occurring at the same time;
•the possibility that future acquisitions may trigger property tax reassessments resulting in a substantial increase to our property taxes beyond that which we anticipated;
•the possibility that future acquisitions may be in geographies and regulatory environments to which we are unaccustomed and we may become subject to complex requirements and risks with which we have limited experience;
•the possibility that future acquisitions may appear less attractive due to fluctuations in foreign currency rates;
•the possibility that carriers may find it cost-prohibitive or impractical to bring fiber and networks into a new IBX data center;
•the possibility of litigation or other claims in connection with, or as a result of, an acquisition, including claims from terminated employees, customers, former stockholders or other third parties;
•the possibility that asset divestments may be required in order to obtain regulatory clearance for a transaction;
•the possibility of pre-existing undisclosed liabilities, including, but not limited to, lease or landlord related liability, tax liability, environmental liability or asbestos liability, for which insurance coverage may be insufficient or unavailable, or other issues not discovered in the diligence process;
•the possibility that we receive limited or incorrect information about the acquired business in the diligence process; and
•the possibility that we do not have full visibility into customer agreements and customer termination rights during the diligence process which could expose us to additional liabilities after completing the acquisition.
The occurrence of any of these risks could have a material adverse effect on our business, results of operations, financial condition or cash flows. If an acquisition does not proceed or is materially delayed for any reason, the price of our common stock may be adversely impacted, and we will not recognize the anticipated benefits of the acquisition.
We cannot assure that the price of any future acquisitions of IBX data centers will be similar to prior IBX data center acquisitions. In fact, we expect costs required to build or render new IBX data centers operational to increase in the future. If our revenue does not keep pace with these potential acquisition and expansion costs, we may not be able to maintain our current or expected margins as we absorb these additional expenses. There is no assurance we would successfully overcome these risks, or any other problems encountered with these acquisitions.
The anticipated benefits of our joint ventures may not be fully realized, or take longer to realize than expected.
We have entered into joint ventures to develop and operate xScale™ data centers (together, the “Joint Ventures”). Equinix owns a 20% interest and our JV partners own an 80% interest in each joint venture, and Equinix operates all facilities.
Certain sites that are intended to be utilized in Joint Ventures require investment for development. The success of these Joint Ventures will depend, in part, on the successful development of the data center sites, and we may not realize all of the anticipated benefits. Such development may be more difficult, time-consuming or costly than expected and could result in increased costs, decreases in the amount of expected revenues and diversion of
management's time and energy, which could materially impact our business, financial condition and results of operations. Additionally, if it is determined these sites are no longer desirable for the Joint Ventures, we would need to adapt such sites for other purposes.
We may not realize all of the anticipated benefits from our Joint Ventures. The success of these Joint Ventures will depend, in part, on the successful partnership between Equinix and our JV partners. Such a partnership is subject to risks as outlined below in our risk factor related to Joint Ventures, and more generally, to the same types of business risks as would impact our IBX data center business. A failure to successfully partner, or a failure to realize our expectations for the Joint Ventures, including any contemplated exit strategy from a Joint Venture, could materially impact our business, financial condition and results of operations. These Joint Ventures could also be negatively impacted by inflation, supply chain issues, an inability to obtain financing on favorable terms or at all, an inability to fill the xScale sites with customers as planned, and development and construction delays, including those we are currently experiencing in many markets globally.
Joint venture investments could expose us to risks and liabilities in connection with the formation of the new joint ventures, the operation of such joint ventures without sole decision-making authority, and our reliance on joint venture partners who may have economic and business interests that are inconsistent with our business interests.
In addition to our current and proposed Joint Ventures, we may co-invest with other third parties through partnerships, joint ventures or other entities in the future. These joint ventures could result in our acquisition of non-controlling interests in, or shared responsibility for, managing the affairs of a property or portfolio of properties, partnership, joint venture or other entity. We may be subject to additional risks, including:
•we may not have the right to exercise sole decision-making authority regarding the properties, partnership, joint venture or other entity;
•if our partners become bankrupt or fail to fund their share of required capital contributions, we may choose to or be required to contribute such capital;
•our partners may have economic, tax or other business interests or goals which are inconsistent with our business interests or goals, and may be in a position to take actions contrary to our policies or objectives;
•our joint venture partners may take actions that are not within our control, which could require us to dispose of the joint venture asset, transfer it to a taxable REIT subsidiary ("TRS") in order to maintain our qualification for taxation as a REIT, or purchase the partner's interests or assets at an above-market price;
•our joint venture partners may take actions unrelated to our business agreement but which reflect poorly on us because of our joint venture;
•disputes between us and our partners may result in litigation or arbitration that would increase our expenses and prevent our management from focusing their time and effort on our day-to-day business;
•we may in certain circumstances be liable for the actions of our third-party partners or guarantee all or a portion of the joint venture's liabilities, which may require us to pay an amount greater than its investment in the joint venture; and
•a joint venture partner's decision to exit the joint venture may not be at an opportune time for us or in our business interests.
Each of these factors may result in returns on these investments being less than we expect or in losses, and our financial and results of operations may be adversely affected.
If we cannot effectively manage our international operations, and successfully implement our international expansion plans, or comply with evolving laws and regulations, our revenues may not increase, and our business and results of operations would be harmed.
For the years ended December 31, 2022, 2021 and 2020, we recognized approximately 61%, 61% and 59%, respectively, of our revenues outside the U.S. We currently operate outside of the U.S. in Canada, Mexico, South America, the Asia-Pacific region and, the EMEA region.
In addition, we are currently undergoing expansions or evaluating expansion opportunities outside of the U.S. Undertaking and managing expansions in foreign jurisdictions may present unanticipated challenges to us.
Our international operations are generally subject to a number of additional risks, including:
•the costs of customizing IBX data centers for foreign countries;
•protectionist laws and business practices favoring local competition;
•greater difficulty or delay in accounts receivable collection;
•difficulties in staffing and managing foreign operations, including negotiating with foreign labor unions or workers' councils;
•difficulties in managing across cultures and in foreign languages;
•political and economic instability;
•fluctuations in currency exchange rates;
•difficulties in repatriating funds from certain countries;
•our ability to obtain, transfer or maintain licenses required by governmental entities with respect to our business;
•unexpected changes in regulatory, tax and political environments such as the United Kingdom's withdrawal from the European Union ("Brexit"), the Hong Kong national security law, and the current trade war between the U.S. and China;
•our ability to secure and maintain the necessary physical and telecommunications infrastructure;
•compliance with anti-bribery and corruption laws;
•compliance with economic and trade sanctions enforced by the Office of Foreign Assets Control of the U.S. Department of Treasury and other enforcement agencies in other jurisdictions around the world including those related to the Russian and Ukrainian war;
•compliance with changing laws, policies and requirements related to sustainability;
•compliance with evolving governmental regulation with which we have little experience; and
•compliance with evolving and varied regulations related to the ongoing COVID-19 pandemic.
Geo-political events, such as the COVID-19 pandemic, Brexit, the Hong Kong national security law, the trade war between the U.S. and China and the war between Russia and Ukraine, may increase the likelihood of the listed risks to occur and could have a negative effect on our business domestically or internationally. With respect to Brexit, it is possible that the level of economic activity in the United Kingdom and the rest of Europe will be adversely impacted and that we will face increased regulatory and legal complexities in these regions which could have an adverse impact on our business and employees in EMEA and could adversely affect our financial condition and results of operations. In addition, compliance with international and U.S. laws and regulations that apply to our international operations increases our cost of doing business in foreign jurisdictions. These laws and regulations include the General Data Protection Regulation ("GDPR") and other data privacy laws and requirements, labor relations laws, tax laws, anti-competition regulations, import and trade restrictions, export requirements, economic and trade sanctions, U.S. laws such as the Foreign Corrupt Practices Act and local laws which also prohibit corrupt payments to governmental officials. With respect to the current trade war between the U.S. and China, we have several customers in China named in restrictive executive orders by the previous U.S. administration that are currently covered by a freeze issued by the current U.S. administration or currently enjoined from enforcement subject to pending litigation. If Equinix is required to cease business with these companies, or additional companies in the future, our revenues could be adversely affected. Violations of any of these domestic or international laws and regulations could result in fines, criminal sanctions against us, our officers or our employees, and prohibitions on the conduct of our business. Any such violations could include prohibitions on our ability to provide our offerings in one or more countries, could delay or prevent potential acquisitions, and could also materially damage our reputation, our brand, our international expansion efforts, our ability to attract and retain employees, our business and results of operations. Our success depends, in part, on our ability to anticipate and address these risks and manage these difficulties.
We continue to invest in our expansion efforts but may not have sufficient customer demand in the future to realize expected returns on these investments.
We are considering the acquisition or lease of additional properties and the construction of new IBX data centers beyond those expansion projects already announced. We will be required to commit substantial operational and financial resources to these IBX data centers, generally 12 to 18 months in advance of securing customer contracts, and we may not have sufficient customer demand in those markets to support these IBX data centers once they are built. In addition, unanticipated technological changes could affect customer requirements for data centers, and we may not have built such requirements into our new IBX data centers. Either of these contingencies, if they were to occur, could make it difficult for us to realize expected or reasonable returns on these investments.
Risks Related to Our Capital Needs and Capital Strategy
Our substantial debt could adversely affect our cash flows and limit our flexibility to raise additional capital.
We have a significant amount of debt and may need to incur additional debt to support our growth. Additional debt may also be incurred to fund future acquisitions, any future special distributions, regular distributions or the other cash outlays associated with maintaining our qualification for taxation as a REIT. As of December 31, 2022, our total indebtedness (gross of debt issuance cost, debt discount, and debt premium) was approximately $15.2 billion, our stockholders' equity was $11.5 billion and our cash and cash equivalents totaled $1.9 billion. In addition, as of December 31, 2022, we had approximately $3.9 billion of additional liquidity available to us from our $4.0 billion revolving credit facility. In addition to our substantial debt, we lease many of our IBX data centers and certain equipment under lease agreements, some of which are accounted for as operating leases. As of December 31, 2022, we recorded operating lease liabilities of $1.4 billion, which represents our obligation to make lease payments under those lease arrangements.
Our substantial amount of debt and related covenants, and our off-balance sheet commitments, could have important consequences. For example, they could:
•require us to dedicate a substantial portion of our cash flow from operations to make interest and principal payments on our debt and in respect of other off-balance sheet arrangements, reducing the availability of our cash flow to fund future capital expenditures, working capital, execution of our expansion strategy and other general corporate requirements;
•increase the likelihood of negative outlook from our credit rating agencies, or of a downgrade to our current rating;
•make it more difficult for us to satisfy our obligations under our various debt instruments;
•increase our cost of borrowing and even limit our ability to access additional debt to fund future growth;
•increase our vulnerability to general adverse economic and industry conditions and adverse changes in governmental regulations;
•limit our flexibility in planning for, or reacting to, changes in our business and industry, which may place us at a competitive disadvantage compared with our competitors;
•limit our operating flexibility through covenants with which we must comply;
•limit our ability to borrow additional funds, even when necessary to maintain adequate liquidity, which would also limit our ability to further expand our business; and
•make us more vulnerable to increases in interest rates because of the variable interest rates on some of our borrowings to the extent we have not entirely hedged such variable rate debt.
The occurrence of any of the foregoing factors could have a material adverse effect on our business, results of operations and financial condition.
We may also need to refinance a portion of our outstanding debt as it matures. There is a risk that we may not be able to refinance existing debt or that the terms of any refinancing may not be as favorable as the terms of our existing debt. Furthermore, if prevailing interest rates or other factors at the time of refinancing result in higher
interest rates upon refinancing, then the interest expense relating to that refinanced indebtedness would increase. These risks could materially adversely affect our financial condition, cash flows and results of operations.
Sales or issuances of shares of our common stock may adversely affect the market price of our common stock.
Future sales or issuances of common stock or other equity related securities may adversely affect the market price of our common stock, including any shares of our common stock issued to finance capital expenditures, finance acquisitions or repay debt. In November 2022, we established a successor "at the market" equity offering program (the "2022 ATM Program") in the amount of $1.5 billion under which we may, from time to time, issue and sell shares of our common stock to or through sales agents up to established limits. As of December 31, 2022, we had $1.4 billion available for sale under the 2022 ATM Program. We expect to refresh our ATM program periodically, which could lead to additional dilution for our stockholders in the future. We may also seek authorization to sell additional shares of common stock through other means which could lead to additional dilution for our stockholders. Please see Note 12 within the Consolidated Financial Statements of this Annual Report on Form 10-K for sales of our common stock under our ATM programs.
If we are not able to generate sufficient operating cash flows or obtain external financing, our ability to fund incremental expansion plans may be limited.
Our capital expenditures, together with ongoing operating expenses, obligations to service our debt and the cash outlays associated with our REIT distribution requirements, are, and will continue to be, a substantial burden on our cash flow and may decrease our cash balances. Additional debt or equity financing may not be available when needed or, if available, may not be available on satisfactory terms. Our inability to obtain additional debt and/or equity financing or to generate sufficient cash from operations may require us to prioritize projects or curtail capital expenditures which could adversely affect our results of operations.
Our derivative transactions expose us to counterparty credit risk.
Our derivative transactions expose us to risk of financial loss if a counterparty fails to perform under a derivative contract. Disruptions in the financial markets could lead to sudden decreases in a counterparty's liquidity, which could make them unable to perform under the terms of their derivative contract and we may not be able to realize the benefit of the derivative contract.
Risks Related to Environmental Laws and Climate Change Impacts
Environmental regulations may impose upon us new or unexpected costs.
We are subject to various federal, state and local environmental and health and safety laws and regulations in the United States and at our non-U.S. locations, including those relating to the generation, storage, handling and disposal of hazardous substances and wastes. Certain of these laws and regulations also impose joint and several liability, without regard to fault, for investigation and cleanup costs on current and former owners and operators of real property and persons who have disposed of or released hazardous substances into the environment. Our operations involve the use of hazardous substances and materials such as petroleum fuel for emergency generators, as well as batteries, cleaning solutions and other materials. At some of our locations, hazardous substances or regulated materials are known to be present in soil or groundwater, and there may be additional unknown hazardous substances or regulated materials present at sites we own, operate or lease. At some of our locations, there are land use restrictions in place relating to earlier environmental cleanups that do not materially limit our use of the sites. To the extent any hazardous substances or any other substance or material must be cleaned up or removed from our property, we may be responsible under applicable laws, permits or leases for the removal or cleanup of such substances or materials, the cost of which could be substantial.
We purchase significant amounts of electricity from generating facilities and utility companies that are subject to environmental laws, regulations and permit requirements. These environmental requirements are subject to material change, which could result in increases in our electricity suppliers' compliance costs that may be passed through to us. Regulations promulgated by the U.S. EPA or state agencies, or by regulators in other countries, could limit air emissions from fossil fuel-fired power plants, restrict discharges of cooling water, and otherwise impose new operational restraints on power plants that could increase costs of electricity. Regulatory programs intended to promote increased generation of electricity from renewable sources may also increase our costs of procuring electricity. In addition, we are directly subject to environmental, health and safety laws regulating air emissions, storm water management and other issues arising in our business. For example, our emergency generators are subject to state and federal regulations governing air pollutants, which could limit the operation of those generators or require the installation of new pollution control technologies. While environmental regulations do not normally impose material costs upon our operations, unexpected events, equipment malfunctions, human error and changes in law or regulations, among other factors, can lead to additional capital requirements, limitations upon our operations and unexpected increased costs.
Regulation of greenhouse gas ("GHG") emissions could increase our costs of doing business, for example by increasing the cost of electricity by reducing amounts of electricity generated from fossil fuels, by requiring the use of more expensive generating methods, by requiring capture, management or reduction of GHG emissions, or by imposing taxes or fees upon electricity or GHG emissions. In recent years, there has been interest in the U.S. and in countries where we operate abroad in regulating GHG emissions and otherwise addressing risks related to climate change. For example, in the U.S., new regulations and legislation have been proposed or enacted during the Biden Administration that limit or otherwise seeks to discourage carbon dioxide emissions and the use of fossil fuels. Such regulations and legislation have included or may in the future include measures ranging from direct regulation of GHG emissions to "carbon taxes," and tax incentives to promote the development and use of renewable energy and otherwise lower GHG emissions. Other countries in which we operate may also impose requirements and restrictions on GHG emissions.
In the U.S., state regulations also have the potential to increase our costs of obtaining electricity. Certain U.S. states in which we operate have issued or are considering and may enact environmental regulations that could materially affect our facilities and electricity costs. For example, California has limited GHG emissions from new and existing conventional power plants by imposing regulatory caps and by auctioning the rights to emission allowances. Multiple other states have issued regulations (or are considering regulations) to implement carbon cap and trade programs, carbon pricing programs and other mechanisms designed to limit GHG emissions.
To date, regulations aimed at reducing GHG emissions have not had a material adverse effect on our electricity costs, but potential new regulatory requirements and the market-driven nature of some of the programs could have a material adverse effect on electricity costs in the future. U.S. and global environmental regulations are expected to continue to change and evolve and may impose upon us new or unexpected costs. Concern about climate change and sustainability in various jurisdictions may result in more stringent laws and regulatory requirements regarding emissions of carbon dioxide or other GHGs. Restrictions on carbon dioxide or other GHG emissions could result in significant increases in operating or capital costs, including higher energy costs generally, and increased costs from carbon taxes, emission cap and trade programs and renewable portfolio standards that are imposed upon our electricity suppliers. These higher energy costs, and the cost of complying across our global platform or of failing to comply with these and any other climate change regulations, may have an adverse effect on our business and our results of operations. The course of future legislation and regulation in the U.S. and abroad remains difficult to predict and the potential increased costs associated with national or supra-national GHG regulation and other government policies cannot be estimated at this time.
Our business may be adversely affected by physical risks related to climate change and responses to it.
Severe weather events, such as droughts, fires, flooding, heat waves, hurricanes, typhoons and winter storms, pose a threat to our IBX data centers and our customers' IT infrastructure through physical damage to facilities or equipment, power supply disruption, and long-term effects on the cost of electricity. The frequency and intensity of severe weather events are reportedly increasing as part of broader climate changes. Changes in global weather patterns may also pose long-term risks of physical impacts to our business.
We maintain disaster recovery and business continuity plans that would be implemented in the event of severe weather events that interrupt our business or affect our customers' IT infrastructure housed in our IBX data centers. While these plans are designed to allow us to recover from natural disasters or other events that can interrupt our
business, we cannot be certain that our plans will work as intended, to mitigate the impacts of such disasters or events. Failure to prevent impact to customers from such events could adversely affect our business.
We may fail to achieve our ESG and sustainability goals, or may encounter objections to them, either of which may adversely affect public perception of our business and affect our relationship with our customers, our stockholders and/or other stakeholders.
We have prioritized sustainability and ESG objectives, including long term goals of procuring 100% clean and renewable energy coverage and reducing our GHG emissions from our operations and supply chain. We also face pressure from our customers, stockholders and other stakeholders, such as the communities in which we operate, who are increasingly focused on climate change, to prioritize renewable energy procurement, reduce our carbon footprint and promote sustainable practices. To address these goals and concerns, where possible, we plan to continue to scale our renewable energy strategy, seek low-carbon alternatives for traditional fuel sources, use refrigerants that pose fewer risks of environmental impact, and pursue opportunities to improve energy and water efficiency. As a result of these and other initiatives, we intend to make progress towards reducing our environmental impact and global carbon footprint, as well as ensuring that our business remains viable in a low-carbon economy.
Pursing these objectives involves additional costs for conducting our business. For example, developing and acting on ESG initiatives, including collecting, measuring, and reporting information, goals and other metrics can be costly, difficult and time consuming. We have separately undertaken efforts to procure coverage from renewable energy projects in order to support availability in new renewables development. These efforts to support and enhance renewable electricity generation may increase our costs of electricity above those that would be incurred through procurement of conventional electricity from existing sources or through conventional grids. Reducing our carbon footprint may require physical or operational modifications that may be costly. These initiatives could adversely affect our financial position and results of operations.
There is also a risk that our ESG and sustainability objectives will not be successful. It is possible that we may fail to reach our stated environmental goals in a timely manner or that our customers, stockholders or members of our communities might not be satisfied with our sustainability efforts or the speed of their adoption. Our customers, shareholders or others may object to our ESG and sustainability objectives or the manner in which we seek to achieve such objectives. A failure to meet our environmental goals, or significant controversy regarding these goals, could adversely affect public perception of our business, employee morale or customer, stockholder or community support. If we do not meet our customers' or stockholders' expectations regarding those initiatives, or lose support in our communities, our business and/or our share price could be harmed.
There is some indication that ESG and sustainability goals are becoming more controversial, as some governmental entities in the U.S. and certain investor constituencies question the appropriateness of or object to ESG and sustainability initiatives. Some investors may use ESG-related factors to guide their investment strategies and may choose not to invest in us, a factor that would tend to reduce demand for our shares and possibly affect our share price adversely. We also may face potential governmental enforcement actions or private litigation challenging our ESG and sustainability goals, or our disclosure of those goals and our metrics for measuring achievement of them. New or changing regulation or public opinion regarding our ESG and sustainability goals or our actions to achieve them may result in adverse effects on our financial performance, reputation or demand for our services and products, or may otherwise result in obligations and liabilities that cannot predicted or estimated at this time.
Risks Related to Certain Regulations and Laws, Including Tax Laws
Changes in U.S. or foreign tax laws, regulations, or interpretations thereof, including changes to tax rates, may adversely affect our financial statements and cash taxes.
We are a U.S. company with global subsidiaries and are subject to income and other taxes in the U.S. (although currently limited due to our taxation as a REIT) and many foreign jurisdictions. Significant judgment is required in determining our worldwide provision for income and other taxes. Although we believe that we have adequately assessed and accounted for our potential tax liabilities, and that our tax estimates are reasonable, there can be no certainty that additional taxes will not be due upon audit of our tax returns or as a result of changes to the tax laws
and interpretations thereof. For example, we are currently undergoing audits in a number of jurisdictions where we operate. The final results of these audits are uncertain and may not be resolved in our favor.
The Organisation for Economic Co-operation and Development ("OECD") is an international association made up of over 30 countries including the U.S. The OECD has proposed and made numerous changes to long-standing tax principles, which, if adopted by the member countries, could have a materially adverse effect on our tax liabilities. For example, various foreign jurisdictions are starting to explore the taxation of digital services and the mechanism of levying a top-up tax through the adoption of OECD tax principles which could have a negative effect on our tax liability.
The ongoing COVID-19 pandemic has led to increased spending by many governments. Because of this, there could be pressure to increase taxes in the future to pay back debts and generate revenues. The nature and timing of any future changes to each jurisdiction's tax laws and the impact on our future tax liabilities because of the COVID-19 pandemic or for any other reason cannot be predicted with any accuracy but could materially and adversely impact our results of operations and financial position or cash flows.
Government regulation or failure to comply with laws and regulations may adversely affect our business.
Various laws and governmental regulations, both in the U.S. and abroad, governing internet-related services, related communications services and information technologies remain largely unsettled, even in areas where there has been some legislative action. For example, the Federal Communications Commission ("FCC") recently overturned network neutrality rules, which may result in material changes in the regulations and contribution regime affecting us and our customers. Furthermore, the U.S. Congress and state legislatures are reviewing and considering changes to the new FCC rules making the future of network neutrality uncertain. Changes to these laws and regulations could have a material adverse effect on us and our customers. There may also be forthcoming regulation in the U.S. on a federal or state level in the areas of cybersecurity, data privacy, sustainability, taxation and data security, any of which could impact us and our customers. Similarly, data privacy regulations continue to evolve and must be addressed by Equinix as a global company.
Additionally, laws and regulations related to economic sanctions, export controls, anti-bribery and anti-corruption, and other international activities may restrict or limit our ability to engage in transactions or dealings with certain counterparties, in or with certain countries or territories, or in certain activities. We cannot guarantee compliance with all such laws and regulations, and failure to comply with such laws and regulations could expose us to fines, penalties, or costly and expensive investigations.
We remain focused on whether and how existing and changing laws, such as those governing intellectual property, privacy, libel, telecommunications services, data flows/data localization, carbon emissions impact, competition and antitrust, and taxation apply to our business and those which might have a material effect on our customers’ decisions to purchase our solutions. Substantial resources may be required to comply with regulations or bring any non-compliant business practices into compliance with such regulations. In addition, the continuing development of the market for online commerce and the displacement of traditional telephony service by the internet and related communications services may prompt an increased call for more stringent consumer protection laws or other regulation both in the U.S. and abroad that may impose additional burdens on companies conducting business online and their service providers.
Our business was designated "critical infrastructure" or "essential services" which allowed our data centers to remain open in many jurisdictions during the COVID-19 pandemic. Any regulations restricting our ability to operate our business due to the COVID-19 pandemic or for any other reason could have a material adverse effect on our business. Additionally, these "essential services" and "critical infrastructure" designations could lead countries or local regulators to impose additional regulations on the data center industry in order to have better visibility and control over our industry for future events and crises.
We strive to comply with all laws and regulations that apply to our business. However, as these laws evolve, they can be subject to varying interpretations and regulatory discretion. To the extent a regulator or court disagrees with our interpretation of these laws and determines that our practices are not in compliance with applicable laws and regulations, we could be subject to civil and criminal penalties that could adversely affect our business operations. The adoption, or modification of laws or regulations relating to the internet and our business, or
interpretations of existing laws, could have a material adverse effect on our business, financial condition and results of operations.
Our business could be adversely affected if we are unable to maintain our complex global legal entity structure.
We maintain a complex global organizational structure, containing numerous legal entities of varied types and serving various purposes, in each country in which we operate. For example, in order to maintain our qualification as a REIT for U.S. federal income tax purposes, a large portion of our gross income for each taxable year must be derived from real estate. To facilitate meeting this REIT compliance requirement, we use TRSs and qualified REIT subsidiaries ("QRSs") in order to segregate our income between net income from real estate and net income from TRSs. This results in almost double the number of entities we would typically need if we were not maintaining qualification as a REIT.
Additionally, we maintain certain other region-specific organizational structures for various tax, legal and other business purposes. The organization, maintenance and reporting requirements for our entity structure are complex and require coordination amongst many teams within Equinix and the use of outside service providers. While we use automation tools and software where possible to manage this process, some work continues to be manual. We believe we have adequate controls in place to manage these complex structures, but if our controls fail, there could be significant legal and tax implications to our business and our operations including but not limited to material tax and legal liabilities.
Risks Related to Our REIT Status in the US
We may not remain qualified for taxation as a REIT.
We elected to be taxed as a REIT for U.S. federal income tax purposes beginning with our 2015 taxable year. We believe that our organization and method of operation comply with the rules and regulations promulgated under the Internal Revenue Code of 1986, as amended (the "Code"), such that we will continue to qualify for taxation as a REIT. However, we cannot assure you that we have qualified for taxation as a REIT or that we will remain so qualified. Qualification for taxation as a REIT involves the application of highly technical and complex provisions of the Code to our operations as well as various factual determinations concerning matters and circumstances not entirely within our control. There are limited judicial or administrative interpretations of applicable REIT provisions of the Code.
If, in any taxable year, we fail to remain qualified for taxation as a REIT and are not entitled to relief under the Code:
•we will not be allowed a deduction for distributions to stockholders in computing our taxable income;
•we will be subject to U.S. federal and state income tax on our taxable income at regular corporate income tax rates; and
•we would not be eligible to elect REIT status again until the fifth taxable year that begins after the first year for which we failed to qualify for taxation as a REIT.
Any such corporate tax liability could be substantial and would reduce the amount of cash available for other purposes. If we fail to remain qualified for taxation as a REIT, we may need to borrow additional funds or liquidate some investments to pay any additional tax liability. Accordingly, funds available for investment and distributions to stockholders could be reduced.
As a REIT, failure to make required distributions would subject us to federal corporate income tax.
We paid quarterly distributions in each quarter of 2022 and have declared a quarterly distribution to be paid on March 22, 2023. The amount, timing and form of any future distributions will be determined, and will be subject to adjustment, by our Board of Directors. To remain qualified for taxation as a REIT, we are generally required to distribute at least 90% of our REIT taxable income (determined without regard to the dividends paid deduction and excluding net capital gain) each year, or in limited circumstances, the following year, to our stockholders. Generally, we expect to distribute all or substantially all of our REIT taxable income. If our cash available for distribution falls
short of our estimates, we may be unable to maintain distributions that approximate our REIT taxable income and may fail to remain qualified for taxation as a REIT. In addition, our cash flows from operations may be insufficient to fund required distributions as a result of differences in timing between the actual receipt of income and the payment of expenses and the recognition of income and expenses for federal income tax purposes, or the effect of nondeductible expenditures, such as capital expenditures, payments of compensation for which Section 162(m) of the Code denies a deduction, interest expense deductions limited by Section 163(j) of the Code, the creation of reserves or required debt service or amortization payments.
To the extent that we satisfy the 90% distribution requirement but distribute less than 100% of our REIT taxable income, we will be subject to federal corporate income tax on our undistributed taxable income. In addition, we will be subject to a 4% nondeductible excise tax on our undistributed taxable income if the actual amount that we distribute to our stockholders for a calendar year is less than the minimum amount specified under the Code.
Complying with REIT requirements may limit our flexibility or cause us to forgo otherwise attractive opportunities.
To remain qualified for taxation as a REIT for U.S. federal income tax purposes, we must satisfy tests concerning, among other things, the sources of our income, the nature and diversification of our assets and the amounts we distribute to our stockholders. For example, under the Code, no more than 20% of the value of the assets of a REIT may be represented by securities of one or more TRSs. Similar rules apply to other nonqualifying assets. These limitations may affect our ability to make large investments in other non-REIT qualifying operations or assets. In addition, in order to maintain our qualification for taxation as a REIT, we must distribute at least 90% of our REIT taxable income, determined without regard to the dividends paid deduction and excluding any net capital gains. Even if we maintain our qualification for taxation as a REIT, we will be subject to U.S. federal income tax at regular corporate income tax rates for our undistributed REIT taxable income, as well as U.S. federal income tax at regular corporate income tax rates for income recognized by our TRSs; we also pay taxes in the foreign jurisdictions in which our international assets and operations are held and conducted regardless of our qualification for taxation as a REIT. Because of these distribution requirements, we will likely not be able to fund future capital needs and investments from operating cash flow. As such, compliance with REIT tests may hinder our ability to make certain attractive investments, including the purchase of significant nonqualifying assets and the material expansion of non-real estate activities.
Our use of TRSs, including for certain of our international operations, may cause us to fail to remain qualified for taxation as a REIT in the U.S.
Our operations include using TRSs to facilitate meeting the REIT compliance requirements. The net income of our TRSs is not fully included in our QRS, and income that is not included in our QRSs generally is not subject to the REIT income distribution requirement. Our ability to receive distributions from our TRSs is limited by the rules with which we must comply to maintain our qualification for taxation as a REIT. In particular, at least 75% of our gross income for each taxable year as a REIT must be derived from real estate. Consequently, no more than 25% of our gross income may consist of dividend income from our TRSs and other nonqualifying types of income. Thus, our ability to receive distributions from our TRSs may be limited and may impact our ability to fund distributions to our stockholders using cash flows from our TRSs.
Further, there may be limitations on our ability to accumulate earnings in our TRSs and the accumulation or reinvestment of significant earnings in our TRSs could result in adverse tax treatment. In particular, if the accumulation of cash in our TRSs causes (1) the fair market value of our securities in our TRSs to exceed 20% of the fair market value of our assets or (2) the fair market value of our securities in our TRSs and other nonqualifying assets to exceed 25% of the fair market value of our assets, then we will fail to remain qualified for taxation as a REIT. Further, a substantial portion of our TRSs are overseas, and a material change in foreign currency rates could also negatively impact our ability to remain qualified for taxation as a REIT.
The Code imposes limitations on the ability of our TRSs to utilize specified income tax deductions, including limits on the use of net operating losses and limits on the deductibility of interest expense.
Even if we remain qualified for taxation as a REIT, some of our business activities are subject to corporate level income tax and foreign taxes, which will continue to reduce our cash flows, and we will have potential deferred and contingent tax liabilities.
Even if we remain qualified for taxation as a REIT, we may be subject to some federal, state, local and foreign taxes, including taxes on any undistributed income, and state, local or foreign income, franchise, property and transfer taxes. In addition, we could in certain circumstances be required to pay an excise or penalty tax, which could be significant in amount, in respect of dealer property income or in order to utilize one or more relief provisions under the Code to maintain our qualification for taxation as a REIT.
A portion of our business is conducted through wholly-owned TRSs because certain of our business activities could generate nonqualifying REIT income as currently structured and operated. The income of our U.S. TRSs will continue to be subject to federal and state corporate income taxes. In addition, our international assets and operations will continue to be subject to taxation in the foreign jurisdictions where those assets are held or those operations are conducted. Any of these taxes would decrease our earnings and our available cash.
We will also be subject to a U.S. federal corporate level income tax at the highest regular corporate income tax rate on gain recognized from a sale of a REIT asset where our basis in the asset is determined by reference to the basis of the asset in the hands of a C corporation (such as an asset that we or our QRSs hold following the liquidation or other conversion of a former TRS). This tax is generally applicable to any disposition of such an asset during the five-year period after the date we first owned the asset as a REIT asset, to the extent of the built-in-gain based on the fair market value of such asset on the date we first held the asset as a REIT asset.
Our certificate of incorporation contains restrictions on the ownership and transfer of our stock, though they may not be successful in preserving our qualification for taxation as a REIT.
In order for us to remain qualified for taxation as a REIT, no more than 50% of the value of outstanding shares of our stock may be owned, beneficially or constructively, by five or fewer individuals at any time during the last half of each taxable year. In addition, rents from "affiliated tenants" will not qualify as qualifying REIT income if we own 10% or more by vote or value of the customer, whether directly or after application of attribution rules under the Code. Subject to certain exceptions, our certificate of incorporation prohibits any stockholder from owning, beneficially or constructively, more than (i) 9.8% in value of the outstanding shares of all classes or series of our capital stock or (ii) 9.8% in value or number, whichever is more restrictive, of the outstanding shares of any class or series of our capital stock. We refer to these restrictions collectively as the "ownership limits" and we included them in our certificate of incorporation to facilitate our compliance with REIT tax rules. The constructive ownership rules under the Code are complex and may cause the outstanding stock owned by a group of related individuals or entities to be deemed to be constructively owned by one individual or entity. As a result, the acquisition of less than 9.8% of our outstanding common stock (or the outstanding shares of any class or series of our stock) by an individual or entity could cause that individual or entity or another individual or entity to own constructively in excess of the relevant ownership limits. Any attempt to own or transfer shares of our common stock or of any of our other capital stock in violation of these restrictions may result in the shares being automatically transferred to a charitable trust or may be void. Even though our certificate of incorporation contains the ownership limits, there can be no assurance that these provisions will be effective to prevent our qualification for taxation as a REIT from being jeopardized, including under the affiliated tenant rule. Furthermore, there can be no assurance that we will be able to monitor and enforce the ownership limits. If the restrictions in our certificate of incorporation are not effective and, as a result, we fail to satisfy the REIT tax rules described above, then absent an applicable relief provision, we will fail to remain qualified for taxation as a REIT.
In addition, the ownership and transfer restrictions could delay, defer or prevent a transaction or a change in control that might involve a premium price for our stock or otherwise be in the best interest of our stockholders. As a result, the overall effect of the ownership and transfer restrictions may be to render more difficult or discourage any attempt to acquire us, even if such acquisition may be favorable to the interests of our stockholders.
General Risk Factors
The effects of the COVID-19 or any other pandemic could have a negative effect on our business, results of operations and financial condition.
We have continuously monitored our global operations in light of the COVID-19 pandemic. We have implemented procedures focusing on the health and safety of our employees, customers, partners and
communities, the continuity of our business offerings and compliance with governmental regulations and local public health guidance and ordinances. While our business operations have continued without interruption and our IBX data centers have remained fully operational to date, we cannot guarantee our business operations or our IBX data centers will not be negatively impacted in the future because of the COVID-19 or any other pandemic.
The market price of our stock may continue to be highly volatile, and the value of an investment in our common stock may decline.
The market price of the shares of our common stock has recently been and may continue to be highly volatile. General economic and market conditions, like the ones we are currently experiencing, and market conditions for telecommunications, data center and REIT stocks in general, may affect the market price of our common stock.
Announcements by us or others, or speculations about our future plans, may also have a significant impact on the market price of our common stock. These may relate to:
•news or regulations regarding the ongoing COVID-19 or any other pandemic;
•our results of operations or forecasts;
•new issuances of equity, debt or convertible debt by us, including issuances through any existing ATM Program;
•increases in market interest rates and changes in other general market and economic conditions, including inflationary concerns;
•changes to our capital allocation, tax planning or business strategy;
•our qualification for taxation as a REIT and our declaration of distributions to our stockholders;
•changes in U.S. or foreign tax laws;
•changes in management or key personnel;
•developments in our relationships with customers;
•announcements by our customers or competitors;
•changes in regulatory policy or interpretation;
•governmental investigations;
•changes in the ratings of our debt or stock by rating agencies or securities analysts;
•our purchase or development of real estate and/or additional IBX data centers;
•our acquisitions of complementary businesses; or
•the operational performance of our IBX data centers.
The stock market has from time to time experienced extreme price and volume fluctuations, which have particularly affected the market prices for telecommunications companies, and which have often been unrelated to their operating performance. These broad market fluctuations may adversely affect the market price of our common stock. One of the factors that investors may consider in deciding whether to buy or sell our common stock is our distribution rate as a percentage of our stock price relative to market interest rates. If market interest rates increase, prospective investors may demand a higher distribution rate or seek alternative investments paying higher dividends or interest. As a result, interest rate fluctuations and conditions in the capital markets may affect the market value of our common stock. Furthermore, companies that have experienced volatility in the market price of their stock have been subject to securities class action litigation. We may be the target of this type of litigation in the future. Securities litigation against us could result in substantial costs and/or damages, and divert management's attention from other business concerns, which could seriously harm our business.
Inadequate or inaccurate external and internal information, including budget and planning data, could lead to inaccurate financial forecasts and inappropriate financial decisions.
Our financial forecasts are dependent on estimates and assumptions regarding budget and planning data, market growth, foreign exchange rates, our ability to remain qualified for taxation as a REIT, and our ability to generate sufficient cash flow to reinvest in the business, fund internal growth, make acquisitions, pay dividends and meet our debt obligations. Our financial projections are based on historical experience and on various other
assumptions that our management believes to be reasonable under the circumstances and at the time they are made.
We continue to evolve our forecasting models as necessary and appropriate but if our predictions are inaccurate and our results differ materially from our forecasts, we could make inappropriate financial decisions. Additionally, inaccuracies in our models could adversely impact our compliance with REIT asset tests, future profitability, stock price and/or stockholder confidence.
Fluctuations in foreign currency exchange rates, especially the strength of the U.S. dollar, in the markets in which we operate internationally could harm our results of operations.
We have experienced and may continue to experience gains and losses resulting from fluctuations in foreign currency exchange rates. To date, the majority of revenues and costs in our international operations are denominated in foreign currencies. As we experienced in 2022, where our prices are denominated in U.S. Dollars, our sales and revenues could be adversely affected by declines in foreign currencies relative to the U.S. Dollar, thereby making our offerings more expensive in local currencies. We are also exposed to risks resulting from fluctuations in foreign currency exchange rates in connection with our international operations. To the extent we are paying contractors in foreign currencies, our operations could cost more than anticipated as a result of declines in the U.S. Dollar relative to foreign currencies. In addition, fluctuating foreign currency exchange rates have a direct impact on how our international results of operations translate into U.S. Dollars.
Although we currently undertake, and may decide in the future to further undertake, foreign exchange hedging transactions to reduce foreign currency transaction exposure, we do not currently intend to eliminate all foreign currency transaction exposure. In addition, REIT compliance rules may restrict our ability to enter into hedging transactions. Therefore, any weakness of the U.S. Dollar may have a positive impact on our consolidated results of operations because the currencies in the foreign countries in which we operate may translate into more U.S. Dollars. However, as we have experienced more recently, if the U.S. Dollar strengthens relative to the currencies of the foreign countries in which we operate, our consolidated financial position and results of operations may be negatively impacted as amounts in foreign currencies will generally translate into fewer U.S. Dollars. For additional information on foreign currency risks, refer to our discussion of foreign currency risk in "Quantitative and Qualitative Disclosures About Market Risk" included in Item 2 of this Annual Report on Form 10-K.
If our internal controls are found to be ineffective, our financial results or our stock price may be adversely affected.
Our most recent evaluation of our controls resulted in our conclusion that, as of December 31, 2022, in compliance with Section 404 of the Sarbanes-Oxley Act of 2002, our internal controls over financial reporting were effective. Our ability to manage our operations and growth through, for example, the integration of recently acquired businesses, the adoption of new accounting principles and tax laws, and our overhaul of our back office systems that, for example, support the customer experience from initial quote to customer billing and our revenue recognition process, will require us to further develop our controls and reporting systems and implement or amend new or existing controls and reporting systems in those areas where the implementation and integration is still ongoing. All of these changes to our financial systems and the implementation and integration of acquisitions create an increased risk of deficiencies in our internal controls over financial reporting. If, in the future, our internal control over financial reporting is found to be ineffective, or if a material weakness is identified in our controls over financial reporting, our financial results may be adversely affected. Investors may also lose confidence in the reliability of our financial statements which could adversely affect our stock price.
Terrorist activity, or other acts of violence, including violence stemming from the current climate of political and economic uncertainty, could adversely impact our business.
The continued threat of terrorist activity and other acts of war or hostility both domestically and abroad by terrorist organizations, organized crime organizations, or other criminals along with violence stemming from political unrest, contribute to a climate of political and economic uncertainty in many of the regions in which we operate. Due to existing or developing circumstances, we may need to incur additional costs in the future to provide enhanced security, including cyber security and physical security, which could have a material adverse effect on our business
and results of operations. These circumstances may also adversely affect our ability to attract and retain customers and employees, our ability to raise capital and the operation and maintenance of our IBX data centers.
We may be subject to securities class action and other litigation, which may harm our business and results of operations.
We may be subject to securities class action or other litigation. For example, securities class action litigation has often been brought against a company following periods of volatility in the market price of its securities. Litigation can be lengthy, expensive, and divert management's attention and resources. Results cannot be predicted with certainty and an adverse outcome in litigation could result in monetary damages or injunctive relief. Further, any payments made in settlement may directly reduce our revenue under U.S. GAAP and could negatively impact our results of operations for the period. For all of these reasons, litigation could seriously harm our business, results of operations, financial condition or cash flows.
We may not be able to protect our intellectual property rights.
We cannot make assurances that the steps taken by us to protect our intellectual property rights will be adequate to deter misappropriation of proprietary information or that we will be able to detect unauthorized use and take appropriate steps to enforce our intellectual property rights. We also are subject to the risk of litigation alleging infringement of third-party intellectual property rights. Any such claims could require us to spend significant sums in litigation, pay damages, develop non-infringing intellectual property or acquire licenses to the intellectual property that is the subject of the alleged infringement.
We have various mechanisms in place that may discourage takeover attempts.
Certain provisions of our certificate of incorporation and bylaws may discourage, delay or prevent a third party from acquiring control of us in a merger, acquisition or similar transaction that a stockholder may consider favorable. Such provisions include:
•ownership limitations and transfer restrictions relating to our stock that are intended to facilitate our compliance with certain REIT rules relating to share ownership;
•authorization for the issuance of "blank check" preferred stock;
•the prohibition of cumulative voting in the election of directors;
•limits on the persons who may call special meetings of stockholders;
•limits on stockholder action by written consent; and
•advance notice requirements for nominations to the Board of Directors or for proposing matters that can be acted on by stockholders at stockholder meetings.
In addition, Section 203 of the Delaware General Corporation Law, which restricts certain business combinations with interested stockholders in certain situations, may also discourage, delay or prevent someone from acquiring or merging with us.
ITEM 1B. Unresolved Staff Comments
There is no disclosure to report pursuant to Item 1B.
ITEM 2. Properties
Our executive offices are located in Redwood City, California, with sales offices in several cities throughout the U.S. Our Asia-Pacific headquarters office is located in Hong Kong and we also have sales offices in several cities throughout Asia-Pacific. Our EMEA headquarters office is located in Amsterdam, the Netherlands and we also have sales offices in several cities throughout EMEA.
The following tables present the locations of our leased and owned IBX data centers and xScaleTM data centers investments as of December 31, 2022.
| | | | | | | | | | | | | | | | | | | | |
| | AMERICAS |
| | Metro | | Leased (1) | | Owned (1) (2) |
| | Atlanta | | ● | | ● |
| | Bogota | | | | ● |
| | Boston | | | | ● |
| Calgary | | ● | | ● |
| Chicago | | ● | | ● |
| Culpeper | | | | ● |
| Dallas | | ● | | ● |
| Washington D.C./Ashburn | | ● | | ● |
| Denver | | ● | | ● |
| Houston | | | | ● |
| Kamloops | | | | ● |
| Lima | | | | ● |
| Los Angeles | | ● | | ● |
| Mexico City | | | | ● |
| Miami | | ● | | ● |
| Monterrey | | ● | | |
| Montreal | | ● | | |
| New York | | ● | | ● |
| Ottawa | | | | ● |
| Philadelphia | | ● | | |
| Rio de Janeiro | | ● | | ● |
| Santiago | | | | ● |
| Sao Paulo | | | | ● |
| Seattle | | ● | | ● |
| Silicon Valley | | ● | | ● |
| Saint John | | | | ● |
| Toronto | | ● | | ● |
| | Vancouver | | ● | | |
| | Winnipeg | | ● | | |
| | | | | | | | | | | | | | | | | | | | |
| | EMEA |
| | Metro | | Leased (1) | | Owned (1) (2) |
| | Abidjan | | | | ● |
| | Abu Dhabi | | ● | | |
| | Accra | | | | ● |
| | Amsterdam | | ● | | ● |
| | Barcelona | | ● | | |
| Bordeaux | | | | ● |
| Dubai | | ● | | |
| Dublin | | ● | | ● |
| Dusseldorf | | | | ● |
| East Netherlands | | ● | | |
| Frankfurt | | ● | | ● |
| Geneva | | ● | | |
| Genoa | | | | ● |
| Hamburg | | | | ● |
| Helsinki | | ● | | ● |
| Istanbul | | | | ● |
| Lagos | | | | ● |
| Lisbon | | | | ● |
| London | | ● | | ● |
| Madrid | | ● | | |
| Manchester | | ● | | ● |
| Milan | | ● | | ● |
| Munich | | ● | | ● |
| Muscat | | | | ● |
| Paris | | ● | | ● |
| Seville | | ● | | |
| Sofia | | | | ● |
| Stockholm | | ● | | ● |
| | Warsaw | | ● | | ● |
| | Zurich | | ● | | ● |
| | | | | | | | | | | | | | | | | |
| |
| | | | | |
| | | | |
| | | | |
| Asia-Pacific |
| Metro | | Leased (1) | | Owned (1) (2) |
| Adelaide | | | | ● |
| Brisbane | | | | ● |
| Canberra | | | | ● |
| Hong Kong | | ● | | |
| Melbourne | | | | ● |
| Mumbai | | ● | | |
| Osaka | | ● | | ● |
| Perth | | | | ● |
| Seoul | | ● | | |
| Singapore | | ● | | ● |
| Shanghai | | ● | | ● |
| Sydney | | ● | | ● |
| Tokyo | | ● | | ● |
| | | | |
| | | | |
| | | | |
| | | | |
(1)"●" denotes locations with one or more data centers.
(2)Owned sites include IBX data centers subject to long-term ground leases.
The following table presents an overview of our portfolio of IBX data centers as of December 31, 2022:
| | | | | | | | | | | | | | | | | | | | | | | | | | | | | |
| # of IBXs (1) | | Total Cabinet Capacity (1)(2) | | Cabinets Billed(1) | | Cabinet Utilization % (1)(3) | | MRR per Cabinet (1)(4) |
| Americas | 106 | | | 134,900 | | | 108,200 | | | 80 | % | | $ | 2,419 | |
| EMEA | 82 | | | 132,000 | | | 110,000 | | | 83 | % | | 1,654 | |
| Asia-Pacific | 48 | | | 77,600 | | | 64,100 | | | 83 | % | | 1,925 | |
| Total | 236 | | | 344,500 | | | 282,300 | | | | | |
(1)Excludes twelve unconsolidated entities (eleven xScale data centers and the MC1 IBX data center).
(2)Cabinets represent a specific amount of space within an IBX data center. Customers can combine and use multiple adjacent cabinets within an IBX data center, depending on their space requirements.
(3)The cabinet utilization rate represents the percentage of cabinet space billed versus total cabinet capacity, taking into consideration power limitations.
(4)MRR per cabinet represents average monthly recurring revenue recognized divided by the average number of cabinets billing during the fourth quarter of the year. Americas MRR per cabinet excludes Infomart non-IBX tenant income.
The following table presents a summary of our significant IBX data center expansion projects under construction as of December 31, 2022:
| | | | | | | | | | | | | | | | | | | | | | | | | | |
| Property | | Property Location | | Target Open Date | | Sellable Cabinets | | Total Capex (in Millions) (1) |
| Americas: | | | | | | | | |
| CL3 phase II | | Calgary | | Q1 2023 | | 550 | | | $ | 38 | |
| KA1 phase II | | Kamloops | | Q1 2023 | | 250 | | | 22 | |
| AT1 phases VI & VII | | Atlanta | | Q2 2023 | | 575 | | | 43 | |
| BG2 phase I | | Bogota | | Q2 2023 | | 550 | | | 45 | |
| DA11 phase II | | Dallas | | Q3 2023 | | 1,975 | | | 64 | |
| DC16 phase I | | Washington D.C. | | Q3 2023 | | 3,200 | | | 198 | |
| MT2 phase I | | Montreal | | Q3 2023 | | 500 | | | 28 | |
| SV11 phase II | | Silicon Valley | | Q3 2023 | | 1,450 | | | 60 | |
| DC21 phase III | | Washington D.C. | | Q4 2023 | | 1,325 | | | 31 | |
| SE4 phase III | | Seattle | | Q4 2023 | | 375 | | | 30 | |
| MT2 phase II | | Montreal | | Q4 2023 | | 500 | | | 22 | |
| MX2 phase III | | Mexico City | | Q2 2024 | | 1,200 | | | 56 | |
| NY11 phase IV | | New York | | Q2 2024 | | 550 | | | 87 | |
| NY3 phase I | | New York | | Q3 2024 | | 1,200 | | | 250 | |
| | | | | | 14,200 | | | 974 | |
| EMEA: | | | | | | | | |
| FR5 phase V | | Frankfurt | | Q1 2023 | | 650 | | | 43 | |
| LD8 phase IV | | London | | Q1 2023 | | 550 | | | 36 | |
| MD6 phase I | | Madrid | | Q1 2023 | | 600 | | | 5 | |
| PA6 phase II | | Paris | | Q1 2023 | | 275 | | | 16 | |
| DX3 phase I | | Dubai | | Q2 2023 | | 900 | | | 61 | |
| ML5 phase III | | Milan | | Q2 2023 | | 500 | | | 12 | |
| SO2 phase II | | Sofia | | Q2 2023 | | 350 | | | 12 | |
| BX1 phases II, III, & IV | | Bordeaux | | Q4 2023 | | 800 | | | 64 | |
| FR13 phase I | | Frankfurt | | Q4 2023 | | 1,125 | | | 104 | |
| Lagos2 phase II | | Lagos | | Q4 2023 | | 150 | | | 9 | |
| BA2 phase I | | Barcelona | | Q1 2024 | | 650 | | | 56 | |
| JN1 phase I | | Johannesburg | | Q2 2024 | | 700 | | | 21 | |
| MU4 phase II | | Munich | | Q2 2024 | | 750 | | | 22 | |
| PA10 phase II | | Paris | | Q2 2024 | | 700 | | | 32 | |
| IL4 phase I | | Istanbul | | Q3 2024 | | 1,125 | | | 64 | |
| | | | | | 9,825 | | | 557 | |
| Asia-Pacific: | | | | | | | | |
| SY6 phase II | | Sydney | | Q1 2023 | | 500 | | | 43 | |
| SG5 phases V & VI | | Singapore | | Q2 2023 | | 1,500 | | | 61 | |
| TY11 phase IV | | Tokyo | | Q4 2023 | | 675 | | | 55 | |
| JH1 phase I | | Johor | | Q1 2024 | | 500 | | | 39 | |
| OS3 phase III | | Osaka | | Q2 2024 | | 600 | | | 20 | |
| SL4 phase I | | Seoul | | Q2 2024 | | 475 | | | 6 | |
| SY5 phase III | | Sydney | | Q2 2024 | | 2,675 | | | 121 | |
| CN1 phase I | | Chennai | | Q2 2024 | | 850 | | | 65 | |
| TY15 phase I | | Tokyo | | Q3 2024 | | 1,200 | | | 115 | |
| JK1 phase I | | Jakarta | | Q4 2024 | | 575 | | | 32 | |
| MB3 phase I | | Mumbai | | Q4 2024 | | 1,375 | | | 86 | |
| | | | | | 10,925 | | | 643 | |
| Total | | | | | | 34,950 | | | $ | 2,174 | |
(1)Capital expenditures are approximate and may change based on final construction details.
ITEM 3. Legal Proceedings
None.
ITEM 4. Mine Safety Disclosure
Not applicable.
PART II
ITEM 5. Market for Registrant's Common Equity, Related Stockholder Matters and Issuer Purchases of Equity Securities
Our common stock is quoted on the NASDAQ Global Select Market under the symbol of "EQIX." Our common stock began trading in August 2000. As of January 31, 2022, we had 92,666,516 shares of our common stock outstanding held by approximately 349 registered holders. During the years ended December 31, 2022 and 2021, we did not issue or sell any securities on an unregistered basis.
Stock Performance Graph
The graph set forth below compares the cumulative total stockholder return on Equinix's common stock between December 31, 2017 and December 31, 2022 with the cumulative total return of:
•the S&P 500 Index;
•the NASDAQ Composite Index; and
•the FTSE NAREIT All REITs Index.
The graph assumes the investment of $100.00 on December 31, 2017 in Equinix's common stock and in each index, and assumes the reinvestment of dividends, if any.
Equinix cautions that the stock price performance shown in the graph below is not indicative of, nor intended to forecast, the potential future performance of Equinix's common stock.
Notwithstanding anything to the contrary set forth in any of Equinix's previous or future filings under the Securities Act of 1933, as amended, or the Securities Exchange Act of 1934, as amended, that might incorporate this Annual Report on Form 10-K or future filings made by Equinix under those statutes, the stock performance graph shall not be deemed filed with the Securities and Exchange Commission and shall not be deemed incorporated by reference into any of those prior filings or into any future filings made by Equinix under those statutes.
COMPARISON OF 5 YEAR CUMULATIVE TOTAL RETURN*
*$100 invested on 12/31/17 in stock or index, including reinvestment of dividends.
Fiscal year ending December 31.
ITEM 6. [Reserved]
ITEM 7. Management's Discussion and Analysis of Financial Condition and Results of Operations
The following commentary should be read in conjunction with the financial statements and related notes contained elsewhere in this Annual Report on Form 10-K. The information in this discussion contains forward-looking statements within the meaning of Section 27A of the Securities Act of 1933, as amended, and Section 21E of the Securities Exchange Act of 1934, as amended. Such statements are based upon current expectations that involve risks and uncertainties. Any statements contained herein that are not statements of historical fact may be deemed to be forward-looking statements. For example, the words "believes," "anticipates," "plans," "expects," "intends" and similar expressions are intended to identify forward-looking statements. Our actual results and the timing of certain events may differ significantly from the results discussed in the forward-looking statements. Factors that might cause such a discrepancy include, but are not limited to, those discussed in "Liquidity and Capital Resources" and "Risk Factors" elsewhere in this Annual Report on Form 10-K. All forward-looking statements in this document are based on information available to us as of the date hereof and we assume no obligation to update any such forward-looking statements.
Item 7 of this Form 10-K focuses on discussion of 2022 and 2021 items as well as 2022 results as compared to 2021 results. For the discussion of 2020 items and 2021 results as compared to 2020 results, please refer to Item 7 of our 2021 Form 10-K as filed with the SEC on February 18, 2022.
Our management's discussion and analysis of financial condition and results of operations is intended to assist readers in understanding our financial information from our management's perspective and is presented as follows:
•Overview
•Results of Operations
•Non-GAAP Financial Measures
•Liquidity and Capital Resources
•Critical Accounting Policies and Estimates
•Recent Accounting Pronouncements
Overview
We provide a global, vendor-neutral data center, interconnection and edge solutions platform with offerings that aim to enable our customers to reach everywhere, interconnect everyone and integrate everything. Global enterprises, service providers and business ecosystems of industry partners rely on our IBX data centers and expertise around the world for the safe housing of their critical IT equipment and to protect and connect the world's most valued information assets. They also look to Platform Equinix® for the ability to directly and securely interconnect to the networks, clouds and content that enable today's information-driven global digital economy. Our
recent IBX data center openings and acquisitions, as well as xScaleTM data center investments, have expanded our total global footprint to 248 data centers, including 11 xScale data centers and the MC1 data center that are held in unconsolidated joint ventures, across 71 markets around the world. We offer the following solutions:
•premium data center colocation;
•interconnection and data exchange solutions;
•edge solutions for deploying networking, security and hardware; and
•remote expert support and professional services.
Our interconnected data centers around the world allow our customers to increase information and application delivery performance to users, and quickly access distributed IT infrastructures and business and digital ecosystems, while significantly reducing costs. Our global platform and the quality of our IBX data centers, interconnection offerings and edge solutions have enabled us to establish a critical mass of customers. As more customers choose Platform Equinix for bandwidth cost and performance reasons, it benefits their suppliers and business partners to colocate in the same data centers. This adjacency creates a “network effect” that enables our customers to capture the full economic and performance benefits of our offerings. These partners, in turn, pull in their business partners, creating a "marketplace" for their services. Our global platform enables scalable, reliable and cost-effective interconnection that increases data traffic exchange while lowering overall cost and increasing flexibility. Our focused business model is built on our critical mass of enterprise and service provider customers and the resulting "marketplace" effect. This global platform, combined with our strong financial position, has continued to drive new customer growth and bookings.
Historically, our market was served by large telecommunications carriers who bundled their products and services with their colocation offerings. The data center market landscape has evolved to include private and vendor-neutral multi-tenant data center ("MTDC") providers, hyperscale cloud providers, managed infrastructure and application hosting providers, and systems integrators. It is estimated that Equinix is one of more than 2,200 companies that provide MTDC offerings around the world. Each of these data center solutions providers can bundle various colocation, interconnection and network offerings and outsourced IT infrastructure solutions. We are able to offer our customers a global platform that reaches 32 countries with the industry’s largest and most active ecosystem of partners in our sites, proven operational reliability, improved application performance and a highly scalable set of offerings.
Our cabinet utilization rate represents the percentage of cabinet space billed versus total cabinet capacity, which is used to measure how efficiently we are managing our cabinet capacity. Our cabinet utilization rate varies from market to market among our IBX data centers across our Americas, EMEA and Asia-Pacific regions. Our cabinet utilization rates were approximately 82% and 79%, as of December 31, 2022 and 2021, respectively. We continue to monitor the available capacity in each of our selected markets. To the extent we have limited capacity available in a given market, it may limit our ability for growth in that market. We perform demand studies on an ongoing basis to determine if future expansion is warranted in a market. In addition, power and cooling requirements for most customers are growing on a per unit basis. As a result, customers are consuming an increasing amount of power per cabinet. Although we generally do not control the amount of power our customers draw from installed circuits, we have negotiated power consumption limitations with certain high power-demand customers. This increased power consumption has driven us to build out our new IBX data centers to support power and cooling needs twice that of previous IBX data centers. We could face power limitations in our IBX data centers, even though we may have additional physical cabinet capacity available within a specific IBX data center. This could have a negative impact on our ability to grow revenues, affecting our financial performance, results of operations and cash flows.
To serve the needs of the growing hyperscale data center market, including the world's largest cloud service providers, we have entered into joint ventures to develop and operate xScale data centers. In the past two years, we have closed multiple joint ventures in the form of limited liability partnerships with GIC Private Limited, Singapore's sovereign wealth fund ("GIC") and an additional joint venture in the form of a limited liability partnership with PGIM Real Estate ("PGIM").
Strategically, we will continue to look at attractive opportunities to grow our market share and selectively improve our footprint and offerings. As was the case with our recent expansions and acquisitions, our expansion criteria will be dependent on a number of factors, including but not limited to demand from new and existing customers, quality of the design, power capacity, access to networks, clouds and software partners, capacity availability in the current market location, amount of incremental investment required by us in the targeted property, automation capabilities, developer talent pool, lead-time to break even on a free cash flow basis and in-place customers. Like our recent expansions and acquisitions, the right combination of these factors may be attractive to us. Depending on the circumstances, these transactions may require additional capital expenditures funded by upfront cash payments or through long-term financing arrangements in order to bring these properties up to our standards. Property expansion may be in the form of purchases of real property, long-term leasing arrangements or acquisitions. Future purchases, construction or acquisitions may be completed by us or with partners or potential customers to minimize the outlay of cash, which can be significant.
Revenue:
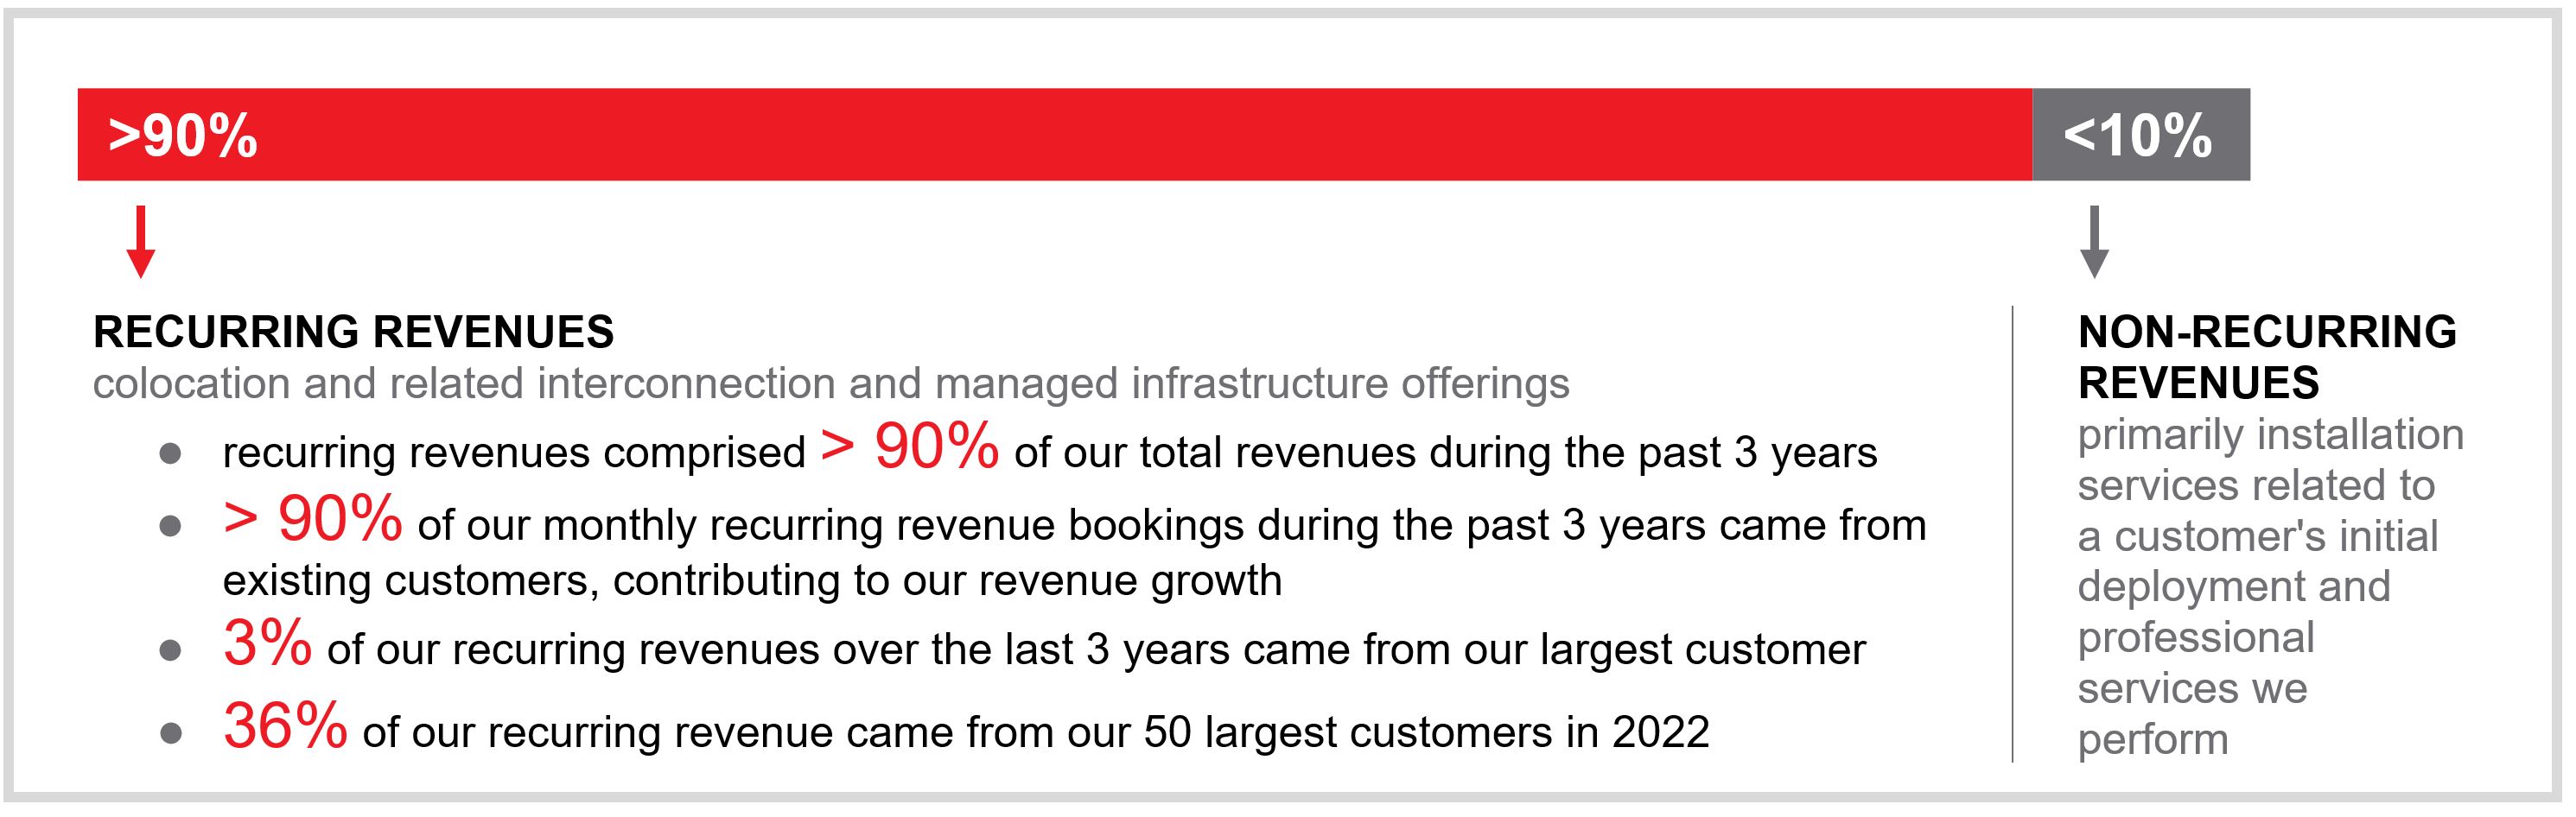
Our business is based on a recurring revenue model comprised of colocation and related interconnection and managed infrastructure offerings. We consider these offerings recurring because our customers are generally billed on a fixed and recurring basis each month for the duration of their contract, which is generally one to three years in length, and thereafter automatically renews in one-year increments. Our recurring revenues have comprised more than 90% of our total revenues during the past three years. In addition, during the past three years, more than 90% of our monthly recurring revenue bookings came from existing customers, contributing to our revenue growth. Our largest customer accounted for approximately 3% of our recurring revenues for the years ended December 31, 2022, 2021 and 2020. Our 50 largest customers accounted for approximately 36% of our recurring revenues for the year ended December 31, 2022 and 39% of our recurring revenues for the years ended 2021 and 2020.
Our non-recurring revenues are primarily derived from fees charged from installations related to a customer's initial deployment and professional services we perform. These services are considered to be non-recurring because they are billed typically once, upon completion of the installation or the professional services work performed. The majority of these non-recurring revenues are typically billed on the first invoice distributed to the customer in connection with their initial installation. However, revenues from installations are deferred and recognized ratably over the period of the contract term. Additionally, revenue from contract settlements, when a customer wishes to terminate their contract early, is generally treated as a contract modification and recognized ratably over the remaining term of the contract, if any. As a percentage of total revenues, we expect non-recurring revenues to represent less than 10% of total revenues for the foreseeable future.
Operating Expenses:
Cost of Revenues. The largest components of our cost of revenues are depreciation, rental payments related to our leased IBX data centers, utility costs, including electricity, bandwidth access, IBX data center employees' salaries and benefits, including stock-based compensation, repairs and maintenance, supplies and equipment, and security. A majority of our cost of revenues is fixed in nature and should not vary significantly from period to period, unless we expand our existing IBX data centers or open or acquire new IBX data centers. However, there are certain costs that are considered more variable in nature, including utilities and supplies that are directly related to growth in our existing and new customer base. In addition, the cost of electricity is generally higher in the summer months, as compared to other times of the year. Our costs of electricity may also increase as a result of the physical
effects of climate change, global energy supply constraints, increased regulations driving alternative electricity generation due to environmental considerations or as a result of our election to use renewable energy sources. To the extent we incur increased utility costs, such increased costs could materially impact our financial condition, results of operations and cash flows.
Sales and Marketing. Our sales and marketing expenses consist primarily of compensation and related costs for sales and marketing personnel, including stock-based compensation, amortization of contract costs, marketing programs, public relations, promotional materials and travel, as well as bad debt expense and amortization of customer relationship intangible assets.
General and Administrative. Our general and administrative expenses consist primarily of salaries and related expenses, including stock-based compensation, accounting, legal and other professional service fees; and other general corporate expenses, such as our corporate regional headquarters office leases and some depreciation expense on back office systems.
Taxation as a REIT
We elected to be taxed as a real estate investment trust for U.S. federal income tax purposes ("REIT") beginning with our 2015 taxable year. As of December 31, 2022, our REIT structure included all of our data center operations in the U.S., Canada, Mexico, Chile, Japan, Singapore and the majority of our data centers in EMEA. Our data center operations in other jurisdictions are operated as taxable REIT subsidiaries ("TRSs"). We included our share of the assets in xScale joint ventures (with the exception of Korea) in our REIT structure.
As a REIT, we generally are permitted to deduct from our U.S. federal taxable income the dividends we pay to our stockholders. The income represented by such dividends is not subject to U.S. federal income taxes at the entity level but is taxed, if at all, at the stockholder level. Nevertheless, the income of our TRSs which hold our U.S. operations that may not be REIT compliant is subject to U.S. federal and state corporate income taxes, as applicable. Likewise, our foreign subsidiaries continue to be subject to local income taxes in jurisdictions in which they hold assets or conduct operations, regardless of whether held or conducted through TRSs or through qualified REIT subsidiaries ("QRSs"). We are also subject to a separate U.S. federal corporate income tax on any gain recognized from a sale of a REIT asset where our basis in the asset is determined by reference to the basis of the asset in the hands of a C corporation (such as an asset held by us or a QRS following the liquidation or other conversion of a former TRS). This built-in-gains tax is generally applicable to any disposition of such an asset during the five-year period after the date we first owned the asset as a REIT asset to the extent of the built-in-gain based on the fair market value of such asset on the date we first held the asset as a REIT asset. In addition, should we recognize any net gain from "prohibited transactions," we will be subject to tax on this net gain at a 100% rate. "Prohibited transactions," for this purpose, are defined as dispositions, at a gain, of inventory or property held primarily for sale to customers in the ordinary course of a trade or business other than dispositions of foreclosure property and other than dispositions excepted by statutory safe harbors. If we fail to remain qualified for U.S. federal income taxation as a REIT, we will be subject to U.S. federal income taxes at regular corporate income tax rates. Even if we remain qualified for U.S. federal income taxation as a REIT, we may be subject to some federal, state, local and foreign taxes on our income and property in addition to taxes owed with respect to our TRSs' operations. In particular, while state income tax regimes often parallel the U.S. federal income tax regime for REITs, many states do not completely follow federal rules, and some may not follow them at all.
We continue to monitor our REIT compliance in order to maintain our qualification for U.S. federal income taxation as a REIT. For this and other reasons, as necessary, we may convert some of our data center operations in other countries into the REIT structure in future periods.
On each of March 23, June 15, September 21, and December 14, 2022 we paid a quarterly cash dividend of $3.10 per share. We expect the amount of all our applicable quarterly dividend distributions and other applicable distributions to equal or exceed our REIT taxable income that we recognized in 2022.
The Impact of the Ongoing COVID-19 Pandemic on Our Results and Operations
We have continued to closely monitor the impact of the COVID-19 pandemic on our people and business. As of the time of this filing, our offices are open to employees and we have also resumed in-person events as local travel restrictions allow.
For additional details regarding the impacts and risks to our results of operations from the ongoing COVID-19 pandemic, refer to "Results of Operations" section below and Part I, Item 1A. Risk Factors included elsewhere in this Annual Report on Form 10-K.
2022 Highlights:
•In February, we entered into an equity forward amendment to our existing "at the market" equity offering program (the "2020 ATM Program"), under which we could, from time to time, offer and sell shares under the equity distribution agreement pursuant to forward sale transactions (the "Equity Forward Amendment"). See Note 12 within the Consolidated Financial Statements.
•In March, we entered into a joint venture in the form of a limited liability partnership with PGIM to develop and operate additional xScale data centers in Asia-Pacific (the "Asia-Pacific 2 Joint Venture"). See Note 5 within the Consolidated Financial Statements.
•In March, we entered into an agreement to sell the Mexico 3 ("MX3") data center site in connection with the formation of a new joint venture with GIC, to develop and operate xScale data centers in the Americas (the "AMER 1 Joint Venture"). See Note 5 within the Consolidated Financial Statements.
•In April, we completed the acquisition of MainOne Cable Company Ltd. ("MainOne"), consisting of four data centers as well as a subsea cable and terrestrial fiber network. We acquired MainOne and its assets for a total purchase consideration of $278.4 million. See Note 3 within the Consolidated Financial Statements.
•In April, we issued $1.2 billion aggregate principal amount of 3.900% Senior Notes due 2032 (the "2032 Notes"). See Note 11 within the Consolidated Financial Statements.
•In April, we entered into a joint venture in the form of a limited liability partnership with GIC, to develop and operate two xScale data centers in Seoul, Korea (the "Asia-Pacific 3 Joint Venture"). Upon closing, we contributed $17.0 million in exchange for a 20% partnership interest in the joint venture. See Note 6 within the Consolidated Financial Statements.
•In May, we completed the acquisition of four data centers in Chile from Empresa Nacional De Telecomunicaciones S.A. ("Entel") for a total purchase consideration of $638.3 million at the exchange rate in effect on May 2, 2022. See Note 3 within the Consolidated Financial Statements.
•In August, we completed the acquisition of a data center in Peru from Entel for a purchase consideration of $80.3 million at the exchange rate in effect on August 1, 2022. See Note 3 within the Consolidated Financial Statements.
•In August, we settled all five forward sale agreements under the Equity Forward Amendment and sold 579,873 shares of our common stock for approximately $393.6 million, net of payment of commissions to sales agents and other offering expenses, at an aggregate weighted-average forward sale price of $678.72 per share. See Note 12 within the Consolidated Financial Statements.
•In August, we sold an additional 580,833 shares, excluding the forward sale transactions noted above, under the 2020 ATM Program for approximately $403.6 million in proceeds, net of payment of commissions to sales agents and other offering expenses. See Note 12 within the Consolidated Financial Statements.
•In November, we established a successor ATM program (the "2022 ATM Program"), under which we may, from time to time, offer and sell on a spot or forward basis up to an aggregate of $1.5 billion of our common stock to or through sales agents in "at the market" transactions. See Note 12 within the Consolidated Financial Statements.
Results of Operations
Our results of operations for the year ended December 31, 2022 include the results of operations from a data center in Peru acquired from Entel from August 1, 2022, four data centers in Chile acquired from Entel from May 2, 2022, the acquisition of MainOne from April 1, 2022 and two data centers acquired from GPX India from September 1, 2021. See Note 3 within the Consolidated Financial Statements for further details.
In order to provide a framework for assessing our performance excluding the impact of foreign currency fluctuations, we supplement the year-over-year actual change in results of operations with comparative changes on a constant currency basis. Presenting constant currency results of operations is a non-GAAP financial measure. See “Non-GAAP Financial Measures” below for further discussion.
Years ended December 31, 2022 and 2021
Revenues. Our revenues for the years ended December 31, 2022 and 2021 were generated from the following revenue classifications and geographic regions (dollars in thousands):
| | | | | | | | | | | | | | | | | | | | | | | | | | | | | | | | | | | | | | | | | |
| Years Ended December 31, | | $ Change | | % Change |
| 2022 | | % | | 2021 | | % | | Actual | | Actual | | Constant Currency |
| Americas: | | | | | | | | | | | | | |
| Recurring revenues | $ | 3,183,191 | | | 44% | | $ | 2,861,937 | | | 43% | | $ | 321,254 | | | 11% | | 11% |
| Non-recurring revenues | 166,026 | | | 2% | | 159,814 | | | 3% | | 6,212 | | | 4% | | 4% |
| 3,349,217 | | | 46% | | 3,021,751 | | | 46% | | 327,466 | | | 11% | | 11% |
| EMEA: | | | | | | | | | | | | | |
| Recurring revenues | 2,207,329 | | | 30% | | 2,001,931 | | | 30% | | 205,398 | | | 10% | | 13% |
| Non-recurring revenues | 135,875 | | | 2% | | 153,285 | | | 2% | | (17,410) | | | (11)% | | (1)% |
| 2,343,204 | | | 32% | | 2,155,216 | | | 32% | | 187,988 | | | 9% | | 12% |
| Asia-Pacific: | | | | | | | | | | | | | |
| Recurring revenues | 1,480,767 | | | 21% | | 1,356,617 | | | 21% | | 124,150 | | | 9% | | 18% |
| Non-recurring revenues | 89,917 | | | 1% | | 101,953 | | | 1% | | (12,036) | | | (12)% | | (3)% |
| 1,570,684 | | | 22% | | 1,458,570 | | | 22% | | 112,114 | | | 8% | | 16% |
| Total: | | | | | | | | | | | | | |
| Recurring revenues | 6,871,287 | | | 95% | | 6,220,485 | | | 94% | | 650,802 | | | 10% | | 13% |
| Non-recurring revenues | 391,818 | | | 5% | | 415,052 | | | 6% | | (23,234) | | | (6)% | | 1% |
| $ | 7,263,105 | | | 100% | | $ | 6,635,537 | | | 100% | | $ | 627,568 | | | 9% | | 12% |
Revenues
(dollars in thousands)
Americas Revenues. During the year ended December 31, 2022, Americas revenue increased by $327.5 million or 11% (and also 11% on a constant currency basis). Growth in Americas revenues was primarily due to:
•approximately $30.3 million of incremental revenues generated from the Entel Chile and Entel Peru acquisitions;
•$44.6 million of incremental revenues generated from our IBX data center expansions; and
•an increase in orders from both our existing customers and new customers during the period.
EMEA Revenues. During the year ended December 31, 2022, EMEA revenue increased by $188.0 million or 9% (12% on a constant currency basis). Growth in EMEA revenues was primarily due to:
•$59.6 million of incremental revenues generated from the MainOne acquisition;
•approximately $32.0 million of incremental revenues generated from our IBX data center expansions;
•$9.3 million of incremental revenues from services provided to our joint ventures; and
•an increase in orders from both our existing customers and new customers during the period.
Asia-Pacific Revenues. During the year ended December 31, 2022, Asia-Pacific revenue increased by $112.1 million or 8% (16% on a constant currency basis). Growth in Asia-Pacific revenues was primarily due to:
•approximately $60.2 million of incremental revenues generated from our IBX data center expansions;
•$14.3 million incremental revenues generated from the GPX India acquisition; and
•incremental revenues generated from power price increases in Singapore in response to the increased cost of utilities as noted below.
Cost of Revenues. Our cost of revenues for the years ended December 31, 2022 and 2021 were split among the following geographic regions (dollars in thousands):
| | | | | | | | | | | | | | | | | | | | | | | | | | | | | | | | | | | | | | | | | |
| Years Ended December 31, | | $ Change | | % Change |
| 2022 | | % | | 2021 | | % | | Actual | | Actual | | Constant Currency |
| Americas | $ | 1,560,799 | | | 42% | | $ | 1,458,699 | | | 42% | | $ | 102,100 | | | 7% | | 7% |
| EMEA | 1,281,023 | | | 34% | | 1,216,990 | | | 35% | | 64,033 | | | 5% | | 11% |
| Asia-Pacific | 909,679 | | | 24% | | 796,733 | | | 23% | | 112,946 | | | 14% | | 24% |
| Total | $ | 3,751,501 | | | 100% | | $ | 3,472,422 | | | 100% | | $ | 279,079 | | | 8% | | 12% |
Cost of Revenues
(dollars in thousands; percentages indicate expenses as a percentage of revenues)
Americas Cost of Revenues. During the year ended December 31, 2022, Americas cost of revenues increased by $102.1 million or 7% (and also 7% on a constant currency basis). The increase in our Americas cost of revenues was primarily due to:
•$48.5 million of higher utilities, primarily driven by comparatively lower costs in 2021 resulting from gains recognized from wind farm settlements in Texas and Oklahoma due to extreme weather conditions, current period increases in power costs, higher utility usage and IBX data center expansions;
•$20.1 million of higher compensation costs, including salaries, bonuses and stock-based compensation, primarily due to headcount growth;
•$15.2 million of incremental cost of revenues from the Entel Chile and Entel Peru acquisitions; and
•$10.9 million of higher depreciation expense driven by IBX data center expansions.
EMEA Cost of Revenues. During the year ended December 31, 2022, EMEA cost of revenues increased by $64.0 million or 5% (11% on a constant currency basis). The increase in our EMEA cost of revenues was primarily due to:
•$35.4 million of incremental cost of revenues from the MainOne Acquisition; and
•after accounting for changes in foreign currency rates and hedge loss allocations:
◦approximately $13 million in utilities costs, primarily driven by increases in power costs and higher utility usage in France and the United Kingdom;
◦approximately $11 million in depreciation expense driven by IBX data center expansions; and
◦approximately $7 million in compensation costs, including salaries, bonuses and stock-based compensation, primarily due to headcount growth.
Asia-Pacific Cost of Revenues. During the year ended December 31, 2022, Asia-Pacific cost of revenues increased by $112.9 million or 14% (24% on a constant currency basis). The increase in our Asia-Pacific cost of revenues was primarily due to:
•$99.5 million of higher utilities primarily driven by increases in power cost and higher utility usage in Singapore;
•$11.4 million of incremental cost of revenues from the GPX India acquisition;
•$10.3 million of higher rent and facilities costs, primarily in Hong Kong; and
•$8.1 million of higher depreciation expense driven by IBX data center expansions in Singapore.
This increase was partially offset by $13.6 million of lower other cost of revenue, primarily due to decreased customer installations.
We expect Americas, EMEA and Asia-Pacific cost of revenues to increase in line with the growth of our business, including from the impacts of acquisitions.
Sales and Marketing Expenses. Our sales and marketing expenses for the years ended December 31, 2022 and 2021 were split among the following geographic regions (dollars in thousands):
| | | | | | | | | | | | | | | | | | | | | | | | | | | | | | | | | | | | | | | | | |
| Years ended December 31, | | $ Change | | % Change |
| 2022 | | % | | 2021 | | % | | Actual | | Actual | | Constant Currency |
| Americas | $ | 501,943 | | | 64% | | $ | 470,985 | | | 64% | | $ | 30,958 | | | 7% | | 7% |
| EMEA | 183,754 | | | 23% | | 172,930 | | | 23% | | 10,824 | | | 6% | | 11% |
| Asia-Pacific | 100,863 | | | 13% | | 97,317 | | | 13% | | 3,546 | | | 4% | | 11% |
| Total | $ | 786,560 | | | 100% | | $ | 741,232 | | | 100% | | $ | 45,328 | | | 6% | | 8% |
Sales and Marketing Expenses
(dollars in thousands; percentages indicate expenses as a percentage of revenues)
Americas Sales and Marketing Expenses. During the year ended December 31, 2022, Americas sales and marketing expenses increased by $31.0 million or 7% (and also 7% on a constant currency basis). The increase in our Americas sales and marketing expenses was primarily due to:
•$18.0 million of higher compensation costs, including sales compensation, salaries and stock-based compensation, partially due to additional compensation expenses incurred related to our recent acquisitions and headcount growth; and
•$8.0 million of higher travel and entertainment expenses due to the easing of COVID-19 travel restrictions.
EMEA Sales and Marketing Expenses. During the year ended December 31, 2022, EMEA sales and marketing increased by $10.8 million or 6% (11% on a constant currency basis). The increase in our EMEA sales and marketing expenses was primarily due to higher compensation costs, including sales compensation, salaries and stock-based compensation, partially due to additional compensation expenses incurred related to our recent acquisitions and headcount growth.
Asia-Pacific Sales and Marketing Expenses. Our Asia-Pacific sales and marketing expense did not materially change during the year ended December 31, 2022 as compared to the year ended December 31, 2021.
We anticipate that we will continue to invest in sales and marketing initiatives across our three regions in line with the growth of our business. We expect our Americas sales and marketing expenses as a percentage of revenues to be higher than those of our other regions since certain global sales and marketing functions are located within the U.S.
General and Administrative Expenses. Our general and administrative expenses for the years ended December 31, 2022 and 2021 were split among the following geographic regions (dollars in thousands):
| | | | | | | | | | | | | | | | | | | | | | | | | | | | | | | | | | | | | | | | | |
| Years Ended December 31, | | $ Change | | % Change |
| 2022 | | % | | 2021 | | % | | Actual | | Actual | | Constant Currency |
| Americas | $ | 980,589 | | | 66% | | $ | 902,037 | | | 69% | | $ | 78,552 | | | 9% | | 9% |
| EMEA | 301,317 | | | 20% | | 248,295 | | | 19% | | 53,022 | | | 21% | | 27% |
| Asia-Pacific | 216,795 | | | 14% | | 151,465 | | | 12% | | 65,330 | | | 43% | | 51% |
| Total | $ | 1,498,701 | | | 100% | | $ | 1,301,797 | | | 100% | | $ | 196,904 | | | 15% | | 17% |
General and Administrative Expenses
(dollars in thousands; percentages indicate expenses as a percentage of revenues)
Americas General and Administrative Expenses. During the year ended December 31, 2022, Americas general and administrative expenses increased by $78.6 million or 9% (and also 9% on a constant currency basis). The increase in our Americas general and administrative expenses was primarily due to:
•$46.8 million of higher depreciation expense associated with back-office systems to support the growth of our business;
•$40.7 million of higher compensation costs, including salaries, bonuses, and stock-based compensation, primarily due to additional compensation expenses incurred related to our recent acquisitions and headcount growth;
•$24.0 million of higher office expenses primarily due to additional software and support services; and
•$10.4 million of higher travel and entertainment expenses due to the easing of COVID-19 travel restrictions.
This increase was partially offset by $40.9 million of lower consulting costs driven by an increase in the conversion of contingent workers to full time employees.
EMEA General and Administrative Expenses. During the year ended December 31, 2022, EMEA general and administrative expenses increased by $53.0 million or 21% (27% on a constant currency basis). The increase in our EMEA general and administrative expenses was primarily due to:
•$34.0 million of higher compensation costs, including salaries, bonuses, and stock-based compensation, primarily due to headcount growth; and
•$10.0 million higher travel and entertainment expenses due to the easing of COVID-19 travel restrictions.
Asia-Pacific General and Administrative Expenses. During the year ended December 31, 2022, Asia-Pacific general and administrative expenses increased by $65.3 million or 43% (51% on a constant currency basis). The increase in our Asia-Pacific general and administrative expense was primarily due to:
•$39.5 million of higher compensation costs, including salaries, bonuses, and stock-based compensation, primarily due to headcount growth; and
•$28.5 million of higher consulting costs in support of our business growth and location strategy.
Going forward, although we are carefully monitoring our spending, we expect our general and administrative expenses to increase across all three regions as we continue to invest in our operations to support our growth, including investments to enhance our technology platform, and to integrate recent acquisitions. Additionally, given that our corporate headquarters is located in the U.S., we expect the Americas general and administrative expenses as a percentage of revenues to be higher than that of other regions.
Transaction Costs. During the year ended December 31, 2022, we recorded transaction costs totaling $21.8 million, primarily related to costs incurred in connection with the recent acquisitions and formation of the new joint ventures, see Notes 3, 5, and 6 within the Consolidated Financial Statements. During the year ended December 31, 2021, we recorded transaction costs totaling $22.8 million, primarily related to costs incurred in connection with the formation of the new joint ventures and the GPX India Acquisition.
Gain or Loss on Asset Sales. During the year ended December 31, 2022, we did not record a significant amount of loss on asset sales. During the year ended December 31, 2021, we recorded a gain of $10.8 million primarily related to the sale of the Dublin 5 ("DB5") data center.
Income from Operations. Our income from operations for the years ended December 31, 2022 and 2021 was split among the following geographic regions (dollars in thousands):
| | | | | | | | | | | | | | | | | | | | | | | | | | | | | | | | | | | | | | | | | |
| Years Ended December 31, | | $ Change | | % Change |
| 2022 | | % | | 2021 | | % | | Actual | | Actual | | Constant Currency |
| Americas | $ | 283,975 | | | 24% | | $ | 165,380 | | | 15% | | $ | 118,595 | | | 72% | | 71% |
| EMEA | 575,331 | | | 48% | | 530,888 | | | 48% | | 44,443 | | | 8% | | 3% |
| Asia-Pacific | 341,222 | | | 28% | | 411,894 | | | 37% | | (70,672) | | | (17)% | | (10)% |
| Total | $ | 1,200,528 | | | 100% | | $ | 1,108,162 | | | 100% | | $ | 92,366 | | | 8% | | 8% |
Americas Income from Operations. During the year ended December 31, 2022, Americas income from operations increased by $118.6 million or 72% (71% on a constant currency basis), primarily due to higher revenues as a result of our IBX data center expansion activity, the recent acquisitions and organic growth, as described above.
EMEA Income from Operations. During the year ended December 31, 2022, EMEA income from operations increased by $44.4 million or 8% (3% on a constant currency basis), primarily due to higher revenues as a result of our IBX data center expansion activity, the recent acquisition and organic growth, as described above.
Asia-Pacific Income from Operations. During the year ended December 31, 2022, Asia-Pacific income from operations decreased by $70.7 million or 17% (10% on a constant currency basis), primarily due to higher operating
expenses as a percentage of revenues, which included higher utility costs, primarily driven by increases in power prices and higher utility usage, as described above.
Interest Income. Interest income was $36.3 million for the year ended December 31, 2022 and was not significant for the year ended December 31, 2021. The average yield for the year ended December 31, 2022 was 1.74% versus 0.17% for the year ended December 31, 2021.
Interest Expense. Interest expense increased to $356.3 million for the year ended December 31, 2022 from $336.1 million for the year ended December 31, 2021, primarily due to the issuance of the 3.900% Senior Notes due 2032. During the years ended December 31, 2022 and 2021, we capitalized $18.2 million and $24.5 million, respectively, of interest expense to construction in progress. See Note 11 within the Consolidated Financial Statements.
Other Expense. We recorded net other expense of $51.4 million for the year ended December 31, 2022, including $49.0 million in stock-based charitable contributions and foreign currency exchange gains and losses. For the year ended December 31, 2021, we recorded net other expense of $50.6 million, primarily due to an approximately $32.0 million impairment charge resulting from the settlement of a pre-acquisition uncertain tax position, refer to the "Income Taxes" section below for further information, as well as foreign currency exchange gains and losses.
Gain or Loss on Debt Extinguishment. We did not record a significant amount of gain on debt extinguishment during the year ended December 31, 2022. During the year ended December 31, 2021, we recorded $115.1 million of net loss on debt extinguishment primarily due to the redemption of 2.875% Euro Senior Notes due 2026 and the 5.375% Senior Notes due 2027.
Income Taxes. We operate as a REIT for U.S. federal income tax purposes. As a REIT, we are generally not subject to U.S. federal income taxes on our taxable income distributed to stockholders. We intend to distribute or have distributed the entire taxable income generated by the operations of our REIT and QRSs for the tax years ended December 31, 2022 and 2021, respectively. As such, other than state income taxes and foreign income and withholding taxes, no provision for income taxes has been included for our REIT and QRSs in the accompanying consolidated financial statements for the years ended December 31, 2022 and 2021.
We have made TRS elections for some of our subsidiaries in and outside the U.S. In general, a TRS may provide services that would otherwise be considered impermissible for REITs to provide and may hold assets that may not be REIT compliant.
U.S. income taxes for the TRS entities located in the U.S. and foreign income taxes for our foreign operations regardless of whether the foreign operations are operated as QRSs or TRSs have been accrued, as necessary, for the years ended December 31, 2022 and 2021.
For the years ended December 31, 2022 and 2021, we recorded $124.8 million and $109.2 million of income tax expenses, respectively. Our effective tax rates were 15.0% and 17.9%, respectively, for the years ended December 31, 2022 and 2021. The lower effective tax rate in 2022 as compared to 2021 is primarily driven by the higher U.S. QRS income that is not subject to U.S. corporate income taxes, partially offset by an increase in valuation allowances in the Americas region.
In the current period, we had a favorable resolution of uncertain tax positions of approximately $40.0 million resulting from the settlement of tax audits in the EMEA region. In the prior period, we had a favorable resolution of uncertain tax positions of approximately $70.0 million resulting from the settlement of various tax audits in the EMEA and Asia-Pacific regions. Of the unrecognized tax benefits realized in the prior period, approximately $32.0 million was related to the uncertain tax position inherited from the acquisition of Metronode in 2018. The uncertain tax position was covered by an indemnification agreement with the Seller. The realization of the unrecognized tax benefits resulted in an impairment of the indemnification asset for the same amount, which was included in Other Income (Expense) on the Consolidated Statements of Operations for the year ended December 31, 2021.
Adjusted EBITDA. Adjusted EBITDA is a key factor in how we assess the operating performance of our segments and develop regional growth strategies such as IBX data center expansion decisions. We define adjusted EBITDA as net income excluding income tax expense, interest income, interest expense, other income or expense, gain or loss on debt extinguishment, depreciation, amortization, accretion, stock-based compensation expense, restructuring charges, impairment charges, transaction costs, and gain or loss on asset sales. See "Non-GAAP Financial Measures" below for more information about adjusted EBITDA and a reconciliation of adjusted EBITDA to
net income. Our adjusted EBITDA for the years ended December 31, 2022 and 2021 by geographic regions was as follows (dollars in thousands):
| | | | | | | | | | | | | | | | | | | | | | | | | | | | | | | | | | | | | | | | | |
| Years Ended December 31, | | $ Change | | % Change |
| 2022 | | % | | 2021 | | % | | Actual | | Actual | | Constant Currency |
| Americas | $ | 1,521,775 | | | 45 | % | | $ | 1,326,460 | | | 42 | % | | $ | 195,315 | | | 15 | % | | 15 | % |
| EMEA | 1,109,502 | | | 33 | % | | 1,033,333 | | | 33 | % | | 76,169 | | | 7 | % | | 10 | % |
| Asia-Pacific | 738,423 | | | 22 | % | | 784,591 | | | 25 | % | | (46,168) | | | (6) | % | | 2 | % |
| Total | $ | 3,369,700 | | | 100 | % | | $ | 3,144,384 | | | 100 | % | | $ | 225,316 | | | 7 | % | | 10 | % |
Americas Adjusted EBITDA. During the year ended December 31, 2022, Americas adjusted EBITDA increased by $195.3 million or 15% (and also 15% on a constant currency basis), primarily due to higher revenues as a result of our IBX data center expansion activity, the recent acquisitions and organic growth, as described above.
EMEA Adjusted EBITDA. During the year ended December 31, 2022, EMEA adjusted EBITDA increased by $76.2 million or 7% (10% on a constant currency basis), primarily due to higher revenues as a result of our IBX data center expansion activity, the recent acquisition and organic growth, as described above.
Asia-Pacific Adjusted EBITDA. During the year ended December 31, 2022, Asia-Pacific adjusted EBITDA decreased by $46.2 million or 6% (2% on a constant currency basis), primarily due to higher utility costs, as described above.
Non-GAAP Financial Measures
We provide all information required in accordance with GAAP, but we believe that evaluating our ongoing results of operations may be difficult if limited to reviewing only GAAP financial measures. Accordingly, we use non-GAAP financial measures to evaluate our operations.
Non-GAAP financial measures are not a substitute for financial information prepared in accordance with GAAP. Non-GAAP financial measures should not be considered in isolation, but should be considered together with the most directly comparable GAAP financial measures and the reconciliation of the non-GAAP financial measures to the most directly comparable GAAP financial measures. We have presented such non-GAAP financial measures to provide investors with an additional tool to evaluate our results of operations in a manner that focuses on what management believes to be our core, ongoing business operations. We believe that the inclusion of these non-GAAP financial measures provides consistency and comparability with past reports and provides a better understanding of the overall performance of the business and ability to perform in subsequent periods. We believe that if we did not provide such non-GAAP financial information, investors would not have all the necessary data to analyze us effectively.
Investors should note that the non-GAAP financial measures used by us may not be the same non-GAAP financial measures, and may not be calculated in the same manner, as those of other companies. Investors should therefore exercise caution when comparing non-GAAP financial measures used by us to similarly titled non-GAAP financial measures of other companies.
Our primary non-GAAP financial measures, adjusted EBITDA and adjusted funds from operations ("AFFO"), exclude depreciation expense as these charges primarily relate to the initial construction costs of our IBX data centers and do not reflect our current or future cash spending levels to support our business. Our IBX data centers are long-lived assets and have an economic life greater than 10 years. The construction costs of an IBX data center do not recur with respect to such data center, although we may incur initial construction costs in future periods with respect to additional IBX data centers, and future capital expenditures remain minor relative to our initial investment. This is a trend we expect to continue. In addition, depreciation is also based on the estimated useful lives of our IBX data centers. These estimates could vary from actual performance of the asset, are based on historical costs incurred to build out our IBX data centers and are not indicative of current or expected future capital expenditures. Therefore, we exclude depreciation from our results of operations when evaluating our operations.
In addition, in presenting adjusted EBITDA and AFFO, we exclude amortization expense related to acquired intangible assets. Amortization expense is significantly affected by the timing and magnitude of our acquisitions and these charges may vary in amount from period to period. We exclude amortization expense to facilitate a more meaningful evaluation of our current operating performance and comparisons to our prior periods. We exclude accretion expense, both as it relates to asset retirement obligations as well as accrued restructuring charge liabilities, as these expenses represent costs which we believe are not meaningful in evaluating our current operations. We also exclude restructuring charges. Restructuring charges relate to our decisions to exit leases for excess space adjacent to several of our IBX data centers, which we did not intend to build out, or our decision to reverse such restructuring charges. We also exclude impairment charges generally related to certain long-lived assets. The impairment charges are related to expense recognized whenever events or changes in circumstances indicate that the carrying amount of assets are not recoverable. We also exclude gain or loss on asset sales as it represents profit or loss that is not meaningful in evaluating the current or future operating performance. Additionally, we exclude transaction costs from AFFO and adjusted EBITDA to allow more comparable comparisons of our financial results to our historical operations. The transaction costs relate to costs we incur in connection with business combinations and the formation of joint ventures, including advisory, legal, accounting, valuation, and other professional or consulting fees. Such charges generally are not relevant to assessing our long-term performance. In addition, the frequency and amount of such charges vary significantly based on the size and timing of the transactions. Management believes items such as restructuring charges, impairment charges, gain or loss on asset sales and transaction costs are non-core transactions; however, these types of costs may occur in future periods. Finally, we exclude stock-based compensation expense, as it can vary significantly from period to period based on share price, and the timing, size and nature of equity awards. As such, we, and many investors and analysts, exclude stock-based compensation expense to compare our results of operations with those of other companies.
Adjusted EBITDA
We define adjusted EBITDA as net income excluding income tax expense, interest income, interest expense, other income or expense, gain or loss on debt extinguishment, depreciation, amortization, accretion, stock-based compensation expense, restructuring charges, impairment charges, transaction costs, and gain or loss on asset sales as presented below (in thousands):
| | | | | | | | | | | | | | | | | |
| Years Ended December 31, |
| 2022 | | 2021 | | 2020 |
| Net income | $ | 704,577 | | | $ | 499,728 | | | $ | 370,074 | |
| Income tax expense | 124,792 | | | 109,224 | | | 146,151 | |
| Interest income | (36,268) | | | (2,644) | | | (8,654) | |
| Interest expense | 356,337 | | | 336,082 | | | 406,466 | |
| Other (income) expense | 51,417 | | | 50,647 | | | (6,913) | |
| (Gain) loss on debt extinguishment | (327) | | | 115,125 | | | 145,804 | |
| Depreciation, amortization, and accretion expense | 1,739,374 | | | 1,660,524 | | | 1,427,010 | |
| Stock-based compensation expense | 403,983 | | | 363,774 | | | 311,020 | |
| Transaction costs | 21,839 | | | 22,769 | | | 55,935 | |
| Impairment charges | — | | | — | | | 7,306 | |
| (Gain) loss on asset sales | 3,976 | | | (10,845) | | | (1,301) | |
| Adjusted EBITDA | $ | 3,369,700 | | | $ | 3,144,384 | | | $ | 2,852,898 | |
Our adjusted EBITDA results have increased each year in total dollars due to the increase in our operating results, as discussed in "Results of Operations", as well as the nature of our business model consisting of a recurring revenue stream and a cost structure which has a large base that is fixed in nature, as also discussed in "Overview".
Funds from Operations ("FFO") and AFFO
We use FFO and AFFO, which are non-GAAP financial measures commonly used in the REIT industry. FFO is calculated in accordance with the standards established by the National Association of Real Estate Investment Trusts. FFO represents net income (loss), excluding gain (loss) from the disposition of real estate assets, depreciation and amortization on real estate assets and adjustments for unconsolidated joint ventures' and non-controlling interests' share of these items.
In presenting AFFO, we exclude certain items that we believe are not good indicators of our current or future operating performance. AFFO represents FFO excluding depreciation and amortization expense on non-real estate assets, accretion, stock-based compensation, stock-based charitable contributions, restructuring charges, impairment charges, transaction costs, an installation revenue adjustment, a straight-line rent expense adjustment, a contract cost adjustment, amortization of deferred financing costs and debt discounts and premiums, gain (loss) on debt extinguishment, an income tax expense adjustment, recurring capital expenditures, net income (loss) from discontinued operations, net of tax, and adjustments from FFO to AFFO for unconsolidated joint ventures' and noncontrolling interests' share of these items. The adjustments for installation revenue, straight-line rent expense and contract costs are intended to isolate the cash activity included within the straight-lined or amortized results in the consolidated statement of operations. We exclude the amortization of deferred financing costs and debt discounts and premiums as these expenses relate to the initial costs incurred in connection with debt financings that have no current or future cash obligations. We exclude gain (loss) on debt extinguishment since it generally represents the write-off of initial costs incurred in connection with debt financings or a cost that is incurred to reduce future interest costs and is not a good indicator of our current or future operating performance. We include an income tax expense adjustment, which represents the non-cash tax impact due to changes in valuation allowances, uncertain tax positions and deferred taxes that do not relate to current period's operations. We deduct recurring capital expenditures, which represent expenditures to extend the useful life of its IBX data centers or other assets that are required to support current revenues. We also exclude net income (loss) from discontinued operations, net of tax, which represents results that may not recur and are not a good indicator of our current future operating performance.
Our FFO and AFFO were as follows (in thousands):
| | | | | | | | | | | | | | | | | |
| Years Ended December 31, |
| 2022 | | 2021 | | 2020 |
| Net income | $ | 704,577 | | | $ | 499,728 | | | $ | 370,074 | |
| Net (income) loss attributable to non-controlling interests | (232) | | | 463 | | | (297) | |
| Net income attributable to Equinix | 704,345 | | | 500,191 | | | 369,777 | |
| Adjustments: | | | | | |
| Real estate depreciation | 1,104,787 | | | 1,073,148 | | | 924,064 | |
| (Gain) loss on disposition of real estate property | 7,134 | | | (6,439) | | | 4,063 | |
| Adjustments for FFO from unconsolidated joint ventures | 10,068 | | | 6,097 | | | 2,726 | |
| | | | | |
| FFO attributable to common shareholders | $ | 1,826,334 | | | $ | 1,572,997 | | | $ | 1,300,630 | |
| | | | | | | | | | | | | | | | | |
| Years Ended December 31, |
| 2022 | | 2021 | | 2020 |
| FFO attributable to common shareholders | $ | 1,826,334 | | | $ | 1,572,997 | | | $ | 1,300,630 | |
| Adjustments: | | | | | |
| Installation revenue adjustment | 17,745 | | | 27,928 | | | (125) | |
| Straight-line rent expense adjustment | 16,263 | | | 9,677 | | | 10,787 | |
| Contract cost adjustment | (52,888) | | | (63,064) | | | (35,675) | |
Amortization of deferred financing costs and debt discounts and premiums | 17,826 | | | 17,135 | | | 15,739 | |
| Stock-based compensation expense | 403,983 | | | 363,774 | | | 311,020 | |
| Stock-based charitable contributions | 49,013 | | | — | | | — | |
| Non-real estate depreciation expense | 426,666 | | | 377,658 | | | 300,258 | |
| Amortization expense | 204,755 | | | 205,484 | | | 199,047 | |
| Accretion expense adjustment | 3,166 | | | 4,234 | | | 3,641 | |
| Recurring capital expenditures | (188,885) | | | (199,089) | | | (160,637) | |
| (Gain) loss on debt extinguishment | (327) | | | 115,125 | | | 145,804 | |
| Transaction costs | 21,839 | | | 22,769 | | | 55,935 | |
Impairment charges(1) | 1,815 | | | 31,847 | | | 7,306 | |
Income tax expense (benefit) adjustment(1) | (31,165) | | | (38,505) | | | 33,220 | |
| | | | | |
| Adjustments for AFFO from unconsolidated joint ventures | (2,262) | | | 3,259 | | | 2,195 | |
| | | | | |
| AFFO attributable to common shareholders | $ | 2,713,878 | | | $ | 2,451,229 | | | $ | 2,189,145 | |
(1)Impairment charges in 2022 and 2021 relate to the impairment of an indemnification asset resulting from the settlement of a pre-acquisition uncertain tax position, which was recorded as Other Income (Expense) on the Consolidated Statements of Operations. This impairment charge was offset by the recognition of tax benefits in the same amount, which was included within the Income tax expense (benefit) adjustment line on the table above.
Our AFFO results have improved due to the improved operating results discussed earlier in "Results of Operations," as well as due to the nature of our business model which consists of a recurring revenue stream and a cost structure which has a large base that is fixed in nature as discussed earlier in "Overview."
Constant Currency Presentation
Our revenues and certain operating expenses (cost of revenues, sales and marketing and general and administrative expenses) from our international operations have represented and will continue to represent a significant portion of our total revenues and certain operating expenses. As a result, our revenues and certain operating expenses have been and will continue to be affected by changes in the U.S. dollar against major international currencies. During the year ended December 31, 2022 as compared to the same period in 2021, the U.S. dollar was stronger relative to the Australian dollar, British Pound, Euro, Japanese yen and Singapore dollar, which resulted in an unfavorable foreign currency impact on revenue, operating income and adjusted EBITDA, and a favorable foreign currency impact on operating expenses. During the year ended December 31, 2022 as compared to the same period in 2021, the U.S. dollar was weaker relative to the Brazilian real, which resulted in a favorable foreign currency impact on revenue, operating income and adjusted EBITDA, and an unfavorable foreign currency impact on operating expenses. In order to provide a framework for assessing how each of our business segments performed excluding the impact of foreign currency fluctuations, we present period-over-period percentage changes in our revenues and certain operating expenses on a constant currency basis in addition to the historical amounts as reported. Our constant currency presentation excludes the impact of our foreign currency cash flow hedging activities. Presenting constant currency results of operations is a non-GAAP financial measure and is not meant to be considered in isolation or as an alternative to GAAP results of operations. However, we have presented this non-GAAP financial measure to provide investors with an additional tool to evaluate our results of operations. To present this information, our current period revenues and certain operating expenses from entities reporting in currencies other than the U.S. dollar are converted into U.S. dollars at constant exchange rates rather than the actual exchange rates in effect during the respective periods (i.e. average rates in effect for the year ended December 31, 2021 are used as exchange rates for the year ended December 31, 2022 when comparing the year ended December 31, 2022 with the year ended December 31, 2021).
Liquidity and Capital Resources
Sources and Uses of Cash
Customer collections are our primary source of cash. We believe we have a strong customer base, and have continued to experience relatively strong collections. As of December 31, 2022, our principle sources of liquidity were $1.9 billion of cash and cash equivalents. In addition to our cash balance, we had $3.9 billion of additional liquidity available to us from our $4.0 billion revolving facility and general access to both public and private debt and the equity capital markets. We also have additional liquidity available to us from our 2022 ATM program, under which we may offer and sell from time to time our common stock in "at the market" transactions on either a spot or forward basis. As of December 31, 2022, we had $1.4 billion available for sale under the 2022 ATM Program.
We believe we have sufficient cash, coupled with anticipated cash generated from operating activities and external financing sources, to meet our operating requirements, including repayment of the current portion of our debt as it becomes due, distribution of dividends, completion of our publicly-announced acquisitions, ordinary costs to operate the business, and expansion projects.
As we continue to grow, we may pursue additional expansion opportunities, primarily the build out of new IBX data centers, in certain of our existing markets which are at or near capacity within the next year, as well as potential acquisitions and joint ventures. If the opportunity to expand is greater than planned we may further increase the level of capital expenditure to support this growth as well as pursue additional business and real estate acquisitions or joint ventures provided that we have or can access sufficient funding to pursue such expansion opportunities. We may elect to access the equity or debt markets from time to time opportunistically, particularly if financing is available on attractive terms. We will continue to evaluate our operating requirements and financial resources in light of future developments.
Cash Flow
| | | | | | | | | | | | | | | | | |
| Years Ended December 31, |
| 2022 | | 2021 | | Change |
| (in thousands) |
| Net cash provided by operating activities | $ | 2,963,182 | | | $ | 2,547,206 | | | $ | 415,976 | |
| Net cash used in investing activities | (3,362,953) | | | (3,006,738) | | | (356,215) | |
| Net cash provided by financing activities | 856,766 | | | 413,765 | | | 443,001 | |
Operating Activities
Our cash provided by our operations is generated by colocation, interconnection, managed infrastructure and other revenues. Our primary uses of cash from our operating activities include compensation and related costs, interest payments, other general corporate expenditures and taxes. Net cash provided by operating activities increased by $416.0 million during the year ended December 31, 2022 as compared to December 31, 2021, primarily driven by improved results of operations partially offset by increases in cash paid for costs and operating expenses.
Investing Activities
Net cash used in investing activities increased by $356.2 million during the year ended December 31, 2022 as compared to December 31, 2021, primarily due to an increase of $805.5 million spent on the Entel Chile and Peru data center acquisitions and the MainOne acquisition, an increase of $46.4 million spent on real estate acquisitions and a $37.1 million increase in purchases of investments. This increase was partially offset by a $473.5 million decrease in capital expenditures, a $41.3 million increase in the proceeds from the sale of assets to our xScale Joint Ventures and an $18.0 million increase in proceeds from the sale of investments.
Financing Activities
Net cash provided by financing activities increased by $443.0 million for the year ended December 31, 2022 as compared to December 31, 2021, primarily driven by a $2.0 billion decrease in the repayment of senior notes, a $676.9 million increase in proceeds from term loan facilities, a $298.1 million increase in proceeds from the ATM program, a $129.1 million decrease in the repayment of mortgage and loans payable, a $99.2 million decrease in debt extinguishment costs, a $31.3 million decrease in repayments of finance lease liabilities, a $7.4 million decrease in debt issuance costs and a $3.9 million increase in proceeds from employee awards. This increase is partially offset by a $2.7 billion decrease in proceeds from senior notes and a $108.6 million increase in dividend distributions.
Material Cash Commitments
As of December 31, 2022, our principle commitments were primarily comprised of:
•approximately $12.2 billion of principal from our senior notes (gross of debt issuance cost and debt discount);
•approximately $3.0 billion of interest on mortgage payable, loans payable, senior notes and term loans, based on their respective interest rates and recognized over the life of these instruments, and the credit facility fee for the revolving credit facility;
•$653.6 million of principal from our term loans, mortgage and loans payable (gross of debt issuance cost, debt discount, plus mortgage premium);
•approximately $5.4 billion of total lease payments, which represents lease payments under finance and operating lease arrangements, including renewal options that are reasonably certain to be exercised;
•approximately $1.6 billion of unaccrued capital expenditure contractual commitments, primarily for IBX equipment not yet delivered and labor not yet provided in connection with the work necessary to complete construction and open IBX data center expansion projects prior to making them available to customers for installation, the majority of which is payable within the next 12 months; and
•approximately $1.8 billion of other non-capital purchase commitments, such as commitments to purchase power in select locations and other open purchase orders, which contractually bind us for goods, services
or arrangements to be delivered or provided during 2023 and beyond, the majority of which is payable within the next two years.
We believe that our sources of liquidity, including our expected future operating cash flows, are sized to adequately meet both the near and long term material cash commitments for the foreseeable future. For further information on maturities of lease liabilities and debt instruments, see Notes 10 and 11, respectively, within the Consolidated Financial Statements.
Other Contractual Obligations
We have additional future equity contributions and commitments to the joint ventures with GIC and PGIM. For additional information, see the "Equity Method Investments" footnote within the Consolidated Financial Statements.
Additionally, we entered into lease agreements with various landlords primarily for data center spaces and ground leases which have not yet commenced as of December 31, 2022. For additional information, see “Maturities of Lease Liabilities” in Note 10 within the Consolidated Financial Statements.
Critical Accounting Policies and Estimates
Our consolidated financial statements are prepared in accordance with U.S. GAAP. The preparation of our financial statements requires management to make estimates and assumptions about future events that affect the reported amounts of assets and liabilities and the disclosure of contingent assets and liabilities at the date of the financial statements and the reported amounts of revenues and expenses during the reporting period. On an ongoing basis, management evaluates the accounting policies, assumptions, estimates and judgments to ensure that our consolidated financial statements are presented fairly and in accordance with GAAP. Management bases its assumptions, estimates and judgments on historical experience, current trends and various other factors that are believed to be reasonable under the circumstances, the results of which form the basis for making judgments about the carrying values of assets and liabilities that are not readily apparent from other sources. However, because future events and their effects cannot be determined with certainty, actual results may differ from these assumptions and estimates, and such differences could be material.
Our significant accounting policies are discussed in Note 1 to Consolidated Financial Statements in Item 8 of this Annual Report on Form 10-K. Management believes that the following accounting policies and estimates are the most critical to aid in fully understanding and evaluating our consolidated financial statements, and they require significant judgments, resulting from the need to make estimates about the effect of matters that are inherently uncertain:
• Accounting for income taxes;
• Accounting for business combinations;
• Accounting for impairment of goodwill and other intangible assets;
• Accounting for property, plant and equipment; and
• Accounting for leases.
| | | | | | | | |
Description |
Judgments and Uncertainties | Effect if Actual Results Differ from Assumptions |
Accounting for Income Taxes.
Deferred tax assets and liabilities are recognized based on the future tax consequences attributable to temporary differences that exist between the financial statement carrying value of assets and liabilities and their respective tax bases, as well as tax attributes such as operating loss, capital loss and tax credit carryforwards on a taxing jurisdiction basis. We measure deferred tax assets and liabilities using enacted tax rates that will apply in the years in which we expect the temporary differences to be recovered or settled. The accounting standard for income taxes requires a reduction of the carrying amounts of deferred tax assets by recording a valuation allowance if, based on the available evidence, it is more likely than not (defined by the accounting standard as a likelihood of more than 50%) that such assets will not be realized.
A tax benefit from an uncertain income tax position may be recognized in the financial statements only if it is more likely than not that the position is sustainable, based solely on its technical merits and consideration of the relevant taxing authority's widely understood administrative practices and precedents. We recognize interest and penalties related to unrecognized tax benefits within income tax benefit (expense) in the consolidated statements of operations. |
The valuation of deferred tax assets requires judgment in assessing the likely future tax consequences of events that have been recognized in our financial statements or tax returns. Our accounting for deferred tax consequences represents our best estimate of those future tax consequences.
In assessing the need for a valuation allowance, we consider both positive and negative evidence related to the likelihood of realization of the deferred tax assets. If, based on the weight of that available evidence, it is more likely than not the deferred tax assets will not be realized, we record a valuation allowance. The weight given to the positive and negative evidence is commensurate with the extent to which the evidence may be objectively verified.
This assessment, which is completed on a taxing jurisdiction basis, takes into account a number of types of evidence, including the following: 1) the nature, frequency and severity of current and cumulative financial reporting losses, 2) sources of future taxable income, 3) taxable income in carryback years permitted by the tax law, and 4) tax planning strategies.
In assessing the tax benefit from an uncertain income tax position, the tax position that meets the more-likely-than-not recognition threshold is initially and subsequently measured as the largest amount of tax benefit that is greater than a 50% likelihood of being realized upon ultimate settlement with a taxing authority that has full knowledge of all relevant information.
For purposes of the quarterly REIT asset tests, we estimate the fair market value of assets within our QRSs and TRSs using a discounted cash flow approach, by calculating the present value of forecasted future cash flows. We apply discount rates based on industry benchmarks relative to the market and forecasting risks. Other significant assumptions used to estimate the fair market value of assets in QRSs and TRSs include projected revenue growth, projected operating margins and projected capital expenditure. We revisit significant assumptions periodically to reflect any changes due to business or economic environment. |
As of December 31, 2022 and 2021, we had net total deferred tax liabilities of $338.7 million and $280.5 million, respectively. As of December 31, 2022 and 2021, we had a total valuation allowance of $166.6 million and $100.7 million, respectively. If and when we increase or reduce our valuation allowances, it may have an unfavorable or favorable impact, respectively, to our financial position and results of operations in the periods when such determinations are made. We will continue to assess the need for our valuation allowances, by jurisdiction, in the future.
During the year ended December 31, 2022, we established full valuation allowances against certain deferred tax assets in the Americas and EMEA regions, either as the assessment of the realization of such deferred tax assets or as part of the purchase accounting determination for the businesses we acquired during the year. We do not expect these deferred tax assets to be realizable in the foreseeable future. During the year ended December 31, 2021, we established full valuation allowances against certain deferred tax assets in the Americas and Asia-Pacific regions, as these deferred tax assets are not expected to be realizable in the foreseeable future.
As of December 31, 2022 and 2021, we had unrecognized tax benefits of $89.2 million and $148.3 million, respectively, exclusive of interest and penalties. During the year ended December 31, 2022, the unrecognized tax benefit decreased by $59.1 million primarily due to the settlements of tax audits in the EMEA region. During the year ended December 31, 2021, the unrecognized tax benefit decreased by $59.5 million primarily due to the settlements of various tax audits in the EMEA and Asia-Pacific regions. The unrecognized tax benefits of $89.2 million as of December 31, 2022, if subsequently recognized, will affect our effective tax rate favorably at the time when such a benefit is recognized. |
| | | | | | | | |
Description |
Judgments and Uncertainties | Effect if Actual Results Differ from Assumptions |
Accounting for Business Combinations
In accordance with the accounting standard for business combinations, we allocate the purchase price of an acquired business to its identifiable assets and liabilities based on estimated fair values. The excess of the purchase price over the fair value of the assets acquired and liabilities assumed, if any, is recorded as goodwill.
We use all available information to estimate fair values. We typically engage outside appraisal firms to assist in determining the fair value of identifiable intangible assets such as customer contracts, leases and any other significant assets or liabilities and contingent consideration, as well as the estimated useful life of intangible assets. We adjust the preliminary purchase price allocation, as necessary, up to one year after the acquisition closing date if we obtain more information regarding asset valuations and liabilities assumed. |
Our purchase price allocation methodology contains uncertainties because it requires assumptions and management's judgment to estimate the fair value of assets acquired and liabilities assumed at the acquisition date. Key judgments used to estimate the fair value of intangible assets include projected revenue growth and operating margins, discount rates, customer attrition rates, as well as the estimated useful life of intangible assets. Management estimates the fair value of assets and liabilities based upon quoted market prices, the carrying value of the acquired assets and widely accepted valuation techniques, including discounted cash flows and market multiple analyses. Our estimates are inherently uncertain and subject to refinement. Unanticipated events or circumstances may occur which could affect the accuracy of our fair value estimates, including assumptions regarding industry economic factors and business strategies. |
During the last three years, we have completed a number of business combinations, including the acquisition of Entel Peru data centers in the third quarter of 2022, MainOne in West Africa and Entel Chile data centers, both in the second quarter of 2022, GPX in India in the third quarter of 2021, Bell data centers in Canada in the fourth quarter of 2020, Packet in March 2020 and Axtel in Mexico in January 2020. The purchase price allocation for these acquisitions has been finalized, except for the MainOne, Entel Peru and Entel Chile acquisitions.
As of both December 31, 2022 and 2021, we had net intangible assets of $1.9 billion, respectively. We recorded amortization expense for intangible assets of $204.8 million, $205.5 million and $199.0 million for the years ended December 31, 2022, 2021 and 2020, respectively. We do not believe there is a reasonable likelihood that there will be a material change in the estimates or assumptions we used to complete the purchase price allocations and the fair value of assets acquired and liabilities assumed. However, if actual results are not consistent with our estimates or assumptions, we may be exposed to losses or gains that could be material, which would be recorded in our consolidated statements of operations in 2022 or beyond. |
| | | | | | | | |
Description |
Judgments and Uncertainties | Effect if Actual Results Differ from Assumptions |
Accounting for Impairment of Goodwill and Other Intangible Assets
In accordance with the accounting standard for goodwill and other intangible assets, we perform goodwill and other intangible assets impairment reviews annually, or whenever events or changes in circumstances indicate that the carrying value of an asset may not be recoverable. We complete the annual goodwill impairment assessment for the Americas, EMEA and Asia-Pacific reporting units to determine if the fair values of the reporting units exceeded their carrying values. We perform a review of other intangible assets for impairment by assessing events or changes in circumstances that indicate the carrying amount of an asset may not be recoverable. |
To perform annual goodwill impairment assessment, we elected to assess qualitative factors to determine whether it is more likely than not that the fair value of a reporting unit is less than its carrying value. This analysis requires assumptions and estimates before performing the quantitative goodwill impairment test, where the assessment requires assumptions and estimates derived from a review of our actual and forecasted operating results, approved business plans, future economic conditions and other market data. Additionally, we periodically review our assessment of our reporting units to determine if changes in facts and circumstances warrant changes to our conclusions. There were no specific factors present in 2022 or 2021 that indicated a potential goodwill impairment.
We performed our annual review of other intangible assets by assessing if there were events or changes in circumstances indicating that the carrying amount of an asset may not be recoverable, such as a significant decrease in market price of an asset, a significant adverse change in the extent or manner in which an asset is being used, a significant adverse change in legal factors or business climate that could affect the value of an asset or a continuous deterioration of our financial condition. This assessment requires assumptions and estimates derived from a review of our actual and forecasted operating results, approved business plans, future economic conditions and other market data. There were no specific events in 2022 or 2021 that indicated a potential impairment. |
As of December 31, 2022, goodwill attributable to the Americas, the EMEA and the Asia-Pacific reporting units was $2.6 billion, $2.4 billion and $0.6 billion, respectively.
Future events, changing market conditions and any changes in key assumptions may result in an impairment charge. While we have not recorded an impairment charge against our goodwill to date, the development of adverse business conditions in our Americas, EMEA or Asia-Pacific reporting units, such as higher than anticipated customer churn or significantly increased operating costs, or significant deterioration of our market comparables that we use in the market approach, could result in an impairment charge in future periods.
The balance of our other intangible assets, net, for both years ended December 31, 2022 and 2021 was $1.9 billion. While we have not recorded an impairment charge against our other intangible assets to date, future events or changes in circumstances, such as a significant decrease in market price of an asset, a significant adverse change in the extent or manner in which an asset is being used, a significant adverse change in legal factors or business climate, may result in an impairment charge in future periods.
|
| | | | | | | | |
Description |
Judgments and Uncertainties | Effect if Actual Results Differ from Assumptions |
Accounting for Property, Plant and Equipment
We have a substantial amount of property, plant and equipment recorded on our consolidated balance sheet. The vast majority of our property, plant and equipment represent the costs incurred to build out or acquire our IBX data centers. Our IBX data centers are long-lived assets. We depreciate our property, plant and equipment using the straight-line method over the estimated useful lives of the respective assets (subject to the term of the lease in the case of leased assets or leasehold improvements and integral equipment located in leased properties).
Accounting for property, plant and equipment includes determining the appropriate period in which to depreciate such assets, assessing such assets for potential impairment, capitalizing interest during periods of construction and assessing the asset retirement obligations required for certain leased properties that require us to return the leased properties back to their original condition at the time we decide to exit a leased property. |
Judgments are required in arriving at the estimated useful life of an asset and changes to these estimates would have significant impact on our financial position and results of operations. When we lease a property for our IBX data centers, we generally enter into long-term arrangements with renewal options generally available to us. In the next several years, a number of leases for our IBX data centers will come up for renewal. As we start approaching the end of these initial lease terms, we will need to reassess the estimated useful lives of our property, plant and equipment. In addition, we may find that our estimates for the useful lives of non-leased assets may also need to be revised periodically. We periodically review the estimated useful lives of certain of our property, plant and equipment and changes in these estimates in the future are possible.
The assessment of long-lived assets for impairment requires assumptions and estimates of undiscounted and discounted future cash flows. These assumptions and estimates require significant judgment and are inherently uncertain. |
As of December 31, 2022 and 2021, we had property, plant and equipment of $16.6 billion and $15.4 billion, respectively. During the years ended December 31, 2022, 2021 and 2020, we recorded depreciation expense of $1.5 billion, $1.5 billion, and $1.2 billion, respectively. While we evaluated the appropriateness, we did not revise the estimated useful lives of our property, plant and equipment during the years ended December 31, 2022, 2021 and 2020. Further changes in our estimated useful lives of our property, plant and equipment could have a significant impact on our results of operations. |
Accounting for Leases
A significant portion of our data center spaces, office spaces and equipment are leased. Each time we enter into a new lease or lease amendments, we analyze each lease or lease amendment for the proper accounting, including determining if an arrangement is or contains a lease at inception and making assessment of the leased properties to determine if they are operating or finance leases. |
Determination of accounting treatment, including the result of the lease classification test for each new lease or lease amendment, is dependent on a variety of judgments, such as identification of lease and non-lease components, allocation of total consideration between lease and non-lease components, determination of lease term, including assessing the likelihood of lease renewals, valuation of leased property, and establishing the incremental borrowing rate to calculate the present value of the minimum lease payment for the lease test. The judgments used in the accounting for leases are inherently subjective; different assumptions or estimates could result in different accounting treatment for a lease. |
Lease assumptions and estimates are determined and applied at the inception of the leases or at the lease modification date. As of December 31, 2022 and 2021, operating right-of-use ("ROU") lease assets were at $1.4 billion and $1.3 billion, respectively, and operating lease liabilities were at $1.4 billion and $1.3 billion respectively. As of December 31, 2022 and 2021, finance ROU assets were $2.0 billion and $1.9 billion, respectively, and finance lease liabilities were $2.3 billion and $2.1 billion, respectively. For the years ended December 31, 2022, 2021 and 2020, we recorded the finance lease cost of $273.6 million, $275.0 million and $233.9 million , respectively, and recorded rent expense of approximately $213.6 million, $221.8 million and $217.3 million, respectively. |
Recent Accounting Pronouncements
See "Recent Accounting Pronouncements" in Note 1 within the Consolidated Financial Statements.
ITEM 7A. Quantitative and Qualitative Disclosures About Market Risk
Market Risk
The following discussion about market risk involves forward-looking statements. Actual results could differ materially from those projected in the forward-looking statements. We may be exposed to market risks related to changes in interest rates and foreign currency exchange rates and fluctuations in the prices of certain commodities, primarily electricity.
We employ foreign currency forward and option contracts, cross-currency interest rate swaps and interest rate locks for the purpose of hedging certain specifically identified exposures. The use of these financial instruments is intended to mitigate some of the risks associated with fluctuations in currency exchange and interest rates, but does not eliminate such risks. We do not use financial instruments for trading or speculative purposes.
Investment Portfolio Risk
We maintain an investment portfolio of various holdings, types, and maturities that is prioritized on meeting REIT asset requirements. All of our marketable securities are recorded on our consolidated balance sheets at fair value with changes in fair values recognized in net income. We consider various factors in determining whether we should recognize an impairment charge for our securities, including the length of time and extent to which the fair value has been less than our cost basis and our intent and ability to hold the investment for a period of time sufficient to allow for any anticipated recovery. We anticipate that we will recover the entire cost basis of these securities and have determined that no other-than-temporary impairments associated with credit losses were required to be recognized during the year ended December 31, 2022.
As of December 31, 2022, our investment portfolio of cash equivalents and marketable securities consisted of money market funds. The amount in our investment portfolio that could be susceptible to market risk totaled $764.6 million.
Interest Rate Risk
We are exposed to interest rate risk related to our outstanding debt. An immediate increase or decrease in current interest rates from their position as of December 31, 2022 would not have a material impact on our interest expense due to the fixed coupon rate on the majority of our debt obligations. However, the interest expense associated with our senior credit facility and term loans that bear interest at variable rates could be affected. For every 100-basis point increase or decrease in interest rates, our annual interest expense could increase by approximately $6.1 million or decrease by approximately $6.1 million based on the total balance of our term loan borrowings as of December 31, 2022.
We periodically enter into interest rate locks to hedge the interest rate exposure created by anticipated fixed rate debt issuances, which are designated as cash flow hedges. When interest rate locks are settled, any accumulated gain or loss included as a component of other comprehensive income (loss) will be amortized to interest expense over the term of the forecasted hedged transaction which is equivalent to the term of the interest rate locks. We also use cross-currency swaps to hedge our interest rate risk in our variable rate debt obligations by changing the benchmark rate for a portion of the variable rate debt obligations from SONIA to SOFR. As of December 31, 2022, the total notional amount of such cross-currency interest rate swaps was $280.3 million.
The fair value of our long-term fixed interest rate debt is subject to interest rate risk. Generally, the fair value of fixed interest rate debt will increase as interest rates fall and decrease as interest rates rise. These interest rate changes may affect the fair value of the fixed interest rate debt but do not impact our earnings or cash flows. The fair value of our mortgage and loans payable, which are not traded in the market, is estimated by considering our credit rating, current rates available to us for debt of the same remaining maturities and the terms of the debt. The fair value of our other senior notes, which are traded in the market, was based on quoted market prices. The following table represents the carrying value and estimated fair value of our mortgage and loans payable and senior notes as of (in thousands):
| | | | | | | | | | | | | | | | | | | | | | | |
| December 31, 2022 | | December 31, 2021 |
| Carrying Value (1) | | Fair Value | | Carrying Value (1) | | Fair Value |
| Mortgage and loans payable | $ | 653,617 | | | $ | 666,387 | | | $ | 618,388 | | | $ | 621,051 | |
| Senior notes | 12,226,890 | | | 10,196,933 | | | 11,102,130 | | | 11,049,834 | |
(1)The carrying value is gross of debt issuance cost, debt discount and debt premium.
Foreign Currency Risk
To help manage the exposure to foreign currency exchange rate fluctuations, we have implemented a number of hedging programs, in particular (i) a cash flow hedging program to hedge the forecasted revenues and expenses in our EMEA region as well as our debt denominated in foreign-currencies, (ii) a balance sheet hedging program to hedge the re-measurement of monetary assets and liabilities denominated in foreign currencies, and (iii) a net investment hedging program to hedge the long term investments in our foreign subsidiaries. Our hedging programs reduce, but do not entirely eliminate, the impact of currency exchange rate movements and their impact on the consolidated statements of operations.
We have entered into various foreign currency debt obligations. As of December 31, 2022, the total principal amount of foreign currency debt obligations was $1.8 billion, including $1.2 billion denominated in Euro and $603.9 million denominated in British Pound. As of December 31, 2022, we have designated $1.5 billion of the total principal amount of foreign currency debt obligations as net investment hedges against our net investments in foreign subsidiaries. For a net investment hedge, changes in the fair value of the hedging instrument designated as a net investment hedge are recorded as a component of other comprehensive income (loss) in the consolidated balance sheets. Fluctuations in the exchange rates between these foreign currencies and the U.S. Dollar will impact the amount of U.S. Dollars that we will require to settle the foreign currency debt obligations at maturity. If the U.S. Dollar would have been weaker or stronger by 10% in comparison to these foreign currencies as of December 31, 2022, we estimate our obligation to cash settle the principal of these foreign currency debt obligations in U.S. Dollars would have increased or decreased by approximately $197.9 million and $161.9 million, respectively.
We are also party to cross-currency interest rate swaps. As of December 31, 2022 and 2021, the total notional amounts of cross-currency interest rate swap contracts, which have been designated as hedges of our net investment in foreign subsidiaries, were $3.9 billion and $4.0 billion, respectively. The changes in the fair value of these swaps are recorded as a component of accumulated other comprehensive income (loss) in the consolidated balance sheets. If the U.S. Dollar weakened or strengthened by 10% in comparison to foreign currencies, we estimate our obligation to cash settle these hedges would have increased or decreased by approximately $375.6 million and $307.3 million, respectively.
The U.S. Dollar strengthened relative to certain of the currencies of the foreign countries in which we operate during the year ended December 31, 2022. This has impacted our consolidated financial position and results of operations during this period, including the amount of revenues that we reported. Continued strengthening or weakening of the U.S. Dollar will continue to impact us in future periods.
With the existing cash flow hedges in place, a hypothetical additional 10% strengthening of the U.S. Dollar during the year ended December 31, 2022 would have resulted in a reduction of our revenues and a reduction of our operating expenses including depreciation and amortization expense by approximately $222.1 million and $220.8 million, respectively.
With the existing cash flow hedges in place, a hypothetical additional 10% weakening of the U.S. Dollar during the year ended December 31, 2022 would have resulted in an increase of our revenues and an increase of our operating expenses including depreciation and amortization expenses, by approximately $284.3 million and $283.7 million, respectively.
Commodity Price Risk
Certain operating costs incurred by us are subject to price fluctuations caused by the volatility of underlying commodity prices. The commodities most likely to have an impact on our results of operations in the event of price changes are electricity, supplies and equipment used in our IBX data centers. We closely monitor the cost of electricity at all of our locations. We have entered into various power contracts to purchase power at fixed prices in certain locations in Australia, Brazil, Bulgaria, Canada, China, Finland, France, Germany, Ireland, Italy, Japan, the Netherlands, Poland, Portugal, Singapore, Spain, Sweden, Switzerland, the United Kingdom and the U.S.
In addition, as we are building new, or expanding existing, IBX data centers, we are subject to commodity price risk for building materials related to the construction of these IBX data centers, such as steel and copper. In addition, the lead-time to procure certain pieces of equipment, such as generators, is substantial. Any delays in procuring the necessary pieces of equipment for the construction of our IBX data centers could delay the anticipated openings of these new IBX data centers and, as a result, increase the cost of these projects.
We do not currently employ forward contracts or other financial instruments to address commodity price risk other than the power contracts discussed above.
ITEM 8. Financial Statements and Supplementary Data
The financial statements and supplementary data required by this Item 8 are listed in Item 15(a)(1) and begin at page F-1 of this Annual Report on Form 10-K.
ITEM 9. Changes in and Disagreements with Accountants on Accounting and Financial Disclosure
There is no disclosure to report pursuant to Item 9.
ITEM 9A. Controls and Procedures
Conclusion Regarding the Effectiveness of Disclosure Controls and Procedures
Under the supervision and with the participation of our management, including our Chief Executive Officer and our Chief Financial Officer, we conducted an evaluation of our disclosure controls and procedures, as such term is defined under Rule 13a-15(e) promulgated under the Securities Exchange Act of 1934, as amended (the "Exchange Act"). Based on this evaluation, our Chief Executive Officer and our Chief Financial Officer concluded that our disclosure controls and procedures were effective at the reasonable assurance level as of December 31, 2022.
Management's Report on Internal Control Over Financial Reporting
Our management is responsible for establishing and maintaining adequate internal control over financial reporting, as such term is defined in Exchange Act Rule 13a-15(f). Because of its inherent limitations, internal control over financial reporting may not prevent or detect misstatements. Also, projections of any evaluation of effectiveness to future periods are subject to the risk that controls may become inadequate because of changes in conditions, or that the degree of compliance with the policies or procedures may deteriorate.
Under the supervision and with the participation of our management, including our Chief Executive Officer and Chief Financial Officer, we conducted an evaluation of the effectiveness of our internal control over financial reporting based on the framework in Internal Control – Integrated Framework (2013) issued by the Committee of Sponsoring Organizations of the Treadway Commission.
Based on our evaluation under the framework in Internal Control – Integrated Framework (2013), our management concluded that our internal control over financial reporting was effective as of December 31, 2022.
The effectiveness of our internal control over financial reporting as of December 31, 2022 has been audited by PricewaterhouseCoopers LLP, an independent registered public accounting firm, as stated in their report which is included herein on page F-1 of this Annual Report on Form 10-K.
Limitations on the Effectiveness of Controls
Our management, including our Chief Executive Officer and Chief Financial Officer, believes that our disclosure controls and procedures and internal control over financial reporting are designed and operated to be effective at the reasonable assurance level. However, our management does not expect that our disclosure controls and procedures or our internal control over financial reporting will prevent all errors and all fraud. A control system, no matter how well conceived and operated, can provide only reasonable, not absolute, assurance that the objectives of the control system are met. Further, the design of a control system must reflect the fact that there are resource constraints, and the benefits of controls must be considered relative to their costs. Because of the inherent limitations in all control systems, no evaluation of controls can provide absolute assurance that all control issues and instances of fraud, if any, have been detected. These inherent limitations include the realities that judgments in decision making can be faulty, and that breakdowns can occur because of a simple error or mistake. Additionally, controls can be circumvented by the individual acts of some persons, by collusion of two or more people or by management override of the controls. The design of any system of controls is also based in part upon certain assumptions about the likelihood of future events, and there can be no assurance that any design will succeed in achieving its stated goals under all potential future conditions; over time, controls may become inadequate because of changes in conditions, or the degree of compliance with policies or procedures may deteriorate. Because of the inherent limitations in a cost effective control system, misstatements due to error or fraud may occur and not be detected.
Changes in Internal Control Over Financial Reporting
In the third quarter of 2022, as part of our multi-year project to move the backbone of our finance systems to the cloud, we completed deployment of certain modules in our new cloud enterprise resource planning (“ERP”) system to support the financial close and our reporting requirements. As a result of the ERP system implementation, certain internal controls over financial reporting have been automated, modified, or implemented to address the new control environment and processes associated with the ERP system.
There have been no other changes in our internal control over financial reporting identified in connection with the evaluation required by Rules 13a-15(d) and 15d-15(d) of the Exchange Act that occurred during the twelve months ended December 31, 2022 that have materially affected, or are reasonably likely to materially affect, our internal control over financial reporting
ITEM 9B. Other Information
There is no disclosure to report pursuant to Item 9B.
ITEM 9C. Disclosure Regarding Foreign Jurisdictions that Prevent Inspections
There is no disclosure to report pursuant to Item 9C.
PART III
ITEM 10. Directors, Executive Officers and Corporate Governance
The information required by this Item is incorporated by reference to the definitive Proxy Statement for our 2023 Annual Meeting of Stockholders, which will be filed with the SEC no later than 120 days after December 31, 2022 pursuant to Regulation 14A.
We have adopted a Code of Ethics applicable for the Chief Executive Officer and Senior Financial Officers and a Code of Business Conduct, which are both "Code(s) of Ethics for Senior Financial Officers" as defined by applicable rules of the SEC. This information is incorporated by reference to the Equinix Proxy Statement for the 2023 Annual Meeting of Stockholders and is also available on our website, www.equinix.com.
ITEM 11. Executive Compensation
The information required by this Item is incorporated by reference to the definitive Proxy Statement for our 2023 Annual Meeting of Stockholders, which will be filed with the SEC no later than 120 days after December 31, 2022 pursuant to Regulation 14A.
ITEM 12. Security Ownership of Certain Beneficial Owners and Management and Related Stockholder Matters
Information required by this item is incorporated by reference to the Equinix Proxy Statement for the 2023 Annual Meeting of Stockholders, which will be filed with the SEC no later than 120 days after December 31, 2022 pursuant to Regulation 14A.
ITEM 13. Certain Relationships and Related Transactions, and Director Independence
The information required by this Item is incorporated by reference to the definitive Proxy Statement for our 2023 Annual Meeting of Stockholders, which will be filed with the SEC no later than 120 days after December 31, 2022 pursuant to Regulation 14A.
ITEM 14. Principal Accountant Fees and Services
The information required by this Item is incorporated by reference to the definitive Proxy Statement for our 2023 Annual Meeting of Stockholders, which will be filed with the SEC no later than 120 days after December 31, 2022 pursuant to Regulation 14A.
PART IV
ITEM 15. Exhibits, Financial Statement Schedules
(a)(1) Financial Statements:
(a)(2) Financial statements and schedule:
(a)(3) Exhibits:
| | | | | | | | | | | | | | | | | | | | | | | | | | | | | | | | |
| | | | Incorporated by Reference | | |
| Exhibit Number | | Exhibit Description | | Form | | Filing Date/
Period End Date | | Exhibit | | Filed
Herewith |
| | | | | | | | | | |
| | | | 8-K | | 5/29/2015 | | 2.1 | | |
| | | | | | | | | | |
| | | | 8-K | | 5/29/2015 | | 2.2 | | |
| | | | | | | | | | |
| | | | 10-K | | 12/31/2015 | | 2.3 | | |
| | | | | | | | | | |
| | | | 8-K | | 12/6/2016 | | 2.1 | | |
| | | | | | | | | | |
| | | | 10-K | | 12/31/2016 | | 2.5 | | |
| | | | | | | | | | |
| | | | 8-K | | 5/1/2017 | | 2.1 | | |
| | | | | | | | | | |
| | | | 10-Q | | 8/8/2018 | | 2.7 | | |
| | | | | | | | | | |
| | | | 10-K/A | | 12/31/2002 | | 3.1 | | |
| | | | | | | | | | |
| | | | | | | | | | | | | | | | | | | | | | | | | | | | | | | | |
| | | | Incorporated by Reference | | |
| Exhibit Number | | Exhibit Description | | Form | | Filing Date/
Period End Date | | Exhibit | | Filed
Herewith |
| | | | 8-K | | 6/14/2011 | | 3.1 | | |
| | | | | | | | | | |
| | | | 8-K | | 6/11/2013 | | 3.1 | | |
| | | | | | | | | | |
| | | | 10-Q | | 6/30/2014 | | 3.4 | | |
| | | | | | | | | | |
| | | | 10-K/A | | 12/31/2002 | | 3.3 | | |
| | | | | | | | | | |
| | | | 8-K | | 4/13/2022 | | 3.1 | | |
| | | | | | | | | | |
| 4.1 | | Reference is made to Exhibits 3.1, 3.2, 3.3, 3.4, 3.5 and 3.6. | | | | | | | | |
| | | | | | | | | | |
| | | | 8-K | | 12/5/2017 | | 4.1 | | |
| | | | | | | | | | |
| | | | 8-K | | 11/18/2019 | | 4.2 | | |
| | | | | | | | | | |
| 4.4 | | Form of 2.625% Senior Notes due 2024 (See Exhibit 4.3). | | | | | | | | |
| | | | | | | | | | |
| | | | 8-K | | 11/18/2019 | | 4.4 | | |
| | | | | | | | | | |
| 4.6 | | Form of 2.900% Senior Notes due 2026 (See Exhibit 4.5). | | | | | | | | |
| | | | | | | | | | |
| | | | 8-K | | 11/18/2019 | | 4.6 | | |
| | | | | | | | | | |
| 4.8 | | Form of 3.200% Senior Notes due 2029 (See Exhibit 4.7) | | 8-K | | 6/22/2020 | | | | |
| | | | | | | | | | |
| | | | 8-K | | 6/22/2020 | | 4.2 | | |
| | | | | | | | | | |
| 4.10 | | Form of 1.250% Senior Note due 2025 (See Exhibit 4.9) | | | | | | | | |
| | | | | | | | | | |
| | | | 8-K | | 6/22/2020 | | 4.4 | | |
| | | | | | | | | | |
| 4.12 | | Form of 1.800% Senior Note due 2027 (See Exhibit 4.11) | | | | | | | | |
| | | | | | | | | | |
| | | | 8-K | | 6/22/2020 | | 4.6 | | |
| | | | | | | | | | |
| 4.14 | | Form of 2.150% Senior Note due 2030 (see Exhibit 4.13) | | | | | | | | |
| | | | | | | | | | |
| | | | | | | | | | | | | | | | | | | | | | | | | | | | | | | | |
| | | | Incorporated by Reference | | |
| Exhibit Number | | Exhibit Description | | Form | | Filing Date/
Period End Date | | Exhibit | | Filed
Herewith |
| | | | 8-K | | 6/22/2020 | | 4.8 | | |
| | | | | | | | | | |
| 4.16 | | Form of 3.000% Senior Note due 2050 (See Exhibit 4.15) | | | | | | | | |
| | | | | | | | | | |
| | | | 8-K | | 10/7/2020 | | 4.2 | | |
| | | | | | | | | | |
| 4.18 | | Form of 1.000% Senior Note due 2025 (included in Exhibit 4.17) | | | | | | | | |
| | | | | | | | | | |
| | | | 8-K | | 10/7/2020 | | 4.4 | | |
| | | | | | | | | | |
| 4.20 | | Form of 1.550% Senior Note due 2028 (included in Exhibit 4.19) | | | | | | | | |
| | | | | | | | | | |
| | | | 8-K | | 10/7/2020 | | 4.6 | | |
| | | | | | | | | | |
| 4.22 | | Form of 2.950% Senior Note due 2051 (included in Exhibit 4.21) | | | | | | | | |
| | | | | | | | | | |
| | | | 8-K | | 3/11/2021 | | 4.2 | | |
| | | | | | | | | | |
| 4.24 | | Form of 0.250% Senior Note due 2027 (included in Exhibit 4.23) | | | | | | | | |
| | | | | | | | | | |
| | | | 8-K | | 3/11/2021 | | 4.4 | | |
| | | | | | | | | | |
| 4.26 | | Form of 1.000% Senior Note due 2033 (included in Exhibit 4.25) | | | | | | | | |
| | | | | | | | | | |
| | | | 8-K | | 5/17/2021 | | 4.2 | | |
| | | | | | | | | | |
| 4.28 | | Form of 1.450% Senior Note due 2026 (included in Exhibit 4.34) Form of 1.450% Senior Note due 2026 (included in Exhibit 4.27) | | | | | | | | |
| | | | | | | | | | |
| | | | 8-K | | 5/17/2021 | | 4.4 | | |
| | | | | | | | | | |
| 4.30 | | Form of 2.000% Senior Note due 2028 (included in Exhibit 4.29) | | | | | | | | |
| | | | | | | | | | |
| | | | 8-K | | 5/17/2021 | | 4.6 | | |
| | | | | | | | | | |
| 4.32 | | Form of 2.500% Senior Note due 2031 (included in Exhibit 4.31) | | | | | | | | |
| | | | | | | | | | |
| | | | 8-K | | 5/17/2021 | | 4.8 | | |
| | | | | | | | | | | | | | | | | | | | | | | | | | | | | | | | |
| | | | Incorporated by Reference | | |
| Exhibit Number | | Exhibit Description | | Form | | Filing Date/
Period End Date | | Exhibit | | Filed
Herewith |
| | | | | | | | | | |
| 4.34 | | Form of 3.400% Senior Note due 2052 (included in Exhibit 4.33) | | | | | | | | |
| | | | | | | | | | |
| | | | 8-K | | 4/5/2022 | | 4.2 | | |
| | | | | | | | | | |
| 4.36 | | Form of 3.900% Senior Notes due 2032 (included in Exhibit 4.35) | | | | | | | | |
| | | | | | | | | | |
| | | | 10-K | | 12/31/2014 | | 4.13 | | |
| | | | | | | | | | |
| | | | | | | | | | X |
| | | | | | | | | | |
| | | | S-4 (File No. 333-93749) | | 12/29/1999 | | 10.5 | | |
| | | | | | | | | | |
| | | | 10-K | | 12/31/2021 | | 10.2 | | |
| | | | | | | | | | |
| | | | DEF14A | | 4/27/2020 | | Appendix A | | |
| | | | | | | | | | |
| | | | | | | | | | X |
| | | | | | | | | | |
| | | | 10-Q | | 3/31/2020 | | 10.19 | | |
| | | | | | | | | | |
| | | | 10-Q | | 3/31/2020 | | 10.20 | | |
| | | | | | | | | | |
| | | | 10-Q | | 3/31/2020 | | 10.21 | | |
| | | | | | | | | | |
| | | | 10-Q | | 3/31/2021 | | 10.11 | | |
| | | | | | | | | | |
| | | | 10-Q | | 3/31/2021 | | 10.12 | | |
| | | | | | | | | | |
| | | | 10-Q | | 3/31/2021 | | 10.13 | | |
| | | | | | | | | | |
| | | | 10-Q | | 3/31/2022 | | 10.11 | | |
| | | | | | | | | | |
| | | | 10-Q | | 3/31/2022 | | 10.12 | | |
| | | | | | | | | | |
| | | | 10-Q | | 3/31/2022 | | 10.13 | | |
| | | | | | | | | | |
| | | | 10-Q | | 3/31/2022 | | 10.14 | | |
| | | | | | | | | | |
| | | | | | | | | | | | | | | | | | | | | | | | | | | | | | | | |
| | | | Incorporated by Reference | | |
| Exhibit Number | | Exhibit Description | | Form | | Filing Date/
Period End Date | | Exhibit | | Filed
Herewith |
| | | | 10-Q | | 9/30/2014 | | 10.67 | | |
| | | | | | | | | | |
| | Credit Agreement dated January 7, 2022 by and among Equinix, as borrower, a syndicate of financial institutions, as lenders, Bank of America, N.A., as administrative agent, Citibank, N.A., JPMorgan Chase Bank, N.A., MUFG Bank, Ltd., RBC Capital Markets, Goldman Sachs Bank USA and HSBC Securities (USA) Inc., as co-syndication agents, Barclays Bank PLC, BNP Paribas, Deutsche Bank AG New York Branch, ING Bank N.V., Dublin Branch, Morgan Stanley Senior Funding, Inc., Sumitomo Mitsui Banking Corporation, The Bank of Nova Scotia and TD Securities (USA) LLC, as co-documentation agents, and BofA Securities, Inc., Citibank, N.A., JPMorgan Chase Bank, N.A., MUFG Bank, Ltd., RBC Capital Markets, Goldman Sachs Bank USA and HSBC Securities (USA) Inc., as joint lead arrangers and book runners. | | 10-K | | 12/31/2021 | | 10.22 | | |
| | | | | | | | | | |
| | | | 10-K | | 2/22/2019 | | 10.37 | | |
| | | | | | | | | | |
| | | | 10-Q | | 9/30/2019 | | 10.25 | | |
| | | | | | | | | | |
| | | | 10-Q | | 9/30/2019 | | 10.26 | | |
| | | | | | | | | | |
| | | | 10-Q | | 9/30/2019 | | 10.27 | | |
| | | | | | | | | | |
| | | | 10-Q | | 9/30/2019 | | 10.28 | | |
| | | | | | | | | | |
| | | | 10-Q | | 9/30/2019 | | 10.29 | | |
| | | | | | | | | | |
| | | | 10-Q | | 9/30/2019 | | 10.31 | | |
| | | | | | | | | | |
| | | | | | | | | | X |
| | | | | | | | | | |
| | | | | | | | | | | | | | | | | | | | | | | | | | | | | | | | |
| | | | Incorporated by Reference | | |
| Exhibit Number | | Exhibit Description | | Form | | Filing Date/
Period End Date | | Exhibit | | Filed
Herewith |
| | | | | | | | | | X |
| | | | | | | | | | |
| | | | 10-Q | | 9/30/2019 | | 10.34 | | |
| | | | | | | | | | |
| | | | 10-Q | | 9/30/2019 | | 10.36 | | |
| | | | | | | | | | |
| | | | 10-Q | | 9/30/2019 | | 10.37 | | |
| | | | | | | | | | |
| | | | 10-Q | | 9/30/2019 | | 10.38 | | |
| | | | | | | | | | |
| | | | 10-Q | | 9/30/2019 | | 10.39 | | |
| | | | | | | | | | |
| | | | 10-Q | | 9/30/2019 | | 10.40 | | |
| | | | | | | | | | |
| | | | 10-Q | | 9/30/2022 | | 10.39 | | |
| | | | | | | | | | |
| | | | | | | | | | X |
| | | | | | | | | | |
| | | | | | | | | | X |
| | | | | | | | | | |
| | | | | | | | | | X |
| | | | | | | | | | |
| | | | | | | | | | X |
| | | | | | | | | | |
| | | | | | | | | | X |
| | | | | | | | | | |
| | | | | | | | | | X |
| | | | | | | | | | |
| 101.INS | | XBRL Instance Document - the instance document does not appear in the Interactive Data File because its XBRL tags are embedded within the Inline XBRL document. | | | | | | | | X |
| | | | | | | | | | |
| 101.SCH | | Inline XBRL Taxonomy Extension Schema Document. | | | | | | | | X |
| | | | | | | | | | |
| 101.CAL | | Inline XBRL Taxonomy Extension Calculation Linkbase Document. | | | | | | | | X |
| | | | | | | | | | |
| 101.DEF | | Inline XBRL Taxonomy Extension Definition Linkbase Document. | | | | | | | | X |
| | | | | | | | | | |
| 101.LAB | | Inline XBRL Taxonomy Extension Label Linkbase Document. | | | | | | | | X |
| | | | | | | | | | |
| | | | | | | | | | | | | | | | | | | | | | | | | | | | | | | | |
| | | | Incorporated by Reference | | |
| Exhibit Number | | Exhibit Description | | Form | | Filing Date/
Period End Date | | Exhibit | | Filed
Herewith |
| 101.PRE | | Inline XBRL Taxonomy Extension Presentation Linkbase Document. | | | | | | | | X |
| | | | | | | | | | |
| 104 | | Cover Page Interactive Data File - the cover page interactive data file does not appear in the Interactive Data File because its XBRL tags are embedded within the Inline XBRL document. | | | | | | | | X |
** Management contracts or compensation plans or arrangements in which directors or executive officers are eligible to participate.
(b)Exhibits.
See (a) (3) above.
(c)Financial Statement Schedule.
See (a) (2) above.
ITEM 16. Form 10-K Summary
Not applicable.
Signatures
Pursuant to the requirements of Section 13 or 15(d) of the Securities Exchange Act of 1934, the registrant has duly caused this Annual Report on Form 10-K to be signed on its behalf by the undersigned, thereunto duly authorized.
| | | | | | | | |
| | EQUINIX, INC.
(Registrant) |
| | |
| February 17, 2023 | By | /s/ CHARLES MEYERS |
| | Charles Meyers |
| | Chief Executive Officer and President |
Power of Attorney
KNOW ALL PERSONS BY THESE PRESENTS, that each person whose signature appears below constitutes and appoints Charles Meyers or Keith D. Taylor, or either of them, each with the power of substitution, their attorney-in-fact, to sign any amendments to this Annual Report on Form 10-K (including post-effective amendments), and to file the same, with exhibits thereto and other documents in connection therewith, with the Securities and Exchange Commission, hereby ratifying and confirming all that each of said attorneys-in-fact, or their substitute or substitutes, may do or cause to be done by virtue hereof.
Pursuant to the requirements of the Securities Exchange Act of 1934, this report has been signed below by the following persons on behalf of the registrant and in the capacities and on the dates indicated.
| | | | | | | | |
| Signature | Title | Date
|
| /s/ CHARLES MEYERS | Chief Executive Officer and President (Principal Executive Officer) | February 17, 2023 |
Charles Meyers |
| /s/ KEITH D. TAYLOR | Chief Financial Officer (Principal Financial Officer) | February 17, 2023 |
Keith D. Taylor |
| /s/ SIMON MILLER | Chief Accounting Officer (Principal Accounting Officer)
| February 17, 2023 |
Simon Miller |
| /s/ PETER F. VAN CAMP | Executive Chairman | February 17, 2023 |
Peter F. Van Camp |
| /s/ NANCI CALDWELL | Director | February 17, 2023 |
Nanci Caldwell |
| /s/ ADAIRE FOX-MARTIN | Director | February 17, 2023 |
Adaire Fox-Martin |
| /s/ RON GUERRIER | Director | February 17, 2023 |
Ron Guerrier |
| /s/ GARY F. HROMADKO | Director | February 17, 2023 |
Gary F. Hromadko |
| /s/ IRVING F. LYONS, III | Director | February 17, 2023 |
Irving F. Lyons, III |
| /s/ CHRISTOPHER B. PAISLEY | Director | February 17, 2023 |
Christopher B. Paisley |
| /s/ SANDRA RIVERA | Director | February 17, 2023 |
| Sandra Rivera |
| /s/ THOMAS OLINGER | Director | February 17, 2023 |
| Thomas Olinger |
| /s/ JEETU PATEL | Director | February 17, 2023 |
| Jeetu Patel |
| /s/ FIDELMA RUSSO | Director | February 17, 2023 |
| Fidelma Russo |
Index to Exhibits
| | | | | | | | |
Exhibit
Number | | Description of Document |
| | |
| | |
| | |
| | |
| | |
| | |
| | |
| | |
| | |
| | |
| | |
| | |
| | |
| | |
| | |
| | |
| | |
| | |
| | |
| | |
| | |
| 101.INS | | XBRL Instance Document - the instance document does not appear in the Interactive Data File because its XBRL tags are embedded within the Inline XBRL document. |
| | |
| 101.SCH | | Inline XBRL Taxonomy Extension Schema Document. |
| | |
| 101.CAL | | Inline XBRL Taxonomy Extension Calculation Document. |
| | |
| 101.DEF | | Inline XBRL Taxonomy Extension Definition Document. |
| | |
| 101.LAB | | Inline XBRL Taxonomy Extension Labels Document. |
| | |
| 101. PRE | | Inline XBRL Taxonomy Extension Presentation Document. |
| | |
| 104 | | Cover Page Interactive Data File - the cover page interactive data file does not appear in the Interactive Data File because its XBRL tags are embedded within the Inline XBRL document. |
** Management contracts or compensation plans or arrangements in which directors or executive officers are eligible to participate.
Report of Independent Registered Public Accounting Firm
To the Board of Directors and Stockholders of Equinix, Inc.
Opinions on the Financial Statements and Internal Control over Financial Reporting
We have audited the accompanying consolidated balance sheets of Equinix, Inc. and its subsidiaries (the “Company”) as of December 31, 2022 and December 31, 2021, and the related consolidated statements of operations, of comprehensive income (loss), of stockholders' equity and other comprehensive income (loss) and of cash flows for each of the three years in the period ended December 31, 2022, including the related notes and financial statement schedule listed in the index appearing under Item 15(a)(2) (collectively referred to as the “consolidated financial statements”). We also have audited the Company's internal control over financial reporting as of December 31, 2022, based on criteria established in Internal Control - Integrated Framework (2013) issued by the Committee of Sponsoring Organizations of the Treadway Commission (COSO).
In our opinion, the consolidated financial statements referred to above present fairly, in all material respects, the financial position of the Company as of December 31, 2022 and 2021, and the results of its operations and its cash flows for each of the three years in the period ended December 31, 2022 in conformity with accounting principles generally accepted in the United States of America. Also in our opinion, the Company maintained, in all material respects, effective internal control over financial reporting as of December 31, 2022, based on criteria established in Internal Control - Integrated Framework (2013) issued by the COSO.
Basis for Opinions
The Company's management is responsible for these consolidated financial statements, for maintaining effective internal control over financial reporting, and for its assessment of the effectiveness of internal control over financial reporting, included in Management's Report on Internal Control over Financial Reporting appearing under Item 9A. Our responsibility is to express opinions on the Company's consolidated financial statements and on the Company's internal control over financial reporting based on our audits. We are a public accounting firm registered with the Public Company Accounting Oversight Board (United States) (PCAOB) and are required to be independent with respect to the Company in accordance with the U.S. federal securities laws and the applicable rules and regulations of the Securities and Exchange Commission and the PCAOB.
We conducted our audits in accordance with the standards of the PCAOB. Those standards require that we plan and perform the audits to obtain reasonable assurance about whether the consolidated financial statements are free of material misstatement, whether due to error or fraud, and whether effective internal control over financial reporting was maintained in all material respects.
Our audits of the consolidated financial statements included performing procedures to assess the risks of material misstatement of the consolidated financial statements, whether due to error or fraud, and performing procedures that respond to those risks. Such procedures included examining, on a test basis, evidence regarding the amounts and disclosures in the consolidated financial statements. Our audits also included evaluating the accounting principles used and significant estimates made by management, as well as evaluating the overall presentation of the consolidated financial statements. Our audit of internal control over financial reporting included obtaining an understanding of internal control over financial reporting, assessing the risk that a material weakness exists, and testing and evaluating the design and operating effectiveness of internal control based on the assessed risk. Our audits also included performing such other procedures as we considered necessary in the circumstances. We believe that our audits provide a reasonable basis for our opinions.
Definition and Limitations of Internal Control over Financial Reporting
A company's internal control over financial reporting is a process designed to provide reasonable assurance regarding the reliability of financial reporting and the preparation of financial statements for external purposes in accordance with generally accepted accounting principles. A company's internal control over financial reporting includes those policies and procedures that (i) pertain to the maintenance of records that, in reasonable detail, accurately and fairly reflect the transactions and dispositions of the assets of the company; (ii) provide reasonable assurance that transactions are recorded as necessary to permit preparation of financial statements in accordance with generally accepted accounting principles, and that receipts and expenditures of the company are being made only in accordance with authorizations of management and directors of the company; and (iii) provide reasonable assurance regarding prevention or timely detection of unauthorized acquisition, use, or disposition of the company's assets that could have a material effect on the financial statements.
Because of its inherent limitations, internal control over financial reporting may not prevent or detect misstatements. Also, projections of any evaluation of effectiveness to future periods are subject to the risk that controls may become inadequate because of changes in conditions, or that the degree of compliance with the policies or procedures may deteriorate.
Critical Audit Matters
The critical audit matter communicated below is a matter arising from the current period audit of the consolidated financial statements that was communicated or required to be communicated to the audit committee and that (i) relates to accounts or disclosures that are material to the consolidated financial statements and (ii) involved our especially challenging, subjective, or complex judgments. The communication of critical audit matters does not alter in any way our opinion on the consolidated financial statements, taken as a whole, and we are not, by communicating the critical audit matter below, providing a separate opinion on the critical audit matter or on the accounts or disclosures to which it relates.
Income taxes - Real estate investment trust asset tests
As described in Notes 1 and 14 to the consolidated financial statements, the Company recorded income tax expense of $124.8 million for the year ended December 31, 2022. The Company has been operating as a real estate investment trust for federal income tax purposes ("REIT") effective January 1, 2015. As a result, the Company may deduct the dividends made to its stockholders from taxable income generated by the Company and its qualified REIT subsidiaries ("QRSs"). The Company’s qualification and taxation as a REIT depends on its satisfaction of certain asset, income, organizational, distribution, stockholder ownership and other requirements on a continuing basis. The Company’s ability to satisfy quarterly asset tests depends upon its analysis and the fair market values of its REIT and non-REIT assets. For purposes of the quarterly REIT asset tests, management estimates the fair market value of assets within its QRSs and taxable REIT subsidiaries (“TRSs”) using a discounted cash flow approach, by calculating the present value of forecasted future cash flows. Management applies discount rates based on industry benchmarks relative to the market and forecasting risks. Other significant assumptions used by management to estimate the fair market value of assets in QRSs and TRSs include projected revenue growth, projected operating margins, and projected capital expenditures. Management revisits significant assumptions periodically to reflect any changes due to the business or economic environment.
The principal considerations for our determination that performing procedures relating to income taxes - REIT asset tests is a critical audit matter are (i) the significant judgment by management when determining the fair market value of REIT and non-REIT assets, which in turn led to a high degree of subjectivity in performing procedures relating to the REIT asset tests, (ii) the significant audit effort and judgment in evaluating audit evidence related to the significant assumptions used in the REIT asset tests related to the discount rates, projected revenue growth, projected operating margins, and projected capital expenditures, and (iii) the audit effort involved the use of professionals with specialized skill and knowledge.
Addressing the matter involved performing procedures and evaluating audit evidence in connection with forming our overall opinion on the consolidated financial statements. These procedures included testing the effectiveness of controls relating to the REIT asset tests, including controls over management's determination of the fair market value of REIT and non-REIT assets. These procedures also included, among others, testing management’s process for estimating the fair market value of the REIT and non-REIT assets; evaluating the appropriateness of the
discounted cash flow approach; testing the completeness and accuracy of underlying data used in the approach; and evaluating the significant assumptions used by management related to the discount rates, projected revenue growth, projected operating margins, and projected capital expenditures. Evaluating management’s assumptions related to projected revenue growth, projected operating margins, and projected capital expenditures involved considering the current and past performance of the Company, economic and industry trends, as well as whether these assumptions were consistent with evidence obtained in other areas of the audit. Professionals with specialized skill and knowledge were used to assist in the evaluation of the Company’s discounted cash flow approach and the discount rate assumptions.
/s/ PricewaterhouseCoopers LLP
San Jose, California
February 17, 2023
We have served as the Company's auditor since 2000.
EQUINIX, INC.
Consolidated Balance Sheets
(in thousands, except share and per share data)
| | | | | | | | | | | |
| December 31, |
| 2022 | | 2021 |
| Assets |
| Current assets: | | | |
| Cash and cash equivalents | $ | 1,906,421 | | | $ | 1,536,358 | |
| | | |
Accounts receivable, net of allowance of $12,225 and $11,635 | 855,380 | | | 681,809 | |
| Other current assets | 459,138 | | | 462,739 | |
| Assets held for sale | 84,316 | | | 276,195 | |
| Total current assets | 3,305,255 | | | 2,957,101 | |
| Property, plant and equipment, net | 16,649,534 | | | 15,445,775 | |
| Operating lease right-of-use assets | 1,427,950 | | | 1,282,418 | |
| Goodwill | 5,654,217 | | | 5,372,071 | |
| Intangible assets, net | 1,897,649 | | | 1,935,267 | |
| Other assets | 1,376,137 | | | 926,066 | |
| Total assets | $ | 30,310,742 | | | $ | 27,918,698 | |
| Liabilities and Stockholders' Equity |
| Current liabilities: | | | |
| Accounts payable and accrued expenses | $ | 1,004,800 | | | $ | 879,144 | |
| Accrued property, plant and equipment | 281,347 | | | 187,334 | |
| Current portion of operating lease liabilities | 139,538 | | | 144,029 | |
| Current portion of finance lease liabilities | 151,420 | | | 147,841 | |
| Current portion of mortgage and loans payable | 9,847 | | | 33,087 | |
| | | |
| Other current liabilities | 251,346 | | | 214,519 | |
| | | |
| Total current liabilities | 1,838,298 | | | 1,605,954 | |
| Operating lease liabilities, less current portion | 1,272,812 | | | 1,107,180 | |
| Finance lease liabilities, less current portion | 2,143,690 | | | 1,989,668 | |
| Mortgage and loans payable, less current portion | 642,708 | | | 586,577 | |
| Senior notes, less current portion | 12,109,539 | | | 10,984,144 | |
| Other liabilities | 797,863 | | | 763,411 | |
| Total liabilities | 18,804,910 | | | 17,036,934 | |
Commitments and contingencies (Note 15) | | | |
| Equinix stockholders' equity: | | | |
Preferred stock, $0.001 par value per share: 100,000,000 shares authorized in 2022 and 2021; zero shares issued and outstanding | — | | | — | |
Common stock, $0.001 par value per share: 300,000,000 shares authorized in 2022 and 2021; 92,813,976 issued and 92,620,703 outstanding in 2022 and 90,872,826 issued and 90,571,406 outstanding in 2021 | 93 | | | 91 | |
| Additional paid-in capital | 17,320,017 | | | 15,984,597 | |
Treasury stock, at cost; 193,273 shares in 2022 and 301,420 shares in 2021 | (71,966) | | | (112,208) | |
| Accumulated dividends | (7,317,570) | | | (6,165,140) | |
| Accumulated other comprehensive loss | (1,389,446) | | | (1,085,751) | |
| Retained earnings | 2,964,838 | | | 2,260,493 | |
| Total Equinix stockholders' equity | 11,505,966 | | | 10,882,082 | |
| Non-controlling interests | (134) | | | (318) | |
| Total stockholders' equity | 11,505,832 | | | 10,881,764 | |
| Total liabilities and stockholders' equity | $ | 30,310,742 | | | $ | 27,918,698 | |
See accompanying notes to consolidated financial statements.
EQUINIX, INC.
Consolidated Statements of Operations
(in thousands, except per share data)
| | | | | | | | | | | | | | | | | |
| Years Ended December 31, |
| 2022 | | 2021 | | 2020 |
| Revenues | $ | 7,263,105 | | | $ | 6,635,537 | | | $ | 5,998,545 | |
| Costs and operating expenses: | | | | | |
| Cost of revenues | 3,751,501 | | | 3,472,422 | | | 3,074,340 | |
| Sales and marketing | 786,560 | | | 741,232 | | | 718,356 | |
| General and administrative | 1,498,701 | | | 1,301,797 | | | 1,090,981 | |
| Transaction costs | 21,839 | | | 22,769 | | | 55,935 | |
| Impairment charges | — | | | — | | | 7,306 | |
| (Gain) loss on asset sales | 3,976 | | | (10,845) | | | (1,301) | |
| Total costs and operating expenses | 6,062,577 | | | 5,527,375 | | | 4,945,617 | |
| Income from operations | 1,200,528 | | | 1,108,162 | | | 1,052,928 | |
| Interest income | 36,268 | | | 2,644 | | | 8,654 | |
| Interest expense | (356,337) | | | (336,082) | | | (406,466) | |
| Other income (expense) | (51,417) | | | (50,647) | | | 6,913 | |
| Gain (loss) on debt extinguishment | 327 | | | (115,125) | | | (145,804) | |
| Income before income taxes | 829,369 | | | 608,952 | | | 516,225 | |
| Income tax expense | (124,792) | | | (109,224) | | | (146,151) | |
| Net income | 704,577 | | | 499,728 | | | 370,074 | |
| Net (income) loss attributable to non-controlling interests | (232) | | | 463 | | | (297) | |
| Net income attributable to Equinix | $ | 704,345 | | | $ | 500,191 | | | $ | 369,777 | |
| | | | | |
| Earnings per share ("EPS") attributable to Equinix: | | | | | |
| Basic EPS | $ | 7.69 | | | $ | 5.57 | | | $ | 4.22 | |
| Weighted-average shares for basic EPS | 91,569 | | | 89,772 | | | 87,700 | |
| Diluted EPS | $ | 7.67 | | | $ | 5.53 | | | $ | 4.18 | |
| Weighted-average shares for diluted EPS | 91,828 | | | 90,409 | | | 88,410 | |
See accompanying notes to consolidated financial statements.
EQUINIX, INC.
Consolidated Statements of Comprehensive Income (Loss)
(in thousands)
| | | | | | | | | | | | | | | | | |
| Years Ended December 31, |
| 2022 | | 2021 | | 2020 |
| Net income | $ | 704,577 | | | $ | 499,728 | | | $ | 370,074 | |
| Other comprehensive income (loss), net of tax: | | | | | |
Foreign currency translation adjustment ("CTA") gain (loss), net of tax effects of $0, $0 and $0 | (769,886) | | | (559,969) | | | 548,560 | |
Net investment hedge CTA gain (loss), net of tax effects of $0, $0 and $0 | 425,701 | | | 326,982 | | | (444,553) | |
| | | | | |
Unrealized gain (loss) on cash flow hedges, net of tax effects of $2,248, $(16,980) and $14,521 | 40,543 | | | 60,562 | | | (82,790) | |
Net actuarial gain (loss) on defined benefit plans, net of tax effects of $25, $(14) and $(23) | (101) | | | 57 | | | 85 | |
| Total other comprehensive income (loss), net of tax | (303,743) | | | (172,368) | | | 21,302 | |
| Comprehensive income, net of tax | 400,834 | | | 327,360 | | | 391,376 | |
| Net (income) loss attributable to non-controlling interests | (232) | | | 463 | | | (297) | |
| Other comprehensive (income) loss attributable to non-controlling interests | 48 | | | (15) | | | (57) | |
| Comprehensive income attributable to Equinix | $ | 400,650 | | | $ | 327,808 | | | $ | 391,022 | |
See accompanying notes to consolidated financial statements.
EQUINIX, INC.
Consolidated Statements of Stockholders' Equity and Other Comprehensive Income (Loss)
For the Three Years Ended December 31, 2022
(in thousands, except share data)
| | | | | | | | | | | | | | | | | | | | | | | | | | | | | | | | | | | | | | | | | | | | | | | | | | | | | | | | | | | | | | | | | |
| Common stock | | Treasury stock | | Additional
Paid-in Capital | | Accumulated
Dividends | | AOCI (Loss) | | Retained
Earnings | | Equinix
Stockholders'
Equity | | Non-controlling Interests | | Total Stockholders' Equity |
| Shares | | Amount | | Shares | | Amount | | | | | | | |
| Balance as of December 31, 2019 | 85,700,953 | | | $ | 86 | | | (392,567) | | | $ | (144,256) | | | $ | 12,696,433 | | | $ | (4,168,469) | | | $ | (934,613) | | | $ | 1,391,425 | | | $ | 8,840,606 | | | $ | (224) | | | $ | 8,840,382 | |
| Adjustment from adoption of new accounting standard | — | | | — | | | — | | | — | | | — | | | — | | | — | | | (900) | | | (900) | | | — | | | (900) | |
| Net income | — | | | — | | | — | | | — | | | — | | | — | | | — | | | 369,777 | | | 369,777 | | | 297 | | | 370,074 | |
| Other comprehensive income | — | | | — | | | — | | | — | | | — | | | — | | | 21,245 | | | — | | | 21,245 | | | 57 | | | 21,302 | |
| Issuance of common stock and release of treasury stock for employee equity awards | 758,339 | | | — | | | 64,515 | | | 22,138 | | | 39,979 | | | — | | | — | | | — | | | 62,117 | | | — | | | 62,117 | |
| Issuance of common stock for equity offering | 2,587,500 | | | 3 | | | — | | | — | | | 1,683,103 | | | — | | | — | | | — | | | 1,683,106 | | | — | | | 1,683,106 | |
| Issuance of common stock under ATM Program | 415,512 | | | — | | | — | | | — | | | 298,269 | | | — | | | — | | | — | | | 298,269 | | | — | | | 298,269 | |
Dividend distribution on common stock, $10.64 per share | — | | | — | | | — | | | — | | | — | | | (936,269) | | | — | | | — | | | (936,269) | | | — | | | (936,269) | |
| Settlement of accrued dividends on vested equity awards | — | | | — | | | — | | | — | | | 189 | | | (770) | | | — | | | — | | | (581) | | | — | | | (581) | |
| Accrued dividends on unvested equity awards | — | | | — | | | — | | | — | | | — | | | (13,766) | | | — | | | — | | | (13,766) | | | — | | | (13,766) | |
| Stock-based compensation, net of estimated forfeitures | — | | | — | | | — | | | — | | | 310,384 | | | — | | | — | | | — | | | 310,384 | | | — | | | 310,384 | |
| Balance as of December 31, 2020 | 89,462,304 | | | 89 | | | (328,052) | | | (122,118) | | | 15,028,357 | | | (5,119,274) | | | (913,368) | | | 1,760,302 | | | 10,633,988 | | | 130 | | | 10,634,118 | |
| | | | | | | | | | | | | | | | | | | | | |
| Net income (loss) | — | | | — | | | — | | | — | | | — | | | — | | | — | | | 500,191 | | | 500,191 | | | (463) | | | 499,728 | |
| Other comprehensive income (loss) | — | | | — | | | — | | | — | | | — | | | — | | | (172,383) | | | — | | | (172,383) | | | 15 | | | (172,368) | |
| Issuance of common stock and release of treasury stock for employee equity awards | 772,905 | | | 1 | | | 26,632 | | | 9,910 | | | 67,718 | | | — | | | — | | | — | | | 77,629 | | | — | | | 77,629 | |
| | | | | | | | | | | | | | | | | | | | | |
| Issuance of common stock under ATM Program | 637,617 | | | 1 | | | — | | | — | | | 497,869 | | | — | | | — | | | — | | | 497,870 | | | — | | | 497,870 | |
Dividend distribution on common stock, $11.48 per share | — | | | — | | | — | | | — | | | — | | | (1,030,005) | | | — | | | — | | | (1,030,005) | | | — | | | (1,030,005) | |
| Settlement of accrued dividends on vested equity awards | — | | | — | | | — | | | — | | | — | | | (839) | | | — | | | — | | | (839) | | | — | | | (839) | |
| Accrued dividends on unvested equity awards | — | | | — | | | — | | | — | | | — | | | (15,022) | | | — | | | — | | | (15,022) | | | — | | | (15,022) | |
| Stock-based compensation, net of estimated forfeitures | — | | | — | | | — | | | — | | | 390,653 | | | — | | | — | | | — | | | 390,653 | | | — | | | 390,653 | |
| | | | | | | | | | | | | | | | | | | | | |
| | | | | | | | | | | | | | | | | | | | | |
| | | | | | | | | | | | | | | | | | | | | |
| | | | | | | | | | | | | | | | | | | | | |
| | | | | | | | | | | | | | | | | | | | | |
| | | | | | | | | | | | | | | | | | | | | |
| | | | | | | | | | | | | | | | | | | | | |
| | | | | | | | | | | | | | | | | | | | | |
| | | | | | | | | | | | | | | | | | | | | |
| | | | | | | | | | | | | | | | | | | | | |
| | | | | | | | | | | | | | | | | | | | | |
| | | | | | | | | | | | | | | | | | | | | |
| | | | | | | | | | | | | | | | | | | | | |
| | | | | | | | | | | | | | | | | | | | | |
EQUINIX INC.
Consolidated Statements of Stockholders' Equity and Other Comprehensive Income (Loss) - Continued
For the Three Years Ended December 31, 2022
(in thousands, except share data)
| | | | | | | | | | | | | | | | | | | | | | | | | | | | | | | | | | | | | | | | | | | | | | | | | | | | | | | | | | | | | | | | | |
| | | | | | | | | | | | | AOCI (Loss) | | Retained
Earnings | | Equinix
Stockholders'
Equity | | Non-controlling Interests | | Total Stockholders' Equity |
| Common stock | | Treasury stock | | Additional
Paid-in Capital | | Accumulated
Dividends | | | | | |
| Shares | | Amount | | Shares | | Amount | | | | | | | |
| Balance as of December 31, 2021 | 90,872,826 | | | 91 | | | (301,420) | | | (112,208) | | | 15,984,597 | | | (6,165,140) | | | (1,085,751) | | | 2,260,493 | | | 10,882,082 | | | (318) | | | 10,881,764 | |
| | | | | | | | | | | | | | | | | | | | | |
| Net income | — | | | — | | | — | | | — | | | — | | | — | | | — | | | 704,345 | | | 704,345 | | | 232 | | | 704,577 | |
| Other comprehensive loss | — | | | — | | | — | | | — | | | — | | | — | | | (303,695) | | | — | | | (303,695) | | | (48) | | | (303,743) | |
| Issuance of common stock and release of treasury stock | 780,444 | | | 1 | | | 108,147 | | | 40,242 | | | 90,314 | | | — | | | — | | | — | | | 130,557 | | | — | | | 130,557 | |
| | | | | | | | | | | | | | | | | | | | | |
| Issuance of common stock under ATM Program | 1,160,706 | | | 1 | | | — | | | — | | | 796,017 | | | — | | | — | | | — | | | 796,018 | | | — | | | 796,018 | |
Dividend distribution on common stock, $12.40 per share | — | | | — | | | — | | | — | | | — | | | (1,137,203) | | | — | | | — | | | (1,137,203) | | | — | | | (1,137,203) | |
| Settlement of accrued dividends on vested equity awards | — | | | — | | | — | | | — | | | — | | | (927) | | | — | | | — | | | (927) | | | — | | | (927) | |
| Accrued dividends on unvested equity awards | — | | | — | | | — | | | — | | | — | | | (14,300) | | | — | | | — | | | (14,300) | | | — | | | (14,300) | |
| Stock-based compensation, net of estimated forfeitures | — | | | — | | | — | | | — | | | 449,089 | | | — | | | — | | | — | | | 449,089 | | | — | | | 449,089 | |
| Balance as of December 31, 2022 | 92,813,976 | | | $ | 93 | | | (193,273) | | | $ | (71,966) | | | $ | 17,320,017 | | | $ | (7,317,570) | | | $ | (1,389,446) | | | $ | 2,964,838 | | | $ | 11,505,966 | | | $ | (134) | | | $ | 11,505,832 | |
See accompanying notes to consolidated financial statements.
EQUINIX, INC.
Consolidated Statements of Cash Flows
(in thousands)
| | | | | | | | | | | | | | | | | |
| Years Ended December 31, |
| 2022 | | 2021 | | 2020 |
| Cash flows from operating activities: | | | | | |
| Net income | $ | 704,577 | | | $ | 499,728 | | | $ | 370,074 | |
Adjustments to reconcile net income to net cash provided by operating activities: | | | | | |
| Depreciation | 1,531,453 | | | 1,450,806 | | | 1,224,322 | |
| Stock-based compensation | 403,983 | | | 363,774 | | | 294,952 | |
| Amortization of intangible assets | 204,755 | | | 205,484 | | | 199,047 | |
Amortization of debt issuance costs and debt discounts and premiums | 17,826 | | | 17,135 | | | 15,739 | |
| Provision for credit loss allowance | 7,426 | | | 10,016 | | | 5,069 | |
| Impairment charges | — | | | — | | | 7,306 | |
| (Gain) loss on asset sales | 3,976 | | | (10,845) | | | (1,301) | |
| | | | | |
| (Gain) loss on debt extinguishment | (327) | | | 115,125 | | | 145,804 | |
| Other items | 63,038 | | | 28,717 | | | 16,643 | |
| Changes in operating assets and liabilities: | | | | | |
| Accounts receivable | (153,415) | | | (1,873) | | | 25,412 | |
| Income taxes, net | (7,827) | | | (16,602) | | | (22,641) | |
| Other assets | (52,276) | | | (114,268) | | | (129,817) | |
| Operating lease right-of-use assets | 149,094 | | | 140,590 | | | 153,650 | |
| Operating lease liabilities | (132,831) | | | (177,533) | | | (142,863) | |
| Accounts payable and accrued expenses | 114,600 | | | 64,596 | | | 25,801 | |
| Other liabilities | 109,130 | | | (27,644) | | | 122,629 | |
| Net cash provided by operating activities | 2,963,182 | | | 2,547,206 | | | 2,309,826 | |
| Cash flows from investing activities: | | | | | |
| Purchases of investments | (144,642) | | | (107,533) | | | (127,763) | |
| Sales of investments | 22,073 | | | 4,057 | | | 29,352 | |
| Business acquisitions, net of cash and restricted cash acquired | (964,010) | | | (158,498) | | | (1,180,272) | |
| Real estate acquisitions | (248,276) | | | (201,837) | | | (200,182) | |
| Purchases of other property, plant and equipment | (2,278,004) | | | (2,751,512) | | | (2,282,504) | |
| Proceeds from sale of assets, net of cash transferred | 249,906 | | | 208,585 | | | 334,397 | |
| Net cash used in investing activities | (3,362,953) | | | (3,006,738) | | | (3,426,972) | |
| Cash flows from financing activities: | | | | | |
| | | | | |
| Proceeds from employee equity awards | 81,543 | | | 77,628 | | | 62,118 | |
| Payment of dividends | (1,151,459) | | | (1,042,909) | | | (947,933) | |
| | | | | |
| Proceeds from public offering of common stock, net of issuance costs | 796,018 | | | 497,870 | | | 1,981,375 | |
| Proceeds from senior notes, net of debt discounts | 1,193,688 | | | 3,878,662 | | | 4,431,627 | |
| Proceeds from mortgage and loans payable | 676,850 | | | — | | | 750,790 | |
| Repayment of senior notes | — | | | (1,990,650) | | | (4,363,761) | |
| Repayments of finance lease liabilities | (134,202) | | | (165,539) | | | (115,288) | |
| Repayments of mortgage and loans payable | (587,941) | | | (717,010) | | | (829,466) | |
| Debt extinguishment costs | — | | | (99,185) | | | (111,700) | |
| Debt issuance costs | (17,731) | | | (25,102) | | | (42,236) | |
| | | | | |
| Net cash provided by financing activities | 856,766 | | | 413,765 | | | 815,526 | |
Effect of foreign currency exchange rates on cash, cash equivalents and restricted cash | (98,201) | | | (30,474) | | | 40,702 | |
Net increase (decrease) in cash, cash equivalents and restricted cash | 358,794 | | | (76,241) | | | (260,918) | |
| Cash, cash equivalents and restricted cash at beginning of period | 1,549,454 | | | 1,625,695 | | | 1,886,613 | |
| Cash, cash equivalents and restricted cash at end of period | $ | 1,908,248 | | | $ | 1,549,454 | | | $ | 1,625,695 | |
| Supplemental cash flow information | | | | | |
| Cash paid for taxes | $ | 140,312 | | | $ | 134,411 | | | $ | 143,934 | |
| Cash paid for interest | $ | 430,217 | | | $ | 426,439 | | | $ | 498,408 | |
| | | | | |
| | | | | |
| Cash and cash equivalents | $ | 1,906,421 | | | $ | 1,536,358 | | | $ | 1,604,869 | |
| Current portion of restricted cash included in other current assets | 1,734 | | | 12,188 | | | 11,135 | |
| Non-current portion of restricted cash included in other assets | 93 | | | 908 | | | 9,691 | |
| Total cash, cash equivalents, and restricted cash shown in the consolidated statement of cash flows | $ | 1,908,248 | | | $ | 1,549,454 | | | $ | 1,625,695 | |
| | | | | |
See accompanying notes to consolidated financial statements.
EQUINIX, INC.
NOTES TO CONSOLIDATED FINANCIAL STATEMENTS
1. Nature of Business and Summary of Significant Accounting Policies
Nature of Business
Equinix, Inc. ("Equinix," the "Company," "we," "our," or "us") was incorporated in Delaware on June 22, 1998. Equinix provides colocation space and related offerings. Global enterprises, content providers, financial companies and network service providers rely upon Equinix's insight and expertise to safehouse and connect their most valued information assets. We operate International Business ExchangeTM ("IBX®") data centers, or IBX data centers, across the Americas; Europe, Middle East and Africa ("EMEA") and Asia-Pacific geographic regions where customers directly interconnect with a network ecosystem of partners and customers. More than 2,000 network service providers offer access to the world's internet routes inside our IBX data centers. This access to internet routes provides Equinix customers improved reliability and streamlined connectivity while significantly reducing costs by reaching a critical mass of networks within a centralized physical location. As of December 31, 2022, we operated 236 IBX data centers in 71 markets around the world.
We have been operating as a real estate investment trust for federal income tax purposes ("REIT") effective January 1, 2015. See "Income Taxes" in Note 14 below for additional information.
Basis of Presentation, Consolidation and Foreign Currency
The accompanying consolidated financial statements include the accounts of Equinix and its subsidiaries, including the acquisitions of:
•Three data centers in Mexico acquired from Axtel S.A.B. de C.V ("Axtel") from January 8, 2020;
•Packet Host, Inc. (“Packet”), including its operations and technology, from March 2, 2020;
•12 data center sites across Canada from BCE Inc. ("Bell") from October 1, 2020 and one additional data center site from November 2, 2020;
•Two data center sites in Mumbai, India from GPX India ("GPX India Acquisition") from September 1, 2021;
•Four data centers as well as a subsea cable and terrestrial fiber network in West Africa acquired from MainOne Cable Company ("MainOne") from April 1, 2022; and
•Four data centers in Chile and a data center in Peru acquired from Empresa Nacional De Telecomunicaciones S.A. ("Entel") from May 2, 2022 and August 1, 2022, respectively.
We consolidate all entities that are wholly owned and those entities in which we own less than 100% of the equity but control, including Variable Interest Entities ("VIEs") for which we are the primary beneficiary. Our investment in consolidated VIEs have not been material to our consolidated financial statements as of and for the periods presented. All intercompany accounts and transactions have been eliminated in consolidation. Foreign exchange gains or losses resulting from foreign currency transactions, including intercompany foreign currency transactions, that are anticipated to be repaid within the foreseeable future, are reported within other income (expense) on our accompanying consolidated statements of operations. For additional information on the impact of foreign currencies to our consolidated financial statements, see "Accumulated Other Comprehensive Loss" in Note 12.
Use of Estimates
The preparation of consolidated financial statements in conformity with the accounting principles generally accepted in the United States of America ("GAAP") requires management to make estimates and assumptions that affect the reported amounts of assets and liabilities and disclosure of contingent assets and liabilities at the date of the consolidated financial statements and the reported amounts of revenues and expenses during the reporting period. Actual results could differ from these estimates. On an ongoing basis, we evaluate our estimates, including, but not limited to, those related to the allowance for credit losses, fair values of financial and derivative instruments, intangible assets and goodwill, assets acquired and liabilities assumed from acquisitions, useful lives of intangible assets and property, plant and equipment, leases, asset retirement obligations, other accruals, and income taxes.
EQUINIX, INC.
NOTES TO CONSOLIDATED FINANCIAL STATEMENTS - (Continued)
We base our estimates on historical experience and on various other assumptions that are believed to be reasonable.
Cash, Cash Equivalents and Short-Term Investments
We consider all highly liquid instruments with an original maturity from the date of purchase of 90 days or less to be cash equivalents. Cash equivalents consist of money market mutual funds and certificates of deposit with original maturities up to 90 days. Short-term investments generally consist of certificates of deposit with original maturities of between 90 days and 1 year. Publicly traded equity securities are measured at fair value with changes in the fair values recognized within other income (expense) in our consolidated statements of operations. We review our investment portfolio quarterly to determine if any securities may be other-than-temporarily impaired due to increased credit risk, changes in industry or sector of a certain instrument or ratings downgrades.
Equity Method Investments
We enter into joint venture or partnership arrangements to invest in certain entities for business development objectives. At the inception of these arrangements and if a reconsideration event has occurred, we assess our interests with such entities to determine whether any of the entities meet the definition of a variable interest entity ("VIE"). A VIE is an entity that either (i) has insufficient equity to permit the entity to finance its activities without additional subordinated financial support, or (ii) has equity investors who lack the characteristics of a controlling financial interest. We are required to consolidate the assets and liabilities of VIEs when we are deemed to be the primary beneficiary. The primary beneficiary of a VIE is the entity that meets both of the following criteria: (i) has the power to make decisions that most significantly affect the economic performance of the VIE; and (ii) has the obligation to absorb losses or the right to receive benefits that in either case could potentially be significant to the VIE. For VIEs where we are not the primary beneficiary, and other joint ventures or partnerships that are not VIEs, where we have the ability to exercise significant influence over the entity, we account for those investments under the equity method of accounting.
Equity method investments are initially measured at cost, or at fair value when the investment represents a retained equity interest in a deconsolidated business or derecognized distinct non-financial assets. Equity investments are subsequently adjusted for cash contributions, distributions and our share of the income and losses of the investees. We record our equity method investments in other assets in the consolidated balance sheet. Our proportionate shares of the income or loss from our equity method investments are recorded in other income in the consolidated statement of operations.
We review our investments quarterly to determine if any investments may be impaired considering both qualitative and quantitative factors that may have a significant impact on the investees' fair value. We did not record any impairment charges related to our equity method investments for the years ended December 31, 2022, 2021 and 2020. For further information on our Equity Method Investments, see Note 6.
Non-marketable Equity Investments
We also have investments in non-marketable equity securities, where we do not have the ability to exercise significant influence over the investees. We elected the measurement alternative under which the securities are measured at cost minus impairment, if any, and adjusted for changes resulting from qualifying observable price changes. We record non-marketable equity investment in other assets in the consolidated balance sheet. We review our non-marketable equity investments quarterly to determine if any investments may be impaired considering both qualitative and quantitative factors that may have a significant impact on the investees' fair value. We did not record any impairment charges related to our non-marketable equity investments for the years ended December 31, 2022, 2021 and 2020.
Financial Instruments and Concentration of Credit Risk
Financial instruments which potentially subject us to concentrations of credit risk consist of cash and cash equivalents, short-term investments and accounts receivable. Risks associated with cash and cash equivalents and short-term investments are mitigated by our investment policy, which limits our investing to only those marketable securities rated at least A-1/P-1 Short Term Rating or A-/A3 Long Term Rating, as determined by independent credit rating agencies.
EQUINIX, INC.
NOTES TO CONSOLIDATED FINANCIAL STATEMENTS - (Continued)
A significant portion of our customer base is comprised of businesses throughout the Americas. However, a portion of our revenues are derived from our EMEA and Asia-Pacific operations. The following table sets forth percentages of our revenues by geographic region for the years ended December 31:
| | | | | | | | | | | | | | | | | |
| 2022 | | 2021 | | 2020 |
| Americas | 46 | % | | 46 | % | | 45 | % |
| EMEA | 32 | % | | 32 | % | | 33 | % |
| Asia-Pacific | 22 | % | | 22 | % | | 22 | % |
For further information on segment information, see Note 17.
Property, Plant and Equipment
Property, plant and equipment are stated at our original cost or initial fair value for property, plant and equipment acquired through acquisitions, net of depreciation. Depreciation is computed using the straight-line method over the estimated useful lives of the respective assets. Buildings under finance leases, Leasehold improvements and integral equipment at leased locations are amortized over the shorter of the lease term or the estimated useful life of the asset or improvement.
We capitalize certain internal and external costs associated with the development and purchase of internal-use software in property, plant and equipment, net on the consolidated balance sheets. This includes costs incurred in cloud computing arrangements ("CCA"), where it is both feasible and contractually permissible without significant penalty for us to take possession of the software. All other CCAs are considered service contracts, and the licensing and implementation costs incurred associated with such contracts are capitalized in other assets on the consolidated balance sheets. Capitalized internal-use software costs and capitalized implementation costs are amortized on a straight-line basis over the estimated useful lives of the software or arrangements.
Our estimated useful lives of property, plant and equipment are generally as follows:
| | | | | | | | | | | |
| Core systems | 3 | - | 40 years |
| Buildings | 12 | - | 60 years |
| Leasehold improvements | 12 | - | 40 years |
| Personal Property, including capitalized internal-use software | 3 | - | 10 years |
Our construction in progress includes direct and indirect expenditures for the construction and expansion of IBX data centers and is stated at original cost. We contracted out substantially all of the construction and expansion efforts of our IBX data centers to independent contractors under construction contracts. Construction in progress includes costs incurred under construction contracts including project management services, engineering and schematic design services, design development, construction services and other construction-related fees and services. In addition, we capitalized interest costs during the construction phase. Once an IBX data center or expansion project becomes operational, these capitalized costs are allocated to certain property, plant and equipment categories and are depreciated over the estimated useful lives of the underlying assets.
We review our property, plant and equipment for impairment whenever events or changes in circumstances indicate that the carrying amount of an asset or an asset group may not be recoverable, such as a significant decrease in market price of an asset, a significant adverse change in the extent or manner in which an asset or an asset group is being used or its physical condition, a significant adverse change in legal factors or business climate that could affect the value of an asset or an asset group or a continuous deterioration of our financial condition. Recoverability of assets or asset groups to be held and used is assessed by comparing the carrying amount of an asset or an asset group to estimated undiscounted future net cash flows expected to be generated by the asset or the asset group. If the carrying amount of the asset or the asset group exceeds its estimated undiscounted future cash flows, an impairment charge is recognized in the amount by which the carrying amount of the asset or the asset group exceeds the fair value of the asset. We did not record any impairment charges related to our property, plant and equipment during the years ended December 31, 2022, 2021 and 2020.
EQUINIX, INC.
NOTES TO CONSOLIDATED FINANCIAL STATEMENTS - (Continued)
We enter into non-cancellable lease arrangements as the lessee primarily for our data center spaces, office spaces and equipment. Assets acquired through finance leases are included in property, plant and equipment, net on the consolidated balance sheets. In addition, a portion of our property, plant and equipment are used for revenue arrangements which are accounted for as operating leases where we are the lessor.
Assets Held for Sale
Assets and liabilities to be disposed of that meet all of the criteria to be classified as held for sale are reported at the lower of their carrying amounts or fair values less costs to sell. We recorded an impairment charge of $7.3 million relating to assets held for sale for the year ended December 31, 2020. Assets are not depreciated or amortized while they are classified as held for sale. For further information on our assets held for sale, see Note 5.
Asset Retirement Costs and Asset Retirement Obligations
Our asset retirement obligations are primarily related to our IBX data centers, of which the majority are leased under long-term arrangements and are required to be returned to the landlords in their original condition. The majority of our IBX data center leases have been subject to significant development by us in order to convert them from, in most cases, vacant buildings or warehouses into IBX data centers. The fair value of a liability for an asset retirement obligation is recognized in the period in which it is incurred. The associated retirement costs are capitalized and included as part of the carrying value of the long-lived asset and amortized over the useful life of the asset. Subsequent to the initial measurement, we accrete the liability in relation to the asset retirement obligations over time and the accretion expense is recorded as a cost of revenue. For further information on our asset retirement obligations, see Note 7.
Goodwill and Other Intangible Assets
We have three reportable segments comprised of the 1) Americas, 2) EMEA and 3) Asia-Pacific geographic regions, which we also determined are our reporting units. Goodwill is not amortized and is tested for impairment at least annually or more often if and when circumstances indicate that goodwill is not recoverable.
We assess qualitative factors to determine whether it is more likely than not that the fair value of a reporting unit is less than its carrying value. Qualitative factors considered in the assessment include industry and market conditions, overall financial performance, and other relevant events and factors affecting the reporting unit. If, after assessing the qualitative factors, we determine that it is not more likely than not that the fair value of a reporting unit is less than its carrying value, then performing a quantitative impairment test is unnecessary. However, if we conclude otherwise, then we are required to perform a quantitative goodwill impairment test. The quantitative impairment test, which is used to identify both the existence of impairment and the amount of impairment loss, compares the fair value of a reporting unit with its carrying amount, including goodwill. If the fair value of a reporting unit exceeds its carrying amount, goodwill of the reporting unit is not considered impaired. If the carrying value of the reporting unit exceeds its fair value, any excess of the reporting unit goodwill carrying value over the respective implied fair value is recognized as an impairment loss.
As of December 31, 2022, 2021 and 2020, we concluded that it was more likely than not that goodwill attributed to our Americas, EMEA and Asia-Pacific reporting units was not impaired as the fair value of each reporting unit exceeded the carrying value of its respective reporting unit, including goodwill.
Substantially all of our intangible assets are subject to amortization and are amortized using the straight-line method over their estimated period of benefit. We perform a review of intangible assets for impairment by assessing events or changes in circumstances that indicate the carrying amount of an asset may not be recoverable. Recoverability of assets to be held and used is assessed by comparing the carrying amount of an asset to estimated undiscounted future net cash flows expected to be generated by the asset. If the carrying amount of the asset exceeds its estimated undiscounted future cash flows, an impairment charge is recognized by the amount by which the carrying amount of the asset exceeds the fair value of the asset. We did not record any impairment charges related to our other intangible assets during the years ended December 31, 2022, 2021 and 2020. For further information on goodwill and other intangible assets, see Note 3 and Note 7 below.
EQUINIX, INC.
NOTES TO CONSOLIDATED FINANCIAL STATEMENTS - (Continued)
Debt Issuance Costs
Costs and fees incurred upon debt issuances are capitalized and are amortized over the life of the related debt based on the effective interest method. Such amortization is included as a component of interest expense. Debt issuance costs related to outstanding debt are presented as a reduction of the carrying amount of the debt obligation and debt issuance costs related to the revolving credit facility are presented as other assets. For further information on debt facilities, see Note 11 below.
Derivatives and Hedging Activities
We utilize foreign currency and interest rate derivative instruments as part of our risk management strategy. Foreign currency derivatives help to mitigate the effects of foreign exchange rate fluctuations on (i) our expected revenues and expenses in the EMEA region, (ii) investments in our foreign operations and (iii) certain monetary assets and liabilities denominated in foreign currencies. Interest rate derivatives, on the other hand, are used to manage the interest rate risk associated with anticipated fixed-rate debt issuances.
These measures allow us to effectively control our financial exposure and are not used for speculative purposes. We recognize all derivatives on our consolidated balance sheets at fair value. The accounting for changes in the value of a derivative depends on whether the contract qualifies and has been designated for hedge accounting. In order to qualify for hedge accounting, a derivative must be considered highly effective at reducing the risk associated with the exposure being hedged and there must be documentation of the risk management objective and strategy, including identification of the hedging instrument, the hedged item and the risk exposure, and the effectiveness assessment methodology. Hedge designations are reviewed on a quarterly basis to assess whether circumstances have changed that would disrupt the hedge instrument's relationship to the forecasted transactions or net investment.
Cash Flow Hedges
The instruments we designate as cash flow hedges include foreign currency forwards and options, cross-currency swaps as well as interest rate locks. For cash flow hedges, we use a regression analysis at the time they are designated to assess their effectiveness.
We use foreign currency forwards and options to hedge our foreign currency transaction exposure for forecasted revenues and expenses in our EMEA region between the U.S. Dollar and the British Pound, Euro, Swedish Krona, and Swiss Franc. We use the forward method to assess effectiveness of qualifying foreign currency forwards that are designated as cash flow hedges, whereby, the change in the fair value of the derivative is recorded in other comprehensive income (loss) and reclassified to the same line item in the consolidated statement of operations that is used to present the earnings effect of the hedged item when the hedged item affects earnings. We use the spot method to assess effectiveness of qualifying foreign currency exchange options that are designated as cash flow hedges, whereby, the change in fair value due to foreign currency exchange spot rates is recorded in other comprehensive income (loss) and reclassified to the same line item in the consolidated statement of operations that is used to present the earnings effect of the hedged item when the hedged item affects earnings, and the change in fair value of the excluded component is recorded in other comprehensive income (loss) and amortized on a straight-line basis to the same line item in the consolidated statement of operations that is used to present the earnings effect of the hedged item. When two or more derivative instruments in combination are jointly designated as a cash flow hedging instrument, as with foreign currency exchange option collars, they are treated as a single instrument. If the hedge relationship is terminated for any derivatives designated as cash flow hedges, then the change in fair value of the derivative recorded in other comprehensive income (loss) is recognized in earnings when the previously hedged item affects earnings, consistent with the original hedge strategy.
We also utilize cross-currency interest rate swaps, which we designate as cash flow hedges, to manage the foreign currency exposure associated with a portion of our foreign currency-denominated debt. We assess the effectiveness of cross-currency interest rate swaps that are designated as cash flow hedges using the spot method. The fair value changes are recorded in other comprehensive income (loss), and when the hedged item impacts earnings, the change in fair value due to foreign currency exchange spot rates is reclassified to the corresponding line item in the consolidated statement of operations.
We use interest rate derivative instruments such as treasury locks and swap locks, collectively referred to as "interest rate locks", to manage interest rate exposure created by anticipated fixed rate debt issuances. An interest
EQUINIX, INC.
NOTES TO CONSOLIDATED FINANCIAL STATEMENTS - (Continued)
rate lock is a synthetic forward sale of a benchmark interest rate, which is settled in cash based upon the difference between an agreed upon rate at inception and the prevailing benchmark rate at settlement. It effectively fixes the benchmark rate component of an upcoming debt issuance. The interest rate lock transactions are designated as cash flow hedges, with all changes in value reported in other comprehensive income (loss). Subsequent to settlement, amounts in other comprehensive income are amortized to interest expense over the term of the interest rate locks.
For hedge relationships that are discontinued because the forecasted transaction is not expected to occur according to the original strategy, any related derivative amounts recorded in other comprehensive income (loss) are immediately recognized in earnings.
Net Investment Hedges
We employ cross-currency swaps, which we designate as net investment hedges, to hedge the currency exposure associated with our net investment in our foreign subsidiaries. We use the spot method to assess effectiveness of cross-currency interest rate swaps that are designated as net investment hedges, whereby, the change in fair value due to foreign currency exchange spot rates is recorded in other comprehensive income (loss) and the change in fair value of the excluded component is recorded in other comprehensive income (loss) and amortized to interest expense on a straight-line basis.
Occasionally, we also use foreign exchange forward contracts, which we designate as net investment hedges, to hedge against the effect of foreign exchange rate fluctuations on a portion of our net investment in the foreign subsidiaries. We use the spot method to assess effectiveness of qualifying foreign currency forwards that are designated as net investment hedges, whereby, the change in fair value due to foreign currency exchange spot rates is recorded in other comprehensive income (loss) and the change in fair value of the excluded component is recorded in other comprehensive income (loss) and amortized to interest expense on a straight-line basis.
Non-designated Hedges
Foreign currency gains or losses associated with derivatives that are not designated as hedging instruments for accounting purposes are recorded within other income (expense) in our consolidated statements of operations, with the exception of (i) foreign currency embedded derivatives contained in certain of our customer contracts and (ii) foreign exchange forward contracts that are entered into to hedge the accounting impact of the foreign currency embedded derivatives, which are recorded within revenues in our consolidated statements of operations. For further information on derivatives and hedging activities, see Note 8 below.
Fair Value of Financial Instruments
The carrying value of our cash and cash equivalents, short-term investments and derivative instruments represent their fair value, while our accounts receivable, accounts payable and accrued expenses and accrued property, plant and equipment approximate their fair value due primarily to the short-term maturity of the related instruments. The fair value of our debt, which is traded in the public debt market, is based on quoted market prices. The fair value of our debt, which is not publicly traded, is estimated by considering our credit rating, current rates available to us for debt of the same remaining maturities and terms of the debt.
Fair Value Measurements
We measure and report certain financial assets and liabilities at fair value on a recurring basis, including our investments in money market funds, certificates of deposit, publicly traded equity securities and derivatives.
We also follow the accounting standard for the measurement of fair value for non-financial assets and liabilities on a nonrecurring basis. These include:
•Non-financial assets and non-financial liabilities initially measured at fair value in a business combination or other new basis event, but not measured at fair value in subsequent reporting periods;
•Reporting units and non-financial assets and non-financial liabilities measured at fair value for goodwill impairment tests;
•Indefinite-lived intangible assets measured at fair value for impairment assessments;
EQUINIX, INC.
NOTES TO CONSOLIDATED FINANCIAL STATEMENTS - (Continued)
•Non-financial long-lived assets or asset groups measured at fair value for impairment assessments or disposal;
•Asset retirement obligations initially measured at fair value but not subsequently measured at fair value; and
•Assets and liabilities classified as held for sale are measured at fair value less costs to sell and reported at the lower of the carrying amounts or the fair values less costs to sell.
For further information on fair value measurements, see Note 5 and Note 9 below.
Leases
We enter into lease arrangements primarily for land, data center spaces, office spaces and equipment. At its inception, we determine whether an arrangement is or contains a lease. We recognize a right-of-use ("ROU") asset and lease liability on the consolidated balance sheet for all leases with a term longer than 12 months, including renewals options that we are reasonably certain to exercise.
ROU assets represent our right to use an underlying asset for the lease term. Lease liabilities represent our obligation to make lease payments arising from the lease. ROU assets and liabilities are classified and recognized at the commencement date. When there is a lease modification, including a change in lease term, we reassess its classification and remeasure the ROU asset and lease liability.
ROU lease liabilities are measured based on the present value of fixed lease payments over the lease term. ROU assets consist of (i) initial measurement of the lease liability; (ii) lease payments made to the lessor at or before the commencement date less any lease incentives received; and (iii) initial direct costs incurred by us. Lease payments may vary because of changes in facts or circumstances occurring after the commencement, including changes in inflation indices. Variable lease payments that depend on an index or a rate (such as the Consumer Price Index or a market interest rate) are included in the measurement of ROU assets and lease liabilities using the index or rate at the commencement date. Subsequent changes to lease payments based on changes to the index and rate are accounted for as variable lease payments and recognized in the period they are incurred. Variable lease payments that do not depend on an index or a rate are excluded from the measurement of ROU assets and lease liabilities and are recognized in the period in which the obligation for those payments is incurred. Since most of our leases do not provide an implicit rate, we use our own incremental borrowing rate ("IBR") on a collateralized basis in determining the present value of lease payments. We utilize a market-based approach to estimate the IBR. The approach requires significant judgment. Therefore, we utilize different data sets to estimate IBRs via an analysis of (i) sovereign rates; (ii) yields on our outstanding public debt; and (iii) indicative pricing on both secured and unsecured debt received from banking partners. We also apply adjustments to account for considerations related to (i) tenor; and (ii) country credit rating that may not be fully incorporated by the aforementioned data sets.
The majority of our lease arrangements include options to extend the lease. If we are reasonably certain to exercise such options, the periods covered by the options are included in the lease term. The depreciable lives of certain fixed assets and leasehold improvements are limited by the expected lease term. We have certain leases with a term of 12 months or less. For such leases, we elected not to recognize any ROU asset or lease liability on the consolidated balance sheet. We have lease agreements with lease and non-lease components. We elected to account for the lease and non-lease components as a single lease component for all classes of underlying assets for which we have identified as lease arrangements. For further information on leases, see Note 10 below.
Revenue
Revenue Recognition
Equinix derives more than 90% of its revenues from recurring revenue streams, consisting primarily of (1) colocation, which includes the licensing of cabinet space and power; (2) interconnection offerings; (3) managed infrastructure solutions and (4) other revenues consisting of rental income from tenants or subtenants. The remainder of our revenues are from non-recurring revenue streams, such as installation revenues, professional services, contract settlements and equipment sales. Revenues by service lines and geographic areas are included in segment information. For further information on segment information, see Note 17 below.
Revenues are recognized when control of these products and services is transferred to its customers, in an amount that reflects the consideration it expects to be entitled to in exchange for the products and services. Revenues from recurring revenue streams are generally billed monthly and recognized ratably over the term of the
EQUINIX, INC.
NOTES TO CONSOLIDATED FINANCIAL STATEMENTS - (Continued)
contract, generally 1 to 3 years for IBX data center colocation customers. Non-recurring installation fees, although generally paid upfront upon installation, are deferred and recognized ratably over the contract term. Professional service fees and equipment sales are recognized in the period when the services were provided. For the contracts with customers that contain multiple performance obligations, we account for individual performance obligations separately if they are distinct or as a series of distinct obligations if the individual performance obligations meet the series criteria. Determining whether products and services are considered distinct performance obligations that should be accounted for separately versus together may require significant judgment. The transaction price is allocated to the separate performance obligation on a relative standalone selling price basis. The standalone selling price is determined based on overall pricing objectives, taking into consideration market conditions, geographic locations and other factors. Other judgments include determining if any variable consideration should be included in the total contract value of the arrangement such as price increases.
Revenue is generally recognized on a gross basis as a principal versus on a net basis as an agent, as we are primarily responsible for fulfilling the contract, bear inventory risk and have discretion in establishing the price when selling to the customer. To the extent we do not meet the criteria for recognizing revenue on a gross basis, we record the revenue on a net basis. Revenue from contract settlements, when a customer wishes to terminate their contract early, is treated as a contract modification and recognized ratably over the remaining term of the contract, if any.
We guarantee certain service levels, such as uptime, as outlined in individual customer contracts. If these service levels are not achieved due to any failure of the physical infrastructure or offerings, or in the event of certain instances of damage to customer infrastructure within our IBX data centers, we would reduce revenue for any credits or cash payments given to the customer. Historically, these credits and cash payments have not been significant.
We enter into revenue contracts with customers for data centers and office spaces, which contain both lease and non-lease components. We elected to adopt the practical expedient which allows lessors to combine lease and non-lease components, by underlying class of asset, and account for them as one component if they have the same timing and pattern of transfer. The combined component is accounted for in accordance with the current lease accounting guidance ("Topic 842") if the lease component is predominant, and in accordance with Topic 606 if the non-lease component is predominant. In general, customer contracts for data centers are accounted for under Topic 606 and customer contracts for the use of office space are accounted for under Topic 842, which are generally classified as operating leases and are recognized on a straight-line basis over the lease term.
Certain customer agreements are denominated in currencies other than the functional currencies of the parties involved. Under applicable accounting rules, we are deemed to have foreign currency forward contracts embedded in these contracts. We assessed these embedded contracts and concluded them to be foreign currency embedded derivatives (see Note 8). These instruments are separated from their host contracts and held on our consolidated balance sheet at their fair value. The majority of these foreign currency embedded derivatives arise in certain of our subsidiaries where the local currency is the subsidiary's functional currency and the customer contract is denominated in the U.S. dollar. Changes in their fair values are recognized within revenues in our consolidated statements of operations.
Contract Balances
The timing of revenue recognition, billings and cash collections result in accounts receivables, contract assets and deferred revenues. A receivable is recorded at the invoice amount, net of an allowance for credit losses and is recognized in the period when we have transferred products or provided services to our customers and when its right to consideration is unconditional. Payment terms and conditions vary by contract type, although terms generally include a requirement of payment within 30 to 45 days. In instances where the timing of revenue recognition differs from the timing of invoicing, we have determined that our contracts generally do not include a significant financing component. We assess collectability based on a number of factors, including past transaction history with the customer and the credit-worthiness of the customer. We generally do not request collateral from our customers although in certain cases we obtain a security interest in a customer's equipment placed in our IBX data centers or obtain a deposit. We also maintain an allowance for estimated losses on a lifetime loss basis resulting from the inability of our customers to make required payments for which we had expected to collect the revenues in accordance with the credit loss guidance accounting guidance ("Topic 326"). If the financial condition of our customers were to deteriorate or if they became insolvent, resulting in an impairment of their ability to make payments, greater allowances for credit losses may be required. Management specifically analyzes current
EQUINIX, INC.
NOTES TO CONSOLIDATED FINANCIAL STATEMENTS - (Continued)
economic news, conditions and trends, historical loss rates, customer concentrations, customer credit-worthiness, changes in customer payment terms and any applicable long term forecast when evaluating revenue recognition and the adequacy of our reserves for our accounts receivable. Any amounts that were previously recognized as revenue and subsequently determined to be uncollectable are charged to bad debt expense included in sales and marketing expense in the consolidated statements of operations. A specific bad debt reserve of up to the full amount of a particular invoice value is provided for certain problematic customer balances. An additional reserve is established for all other accounts based on an analysis of historical credits issued. Delinquent account balances are written off after management has determined that the likelihood of collection is not probable.
A contract asset exists when we have transferred products or provided services to our customers but customer payment is conditioned on reasons other than the passage of time, such as upon the satisfaction of additional performance obligations. Certain contracts include terms related to price arrangements such as price increases and free months. We recognize revenues ratably over the contract term, which could potentially give rise to contract assets during certain periods of the contract term. Contract assets are recorded in other current assets and other assets in the consolidated balance sheet.
Deferred revenue (a contract liability) is recognized when we have an unconditional right to a payment before we transfer the products or services to customers. Deferred revenue is included in other current liabilities and other liabilities, respectively, in the consolidated balance sheet.
Contract Costs
Direct and indirect incremental costs solely related to obtaining revenue contracts are capitalized as costs of obtaining a contract, when they are incremental and if they are expected to be recovered. Such costs consist primarily of commission fees and sales bonuses, as well as indirect related payroll costs. In 2022, contract costs were amortized over the estimated period of 5.5 years on a straight-line basis. We elected to apply the practical expedient which allows us to expense contract costs when incurred, if the amortization period is one year or less.
For further information on revenue recognition, see Note 2 below.
Income Taxes
Income taxes are accounted for under the asset and liability method. Under this method, deferred tax assets and liabilities are recognized based on the future tax consequences attributable to differences that exist between the financial statement carrying amounts of assets and liabilities and their respective tax bases, as well as tax attributes such as operating loss, capital loss and tax credits carryforwards on a taxing jurisdiction basis. Deferred tax assets and liabilities are measured using enacted tax rates expected to apply to taxable income in the year in which those temporary differences are expected to be recovered or settled. The effect on deferred tax assets and liabilities of a change in tax rates is recognized in income in the period that includes the enactment date. Valuation allowances are established when necessary to reduce deferred tax assets to the amounts that are expected more likely than not to be realized in the future. A tax benefit from an uncertain income tax position may be recognized in the financial statements only if it is more likely than not that the position is sustainable, based solely on its technical merits and consideration of the relevant taxing authority's widely understood administrative practices and precedents. Recognized income tax positions are measured at the largest amount that has a greater than 50 percent likelihood of being realized. Any subsequent changes in recognition or measurement are reflected in the period in which the change in judgment occurs.
We elected to be taxed as a REIT for U.S. federal income tax purposes beginning with our 2015 taxable year. As a result, we may deduct the dividends made to our stockholders from taxable income generated by us and that of our qualified REIT subsidiaries ("QRSs"). Our dividends paid deduction generally eliminates the U.S. federal taxable income of our REIT and QRSs, resulting in no U.S. federal income tax due. However, our domestic taxable REIT subsidiaries ("TRSs") are subject to the U.S. corporate income taxes on any taxable income generated by them. In addition, our foreign operations are subject to local income taxes regardless of whether the foreign operations are operated as QRSs or TRSs.
Our qualification and taxation as a REIT depend on our satisfaction of certain asset, income, organizational, distribution, stockholder ownership and other requirements on a continuing basis. Our ability to satisfy quarterly asset tests depends upon our analysis and the fair market values of our REIT and non-REIT assets. For purposes of the quarterly REIT asset tests, we estimate the fair market value of assets within our QRSs and TRSs using a
EQUINIX, INC.
NOTES TO CONSOLIDATED FINANCIAL STATEMENTS - (Continued)
discounted cash flow approach, by calculating the present value of forecasted future cash flows. We apply discount rates based on industry benchmarks relative to the market and forecasting risks. Other significant assumptions used to estimate the fair market value of assets in QRSs and TRSs include projected revenue growth, projected operating margins, and projected capital expenditures. We revisit significant assumptions periodically to reflect any changes due to business or economic environment.
For further information on income taxes, see Note 14 below.
Stock-Based Compensation
Stock-based compensation cost is measured at the grant date for all stock-based awards made to employees and directors based on the fair value of the award. We generally recognize stock-based compensation expense on a straight-line basis over the requisite service period of the awards, which is generally the vesting period. However, for awards with market conditions or performance conditions, stock-based compensation expense is recognized on a straight-line basis over the requisite service period for each vesting tranche of the award. We elected to estimate forfeitures based on historical forfeiture rates.
We grant restricted stock units ("RSUs") or restricted stock awards ("RSAs") to our employees and these equity awards generally have only a service condition. We grant RSUs to our executives that generally have a service and performance condition or a service and market condition. Performance conditions contained in an equity award are generally tied to our financial performance. We assess the probability of meeting these performance conditions on a quarterly basis. The majority of our RSUs vest over four years, although certain equity awards for executives vest over a range of two to four years. Our RSAs vest over three years. The valuation of RSUs and RSAs with only a service condition or a service and performance condition requires no significant assumptions as the fair value for these types of equity awards is based solely on the fair value of our stock price on the date of grant. We use a Monte Carlo simulation option-pricing model to determine the fair value of RSUs with a service and market condition.
We use the Black-Scholes option-pricing model to determine the fair value of our employee stock purchase plan ("ESPP"). The determination of the fair value of shares purchased under the ESPP is affected by assumptions regarding a number of complex and subjective variables including our expected stock price volatility over the term of the awards and actual and projected employee stock purchase behaviors. We estimated the expected volatility by using the average historical volatility of its common stock that it believed was best representative of future volatility. The risk-free interest rate used was based on U.S. Treasury zero-coupon issues with remaining terms similar to the expected term of the equity awards. The expected dividend rate used was based on average dividend yields and the expected term used was equal to the term of each purchase window.
The accounting standard for stock-based compensation does not allow the recognition of unrealized tax benefits associated with the tax deductions in excess of the compensation recorded (excess tax benefit) until the excess tax benefit is realized (i.e., reduces taxes payable). We record the excess tax benefits from stock-based compensation as income tax expense through the statement of operations. For further information on stock-based compensation, see Note 13 below.
Foreign Currency Translation
The financial position of foreign subsidiaries is translated using the exchange rates in effect at the end of the period, while income and expense items are translated at average exchange rates during the period. Gains or losses from translation of foreign operations where the local currency is the functional currency are included as other comprehensive income (loss). The net gains and losses resulting from foreign currency transactions are recorded in net income in the period incurred and recorded within other income (expense). Certain inter-company balances are designated as loans of a long-term investment-type nature. Accordingly, exchange gains and losses associated with these long-term inter-company balances are recorded as a component of other comprehensive income (loss), along with translation adjustments.
Earnings Per Share
We compute basic and diluted EPS for net income. Basic EPS is computed using net income and the weighted-average number of common shares outstanding. Diluted EPS is computed using net income and the weighted-average number of common shares outstanding plus any dilutive potential common shares outstanding. Dilutive
EQUINIX, INC.
NOTES TO CONSOLIDATED FINANCIAL STATEMENTS - (Continued)
potential common shares include the assumed exercise, vesting and issuance activity of employee equity awards using the treasury stock method. For further information on earnings per share, see Note 4 below.
Treasury Stock
We account for treasury stock under the cost method. When treasury stock is re-issued at a higher price than its cost, the difference is recorded as a component of additional paid-in capital to the extent that there are gains to offset the losses. If there are no treasury stock gains in additional paid-in capital, the losses are recorded as a component of retained earnings.
Recent Accounting Pronouncements
Accounting Standards Not Yet Adopted
In September 2022, the Financial Accounting Standards Board ("FASB") issued Accounting Standards Update ("ASU") 2022-04, "Liabilities-Supplier Finance Programs (Subtopic 405-50): Disclosure of Supplier Finance Program Obligations". This guidance requires annual and interim disclosures for entities that use supplier finance programs in connection with the purchase of goods and services. The ASU is effective for fiscal years beginning after December 15, 2022, with early adoption permitted, except for the amendment on rollforward information, which is effective for fiscal years beginning after December 15, 2023. We do not expect the adoption of this standard to have a significant impact on our consolidated financial statements.
Accounting Standards Recently Adopted
Financial Instruments - Credit Losses
In June 2016, FASB issued ASU 2016-13, Financial Instruments - Credit Losses ("Topic 326"): Measurement of Credit Losses on Financial Instruments. The ASU requires the measurement of all expected credit losses for financial assets held at the reporting date based on historical experience, current conditions, and reasonable and supportable forecasts. The ASU requires enhanced qualitative and quantitative disclosures to help investors and other financial statement users better understand significant estimates and judgments used in estimating credit losses, as well as the credit quality and underwriting standards of an organization's portfolio. The ASU is effective for fiscal years, and interim periods within those fiscal years, beginning after December 15, 2019, with early adoption permitted. We adopted this new ASU on January 1, 2020 using the modified retrospective approach and recorded a net decrease to retained earnings of $0.9 million and a corresponding increase to allowance for credit losses. The adoption did not have a significant impact on other financial assets within the scope of Topic 326, such as contract assets.
Reference Rate Reform
In March 2020, FASB issued ASU 2020-04, Reference Rate Reform ("Topic 848"): Facilitation of the Effects of Reference Rate Reform on Financial Reporting. In addition, FASB issued ASU 2021-01, Reference Rate Reform ("Topic 848"), which clarifies the scope of Topic 848. Collectively, the guidance provides optional expedients and exceptions for applying GAAP to contracts, hedging relationships, and other transactions affected by reference rate reform if certain criteria are met. ASU 2021-01 is effective upon issuance and ASU 2020-04 was effective for all entities as of March 12, 2020, and together remained effective through December 31, 2022. In December 2022, FASB issued ASU 2022-06, Reference Rate Reform ("Topic 848"): Deferral of the Sunset Date of Topic 848. Because the current relief in Topic 848 may not cover a period of time during which a significant number of modifications may take place, the amendments in this Update defer the sunset date of Topic 848 from December 31, 2022 to December 31, 2024, after which entities will no longer be permitted to apply the relief in Topic 848. We adopted these ASUs upon their respective issuances and there was no impact on our consolidated financial statements as a result of adopting the guidance. We will evaluate our debt, derivative and lease contracts that may become eligible for modification relief and may apply the elections prospectively as needed.
Income Taxes
In December 2019, FASB issued ASU 2019-12, Income Taxes ("Topic 740"): Simplifying the Accounting for Income Taxes. The ASU simplifies accounting for income taxes by removing certain exceptions to the general principles in Topic 740. The ASU also improves consistent application of and simplifies generally accepted
EQUINIX, INC.
NOTES TO CONSOLIDATED FINANCIAL STATEMENTS - (Continued)
accounting principles ("GAAP") for other areas of Topic 740 by clarifying and amending existing guidance. The ASU is effective for fiscal years, and interim periods within those fiscal years, beginning after December 15, 2020, with early adoption permitted including adoption in any interim period for periods for which financial statements have not yet been issued. On January 1, 2021, we adopted this ASU on a prospective basis and the adoption of this standard did not have an impact on our consolidated financial statements.
Debt with Conversion and Other Options
In August 2020, FASB issued ASU 2020-06: Debt-Debt with Conversion and Other Options (Subtopic 470-20) and Derivatives and Hedging-Contracts in Entity’s Own Equity (Subtopic 815-40). The ASU simplifies the accounting for convertible instruments by reducing the number of accounting models for convertible debt instruments and convertible preferred stock and modifies the disclosure requirement for the convertible instruments. Additionally, this ASU improves the consistency of EPS calculations by eliminating the use of the treasury stock method to calculate diluted EPS for convertible instruments and clarifies certain areas under the current EPS guidance. The ASU is effective for fiscal years, and interim periods within those fiscal years, beginning after December 15, 2021, with early adoption permitted at the beginning of the fiscal year after December 15, 2020. On January 1, 2022, we adopted this ASU on a prospective basis and the adoption of this standard did not have a material impact on our consolidated financial statements.
Business Combinations
In October 2021, FASB issued ASU 2021-08 Business Combinations ("Topic 805"): Accounting for Contract Assets and Contract Liabilities from Contracts with Customers. The ASU requires contract assets and contract liabilities acquired in a business combination to be recognized and measured by the acquirer on the acquisition date in accordance with ASC 606, Revenue from Contracts with Customers, as if it had originated the contracts. Under the current business combinations guidance, such assets and liabilities were recognized by the acquirer at fair value on the acquisition date. The ASU is effective for fiscal years, and interim periods within those fiscal years, beginning after December 15, 2022, with early adoption permitted. On April 1, 2022, we early adopted this ASU and the adoption of this standard did not have a material impact on our consolidated financial statements.
EQUINIX, INC.
NOTES TO CONSOLIDATED FINANCIAL STATEMENTS - (Continued)
2. Revenue
Contract Balances
The following table summarizes the opening and closing balances of our accounts receivable, net; contract assets, current; contract assets, non-current; deferred revenue, current; and deferred revenue, non-current (in thousands):
| | | | | | | | | | | | | | | | | | | | | | | | | | | | | |
| Accounts receivable, net (1) | | Contract assets, current | | Contract assets, non-current | | Deferred revenue, current | | Deferred revenue, non-current |
| Beginning balances as of January 1, 2022 | $ | 681,809 | | | $ | 65,392 | | | $ | 55,486 | | | $ | 109,736 | | | $ | 87,495 | |
| Closing balances as of December 31, 2022 | 855,380 | | | 27,608 | | | 55,405 | | | 132,090 | | | 155,334 | |
| Increase (Decrease) | $ | 173,571 | | | $ | (37,784) | | | $ | (81) | | | $ | 22,354 | | | $ | 67,839 | |
| | | | | | | | | |
| Beginning balances as of January 1, 2021 | $ | 676,738 | | | $ | 13,534 | | | $ | 54,050 | | | $ | 101,258 | | | $ | 71,242 | |
| Closing balances as of December 31, 2021 | 681,809 | | | 65,392 | | | 55,486 | | | 109,736 | | | 87,495 | |
| Increase | $ | 5,071 | | | $ | 51,858 | | | $ | 1,436 | | | $ | 8,478 | | | $ | 16,253 | |
(1) The net change in our allowance for credit losses was insignificant during the year ended December 31, 2022.
The difference between the opening and closing balances of our accounts receivable, net, contract assets and deferred revenues primarily results from revenue growth and the timing difference between the satisfaction of our performance obligation and the customer's payment, as well as business combinations closed during the years ended December 31, 2022 and 2021. The amounts of revenue recognized during the years ended December 31, 2022, 2021 and 2020 from the opening deferred revenue balance were $82.8 million, $93.1 million and $87.0 million, respectively. For the years ended December 31, 2022, 2021 and 2020, no impairment loss related to contract balances was recognized in the consolidated statement of operations.
Contract Costs
The ending balances of net capitalized contract costs as of December 31, 2022 and 2021 were $371.3 million and $325.5 million, respectively, which were included in other assets in the consolidated balance sheet. $96.0 million, $87.6 million, and $85.4 million of contract costs were amortized during years ended December 31, 2022, 2021, and 2020, respectively, which were included in sales and marketing expense in the consolidated statement of operations.
Remaining performance obligations
As of December 31, 2022, approximately $10.1 billion of total revenues, including deferred installation revenues, are expected to be recognized in future periods. Most of our revenue contracts have an initial term varying from one to three years, and thereafter, automatically renew in one-year increments. Included in the remaining performance obligations are contracts that are either under the initial term or under one-year renewal periods. We expect to recognize approximately 70% of our remaining performance obligations as revenues over the next two years, with more revenues expected to be recognized in the first year due to the impact of contracts renewal. The remainder of the balance is generally expected to be recognized over the next three to five years. We estimate our remaining performance obligations at a point in time. Actual amounts and timing of revenue recognition may differ from these estimates due to changes in actual deployments dates, contract modifications, renewals and/or terminations.
The remaining performance obligations do not include variable consideration related to unsatisfied performance obligations such as the usage of metered power, service fees from xScaleTM data centers, which are calculated based on future events or actual costs incurred in the future, or any contracts that could be terminated without any significant penalties such as the majority of interconnection revenues. The remaining performance obligations above include revenues to be recognized in the future related to arrangements where we are considered the lessor.
EQUINIX, INC.
NOTES TO CONSOLIDATED FINANCIAL STATEMENTS - (Continued)
3. Acquisitions
2022 Acquisitions
Acquisition of Entel Chile Data Centers (the "Entel Chile Acquisition") and Entel Peru Data Center (the "Entel Peru Acquisition")
On May 2, 2022, we further expanded in Latin America through an acquisition of four data centers in Chile from Entel, a leading Chilean telecommunications provider, for a total purchase consideration of $638.3 million at the exchange rate in effect on that date. On August 1, 2022, we completed the acquisition of a data center in Peru from Entel for a total purchase consideration of $80.3 million at the exchange rate in effect on that date. The Entel Chile Acquisition and Entel Peru Acquisition support our ongoing expansion to meet customer demand in the Latin American market.
Acquisition of MainOne (the "MainOne Acquisition")
On April 1, 2022, we completed the acquisition of all outstanding shares of MainOne, consisting of four data centers as well as a subsea cable and terrestrial fiber network. We acquired MainOne and its assets for a total purchase consideration of $278.4 million. The MainOne Acquisition supports our ongoing expansion to meet customer demand in the West African market.
2021 Acquisition
Acquisition of GPX India (the "GPX India Acquisition")
On September 1, 2021, we completed the acquisition of GPX India, representing two data centers in Mumbai, India, for a total purchase consideration of approximately INR12.5 billion, or $170.5 million at the exchange rate in effect on that date. The GPX India Acquisition supports our ongoing expansion to meet customer demand in the Indian market.
Purchase price allocation
Each of the acquisitions noted above constitute a business under the accounting standard for business combinations and, therefore, were accounted for as business combinations using the acquisition method of accounting. Under this method, the total purchase price is allocated to the assets acquired and liabilities assumed measured at fair value on the date of acquisition, except where alternative measurement is required under GAAP.
As of December 31, 2022, we had not completed the detailed valuation analysis to derive the fair value of assets acquired and liabilities assumed from the Entel Peru Acquisition, Entel Chile Acquisition and MainOne Acquisition as it relates to the related tax impacts; therefore, the purchase price allocation is based on provisional estimates and subject to continuing management analysis.
EQUINIX, INC.
NOTES TO CONSOLIDATED FINANCIAL STATEMENTS - (Continued)
A summary of the final allocation of total purchase consideration is presented as follows (in thousands):
| | | | | | | | | | | | | | | | | | | | | | | |
| GPX India | | Entel Peru | | Entel Chile | | MainOne |
| Final | | Provisional |
| Cash and cash equivalents | $ | 9,406 | | | $ | — | | | $ | — | | | $ | 33,026 | |
| Accounts receivable | 4,399 | | | — | | | — | | | 9,431 | |
| Other current assets | 8,883 | | | — | | | 12,424 | | | 21,988 | |
| Property, plant and equipment | 88,130 | | | 13,423 | | | 81,132 | | | 239,583 | |
| Operating lease right-of-use assets | 62 | | | — | | | — | | | — | |
| Intangible assets | 15,408 | | | 10,000 | | | 153,489 | | | 54,800 | |
| Goodwill | 77,145 | | | 46,285 | | | 380,867 | | | 110,648 | |
| Deferred tax and other assets | 20 | | | 10,801 | | | 12,090 | | | 6,731 | |
Total assets acquired | 203,453 | | | 80,509 | | | 640,002 | | | 476,207 | |
| Accounts payable and accrued liabilities | (1,566) | | | — | | | (195) | | | (19,790) | |
Other current liabilities (1) | (478) | | | — | | | — | | | (13,061) | |
| Operating lease liabilities | (62) | | | — | | | — | | | — | |
| Finance lease liabilities | (20,565) | | | — | | | — | | | — | |
| Mortgage and loans payable | — | | | — | | | — | | | (25,944) | |
Deferred tax and other liabilities (1) | (10,317) | | | (167) | | | (1,463) | | | (139,062) | |
Net assets acquired | $ | 170,465 | | | $ | 80,342 | | | $ | 638,344 | | | $ | 278,350 | |
(1)For the MainOne Acquisition, other current liabilities includes $9.9 million of deferred revenue - current and the other liabilities includes $95.4 million of deferred revenue - non-current.
Property, plant and equipment - The fair values of property, plant and equipment acquired from these four acquisitions were estimated by applying the cost approach, with the exception of land, which we estimated by applying the market approach. The key assumptions of the cost approach include replacement cost new, physical deterioration, functional and economic obsolescence, economic useful life, remaining useful life, age and effective age.
Intangible assets - The following table presents certain information on the acquired intangible assets (in thousands):
| | | | | | | | | | | | | | | | | | | | | | | | | | |
| Intangible Assets | | Fair Value | | Estimated Useful Lives (Years) | | Weighted-average Estimated Useful Lives (Years) | | Discount Rate |
| GPX India: | | | | | | | | |
Customer relationships (1) | | $ | 15,408 | | | 15.0 | | 15.0 | | 11.0 | % |
| Entel Peru: | | | | | | | | |
Customer relationships (1) | | 10,000 | | | 15.0 | | 15.0 | | 7.0 | % |
| Entel Chile: | | | | | | | | |
Customer relationships (1) | | 153,489 | | | 12.0 - 15.0 | | 14.0 | | 8.5% - 9.5% |
| MainOne: | | | | | | | | |
Customer relationships (1) | | 51,500 | | | 10.0 - 15.0 | | 14.0 | | 11.5 | % |
Trade names (2) | | 3,300 | | | 5.0 | | 5.0 | | 11.5 | % |
EQUINIX, INC.
NOTES TO CONSOLIDATED FINANCIAL STATEMENTS - (Continued)
(1)The fair value was estimated by calculating the present value of estimated future operating cash flows generated from existing customers less costs to realize the revenue and/or by using benchmarking. The rates reflect the nature of the assets as they relate to the risk and uncertainty of the estimated future operating cash flows, as well as the risk of the country within which the acquired business operates.
(2)The fair value of the MainOne trade name was estimated using the relief from royalty method under the income approach. We applied a relief from royalty rate of 1.0%.
Goodwill
Goodwill represents the excess of the purchase price over the fair value of the net tangible and intangible assets acquired and liabilities assumed. Goodwill is attributable to the workforce of the acquired business and the projected revenue increase expected to arise from future customers after the acquisition. Goodwill from the GPX India Acquisition is attributable to the Asia-Pacific region and is not deductible for local tax purposes. Goodwill from the Entel Peru and Entel Chile acquisitions are attributable to the Americas region and are not expected to be amortizable for local tax purposes. Goodwill from the MainOne Acquisition is attributable to the EMEA region and is generally not deductible for local tax purposes.
Revenues and net income from operations
The operating results of the Entel Peru and Entel Chile acquisitions are reported in the Americas region and the operating results of the MainOne Acquisition are reported in the EMEA region following the date of acquisition. During the year ended December 31, 2022, our results of operations from these acquisitions included $89.9 million of revenues and $8.2 million net income from operations.
Transaction costs
During the year ended December 31, 2022, the transaction costs for the Entel Chile and Entel Peru acquisitions were $7.2 million and the transaction costs for the MainOne acquisition were not significant.
2020 Acquisitions
Acquisition of Bell Data Centers (the "Bell Acquisition")
On October 1, 2020, we completed the acquisition of 12 data center sites across Canada from Bell, with one additional data center in Ottawa Canada acquired on November 2, 2020, for a total combined purchase consideration of approximately C$934.3 million, or $704.0 million at the exchange rates in effect on those dates. The acquisition supports our ongoing expansion to meet customer demand in Canada.
Acquisition of Packet (the "Packet Acquisition")
On March 2, 2020, we acquired all outstanding shares and equity awards of Packet, a leading bare metal automation platform for a total purchase consideration of approximately $290.3 million in cash. In addition, we paid $16.1 million in cash to accelerate the vesting of unvested Packet equity awards for certain Packet employees, which was recorded as stock-based compensation expense during the three months ended March 31, 2020. In connection with the acquisition, we also issued restricted stock awards with an aggregated fair value of $30.2 million and a three-year vesting period, which will be recognized as stock-based compensation costs over the vesting period. The acquisition, combined with Equinix MetalTM, is expected to accelerate our strategy to help enterprises deploy hybrid multicloud architectures on our data center platform.
Acquisition of data centers from Axtel (the "Axtel Acquisition")
On January 8, 2020, we completed the acquisition of three data centers in Mexico from Axtel for a total purchase consideration of approximately $189.0 million, including $175.0 million in cash and $14.0 million we paid to the seller for recoverable value-added taxes ("VAT") incurred prior to the acquisition, which related to a corresponding VAT receivable acquired upon acquisition. The acquisition supports our ongoing expansion to meet customer demand in our Americas region.
EQUINIX, INC.
NOTES TO CONSOLIDATED FINANCIAL STATEMENTS - (Continued)
4. Earnings Per Share
The following table sets forth the computation of basic and diluted earnings per share ("EPS") for the years ended December 31 (in thousands, except per share amounts):
| | | | | | | | | | | | | | | | | |
| 2022 | | 2021 | | 2020 |
| Net income | $ | 704,577 | | | $ | 499,728 | | | $ | 370,074 | |
| Net (income) loss attributable to non-controlling interests | (232) | | | 463 | | | (297) | |
| Net income attributable to Equinix | $ | 704,345 | | | $ | 500,191 | | | $ | 369,777 | |
| | | | | |
| Weighted-average shares used to calculate basic EPS | 91,569 | | | 89,772 | | | 87,700 | |
| Effect of dilutive securities: | | | | | |
| Employee equity awards | 259 | | | 637 | | | 710 | |
| Weighted-average shares used to calculate diluted EPS | 91,828 | | | 90,409 | | | 88,410 | |
| | | | | |
| EPS attributable to Equinix: | | | | | |
| Basic EPS | $ | 7.69 | | | $ | 5.57 | | | $ | 4.22 | |
| Diluted EPS | $ | 7.67 | | | $ | 5.53 | | | $ | 4.18 | |
The following table sets forth potential shares of common stock that are not included in the diluted EPS calculation above because to do so would be anti-dilutive for the years ended December 31 (in thousands):
| | | | | | | | | | | | | | | | | |
| 2022 | | 2021 | | 2020 |
| | | | | |
| | | | | |
| Common stock related to employee equity awards and other | 582 | | | 206 | | | 19 | |
Total | 582 | | | 206 | | | 19 | |
5. Assets Held for Sale
In June 2021, we entered into an agreement to form a joint venture in the form of a limited liability partnership with GIC Private Limited, Singapore's sovereign wealth fund ("GIC"), to develop and operate additional xScaleTM data centers in Europe and the Americas (the “EMEA 2 Joint Venture”). xScale data centers are engineered to meet the technical and operational requirements and price points of core hyperscale workload deployments and also offer access to our comprehensive suite of interconnection and edge solutions. The transaction was structured to close in phases over the course of two years, pending regulatory approval and other closing conditions. The assets and liabilities of the Warsaw 4 ("WA4") data center site, which were included within our EMEA region, were classified as held for sale as of June 30, 2021. In June 2022, we sold the WA4 data center in exchange for a total consideration of $61.5 million. During the year ended December 31, 2022, we recognized an insignificant gain on the sale of the WA4 data center.
In October 2021, we entered into an agreement to form a joint venture in the form of a limited liability partnership with PGIM Real Estate ("PGIM"), to develop and operate xScale data centers in Asia-Pacific (the "Asia-Pacific 2 Joint Venture"). The assets and liabilities of the Sydney 9 ("SY9") data center site, which were included within our Asia-Pacific region, were classified as held for sale as of September 30, 2021. Upon closing the joint venture in March 2022, we sold the SY9 data center in exchange for a total consideration of $201.3 million, which was comprised of $165.6 million of net cash proceeds, a 20% partnership interest in the Asia-Pacific 2 Joint Venture with a fair value of $29.8 million, and $5.9 million of receivables. During the year ended December 31, 2022, we recognized an insignificant loss on the sale of the SY9 data center.
In March 2022, we entered into an agreement to sell the Mexico 3 ("MX3") data center site in connection with the formation of a new joint venture with GIC (the "AMER 1 Joint Venture") to develop and operate xScale data centers in the Americas. Given that the key terms of the sale had been substantially agreed upon as of September 30, 2021, the assets and liabilities of the MX3 data center, which are currently included within our Americas region, were classified as held for sale as of September 30, 2021 and remained held for sale as of December 31, 2022.
EQUINIX, INC.
NOTES TO CONSOLIDATED FINANCIAL STATEMENTS - (Continued)
All assets and liabilities classified as held for sale are reported at the lower of their carrying amounts or fair values less costs to sell. The following table summarizes the assets and liabilities that were classified as assets and liabilities held for sale in the consolidated balance sheets as of December 31, 2022 and 2021 (in thousands):
| | | | | | | | | | | |
| December 31, 2022 | | December 31, 2021 |
| Operating lease right-of-use assets | $ | — | | | $ | 12,835 | |
| Property, plant and equipment | 81,368 | | | 260,182 | |
| Other assets | 2,948 | | | 3,178 | |
| Total assets held for sale | $ | 84,316 | | | $ | 276,195 | |
| | | |
| Accounts payable and accrued expenses | $ | — | | | $ | 510 | |
| Current portion of operating lease liabilities | — | | | 2,039 | |
| Operating lease liabilities, less current portion | — | | | 348 | |
| Accrued property, plant and equipment | 10,480 | | | 18,127 | |
Total liabilities held for sale (1) | $ | 10,480 | | | $ | 21,024 | |
(1)Liabilities held for sale were included within other current liabilities on the consolidated balance sheet.
Sale of xScaleTM data center facilities in 2021
As noted above, in June 2021, we entered into an agreement to form the EMEA 2 Joint Venture with GIC. The assets and liabilities of the data center sites that were expected to be sold to the EMEA 2 Joint Venture within a year were classified as held for sale as of June 30, 2021. The first phase of the transaction, comprised of data center sites located in Frankfurt, Helsinki, Madrid, Milan and Paris, closed in September 2021. Upon closing, we sold these data center sites in exchange for a total consideration of $144.0 million, which was comprised of $106.4 million of net cash proceeds, a 20% partnership interest in the EMEA 2 Joint Venture with a fair value of $30.4 million, and $7.2 million of receivables. During the year ended December 31, 2021, we recognized an insignificant gain on the sale of these xScale data center facilities. In October 2021, we completed the sale of the Sao Paulo 5 ("SP5") data center to the EMEA 2 Joint Venture in exchange for a total consideration of $34.3 million. During the year ended December 31, 2021, we recognized an insignificant loss on the sale of the SP5 data center.
In May 2021, we entered into an agreement to sell the Dublin 5 ("DB5") data center site to the EMEA 1 Joint Venture (as defined in Note 6 below). The assets and liabilities of the DB5 data center, which were included within our EMEA region, were classified as held for sale as of June 30, 2021. In July 2021, we sold the DB5 data center in exchange for a total consideration of $77.9 million. During the year ended December 31, 2021, we recognized a total gain of $15.8 million on the sale of the DB5 data center.
EQUINIX, INC.
NOTES TO CONSOLIDATED FINANCIAL STATEMENTS - (Continued)
6. Equity Method Investments
We hold various equity method investments, primarily joint venture or partnership arrangements, in order to invest in certain entities that are in line with our business development objectives, including the development and operation of xScale data centers. Some of these xScale joint ventures are classified as VIEs, as discussed further below. The Asia-Pacific 1, Asia-Pacific 2, Asia-Pacific 3 and EMEA 2 Joint Ventures (the "VIE Joint Ventures") share a similar purpose, design and nature of assets. The following table summarizes our equity method investments (in thousands), which were included in other assets on the consolidated balance sheets as of December 31 (in thousands):
| | | | | | | | | | | | | | | | | | | | |
| Investee | | Ownership Percentage | | 2022 | | 2021 |
| EMEA 1 Joint Venture with GIC | | 20 | % | | $ | 148,895 | | | $ | 131,516 | |
| VIE Joint Ventures | | 20 | % | | 191,680 | | | 95,052 | |
| Other | | Various | | 7,570 | | | 18,481 | |
| Total | | | | $ | 348,145 | | | $ | 245,049 | |
| | | | | | |
Non - VIE Joint Venture
EMEA 1 Joint Venture
In 2019, we entered into a joint venture in the form of a limited liability partnership with GIC (the "EMEA 1 Joint Venture"), to develop and operate xScale data centers in Europe. The EMEA 1 Joint Venture is not a VIE given that both equity investors' interests have the characteristics of a controlling financial interest and it is sufficiently capitalized to sustain its operations, requiring additional funding from its partners only when expanding operations. Our share of income and losses of equity method investments from this joint venture was insignificant for the years ended December 31, 2022 and 2021 and was included in other income (expense) on the consolidated statement of operations.
We committed to make future equity contributions to the EMEA 1 Joint Venture for funding its future development. As of December 31, 2022, we had future equity contribution commitments of $11.3 million.
VIE Joint Ventures
In 2020, we entered into a second joint venture in the form of a limited liability partnership with GIC (the "Asia-Pacific 1 Joint Venture") to develop and operate xScale data centers in Asia-Pacific.
In 2021, we entered into the EMEA 2 Joint Venture with GIC to develop and operate additional xScale data centers in Europe and the Americas (see Note 5 above).
On March 11, 2022, we entered into the Asia-Pacific 2 Joint Venture with PGIM to develop and operate additional xScale data centers in Asia-Pacific (see Note 5 above).
On April 6, 2022, we entered into a joint venture in the form of a limited liability partnership with GIC (the "Asia-Pacific 3 Joint Venture") to develop and operate additional xScale data centers in Seoul, Korea. Upon closing, we contributed $17.0 million in exchange for a 20% partnership interest in the joint venture.
The VIE Joint Ventures are considered VIEs because they do not have sufficient funds from operations to be self-sustaining. While we provide certain management services to their operations and earn fees for the performance of such services, the power to direct the activities of these joint ventures that most significantly impact economic performance is shared equally between us and either GIC or PGIM, as applicable. These activities include data center construction and operations, sales and marketing, financing, and real estate purchases or sales. Decisions about these activities require the consent of both Equinix and either GIC or PGIM, as applicable. We concluded that neither party is deemed to have predominant control over the VIE Joint Ventures and neither party is considered to be the primary beneficiary. Our share of income of equity method investments from these joint ventures was $8.6 million for the year ended December 31, 2022 and was not significant for the year ended December 31, 2021 and was included in other income (expense) on the consolidated statement of operations.
EQUINIX, INC.
NOTES TO CONSOLIDATED FINANCIAL STATEMENTS - (Continued)
The following table summarizes our maximum exposure to loss related to the VIE Joint Ventures as of December 31, 2022 (in thousands):
| | | | | | | | |
| | VIE Joint Ventures |
| Equity Investment | | $ | 191,680 | |
| Outstanding Receivables | | 19,935 | |
Future Equity Contribution Commitments (1) | | 49,993 | |
Maximum Future Payments under Debt Guarantees (2) | | 89,308 | |
| Total | | $ | 350,916 | |
(1)The joint ventures' partners are required to make additional equity contributions proportionately upon certain occurrences, such as a shortfall in capital necessary to complete certain construction phases or make interest payments on their outstanding debt.
(2)In connection with our 20% equity investment in the EMEA 2 Joint Venture, we provided the lenders with our guarantees covering 20% of all payments of principal and interest due under EMEA 2 Joint Venture's credit facility agreements (see Note 15).
7. Balance Sheet Components
Cash, and Cash Equivalents
Cash and cash equivalents consisted of the following as of December 31 (in thousands):
| | | | | | | | | | | |
| 2022 | | 2021 |
| Cash and cash equivalents: | | | |
| Cash | $ | 1,141,793 | | | $ | 950,677 | |
| Cash equivalents: | | | |
| Money market funds | 764,628 | | | 585,681 | |
| | | |
| Total cash and cash equivalents | $ | 1,906,421 | | | $ | 1,536,358 | |
| | | |
| | | |
| | | |
| | | |
| | | |
As of December 31, 2022 and 2021, cash and cash equivalents included investments which were readily convertible to cash and had original maturity dates of 90 days or less.
Accounts Receivable
Trade accounts receivable are recorded at the invoiced amount and generally do not bear interest. Accounts receivable, net, consisted of the following as of December 31 (in thousands):
| | | | | | | | | | | |
| 2022 | | 2021 |
| Accounts receivable | $ | 867,605 | | | $ | 693,444 | |
| Allowance for credit losses | (12,225) | | | (11,635) | |
| Accounts receivable, net | $ | 855,380 | | | $ | 681,809 | |
EQUINIX, INC.
NOTES TO CONSOLIDATED FINANCIAL STATEMENTS - (Continued)
The following table summarizes the activity of our allowance for credit losses (in thousands):
| | | | | |
| Balance as of December 31, 2019 | $ | 13,026 | |
| Adjustments due to adoption of ASU 2016-13 | 900 | |
| Provision for credit losses | 5,069 | |
| Net write-offs | (10,050) | |
| Impact of foreign currency exchange | 1,732 | |
| Balance as of December 31, 2020 | 10,677 | |
| |
| Provision for credit losses | 10,016 | |
| Net write-offs | (8,295) | |
| Impact of foreign currency exchange | (763) | |
| Balance as of December 31, 2021 | 11,635 | |
| Provision for credit losses | 7,426 | |
| Net write-offs | (6,356) | |
| Impact of foreign currency exchange | (480) | |
| Balance as of December 31, 2022 | $ | 12,225 | |
Other Current Assets
Other current assets consisted of the following as of December 31 (in thousands):
| | | | | | | | | | | |
| 2022 | | 2021 |
| Prepaid expenses | $ | 79,191 | | | $ | 65,224 | |
| Taxes receivable | 122,166 | | | 128,123 | |
| Restricted cash, current | 1,734 | | | 12,188 | |
| Other receivables | 109,948 | | | 59,224 | |
| Derivative instruments | 105,693 | | | 117,432 | |
| Contract assets, current | 27,608 | | | 65,392 | |
| Other current assets | 12,798 | | | 15,156 | |
| Total other current assets | $ | 459,138 | | | $ | 462,739 | |
Property, Plant and Equipment, Net
Property, plant and equipment, net consisted of the following as of December 31 (in thousands):
| | | | | | | | | | | |
| 2022 | | 2021 |
| Core systems | $ | 11,616,863 | | | $ | 10,808,417 | |
| Buildings | 8,013,672 | | | 7,381,644 | |
| Leasehold improvements | 1,991,060 | | | 2,022,617 | |
| Construction in progress | 1,195,042 | | | 967,562 | |
Personal property (1) | 1,912,861 | | | 1,551,642 | |
| Land | 1,252,993 | | | 970,982 | |
| 25,982,491 | | | 23,702,864 | |
| Less accumulated depreciation | (9,332,957) | | | (8,257,089) | |
| Property, plant and equipment, net | $ | 16,649,534 | | | $ | 15,445,775 | |
EQUINIX, INC.
NOTES TO CONSOLIDATED FINANCIAL STATEMENTS - (Continued)
(1)Personal property included $1.6 billion and $1.2 billion of capitalized internal-use software as of December 31, 2022 and 2021, respectively.
Goodwill and Other Intangibles
The following table presents goodwill and other intangible assets, net, for the years ended December 31, 2022 and 2021 (in thousands):
| | | | | | | | | | | |
| 2022 | | 2021 |
| Goodwill: | | | |
| Americas | $ | 2,630,752 | | | $ | 2,210,009 | |
| EMEA | 2,377,921 | | | 2,472,586 | |
| Asia-Pacific | 645,544 | | | 689,476 | |
| $ | 5,654,217 | | | $ | 5,372,071 | |
| Intangible assets, net: | | | |
| Intangible assets - customer relationships | $ | 2,885,152 | | | $ | 2,841,372 | |
| Intangible assets - trade names | 14,719 | | | 11,471 | |
| Intangible assets - in-place leases | 22,183 | | | 32,760 | |
| Intangible assets - licenses | 9,697 | | | 9,697 | |
Intangible assets - at-the-money lease contracts | 56,822 | | | 60,455 | |
| Intangible assets - other | 8,029 | | | 12,546 | |
| 2,996,602 | | | 2,968,301 | |
| Accumulated amortization - customer relationships | (1,056,844) | | | (987,462) | |
| Accumulated amortization - trade names | (4,561) | | | (3,207) | |
| Accumulated amortization - in-place leases | (15,797) | | | (22,847) | |
| Accumulated amortization - licenses | (6,467) | | | (5,821) | |
| Accumulated amortization - at the money lease contracts | (10,056) | | | (5,553) | |
| Accumulated amortization - other | (5,228) | | | (8,144) | |
| (1,098,953) | | | (1,033,034) | |
| Total intangible assets, net | $ | 1,897,649 | | | $ | 1,935,267 | |
Changes in the carrying amount of goodwill by geographic regions are as follows (in thousands):
| | | | | | | | | | | | | | | | | | | | | | | |
| Americas | | EMEA | | Asia-Pacific | | Total |
| Balance as of December 31, 2020 | $ | 2,212,782 | | | $ | 2,611,166 | | | $ | 648,605 | | | $ | 5,472,553 | |
| Purchase of GPX | — | | | — | | | 77,162 | | | 77,162 | |
| Impact of foreign currency exchange | (2,773) | | | (138,580) | | | (36,291) | | | (177,644) | |
| Balance as of December 31, 2021 | $ | 2,210,009 | | | $ | 2,472,586 | | | $ | 689,476 | | | $ | 5,372,071 | |
| Purchase of MainOne | — | | | 110,648 | | | — | | | 110,648 | |
| Purchase of Entel Chile | 380,867 | | | — | | | — | | | 380,867 | |
| Purchase of Entel Peru | 46,285 | | | — | | | — | | | 46,285 | |
| Impact of foreign currency exchange | (6,409) | | | (205,313) | | | (43,932) | | | (255,654) | |
| Balance as of December 31, 2022 | $ | 2,630,752 | | | $ | 2,377,921 | | | $ | 645,544 | | | $ | 5,654,217 | |
EQUINIX, INC.
NOTES TO CONSOLIDATED FINANCIAL STATEMENTS - (Continued)
Changes in the net book value of intangible assets by geographic regions are as follows (in thousands):
| | | | | | | | | | | | | | | | | | | | | | | |
| Americas | | EMEA | | Asia-Pacific | | Total |
| Balance as of December 31, 2019 | $ | 1,443,292 | | | $ | 466,564 | | | $ | 192,533 | | | $ | 2,102,389 | |
| Axtel acquisition | 22,750 | | | — | | | — | | | 22,750 | |
| Packet acquisition | 58,500 | | | — | | | — | | | 58,500 | |
| Bell acquisition | 75,631 | | | — | | | — | | | 75,631 | |
| Other asset acquisition | — | | | 64,905 | | | — | | | 64,905 | |
| Amortization of intangibles | (133,608) | | | (49,417) | | | (16,022) | | | (199,047) | |
| Impact of foreign currency exchange | (3,476) | | | 35,975 | | | 13,318 | | | 45,817 | |
| Balance as of December 31, 2020 | 1,463,089 | | | 518,027 | | | 189,829 | | | 2,170,945 | |
| GPX acquisition | — | | | — | | | 15,472 | | | 15,472 | |
| Amortization of intangibles | (133,289) | | | (55,807) | | | (16,388) | | | (205,484) | |
| Impact of foreign currency exchange | (2,047) | | | (30,278) | | | (13,341) | | | (45,666) | |
| Balance as of December 31, 2021 | 1,327,753 | | | 431,942 | | | 175,572 | | | 1,935,267 | |
| Entel Chile acquisition | 153,489 | | | — | | | — | | | 153,489 | |
| Entel Peru acquisition | 10,000 | | | — | | | — | | | 10,000 | |
| MainOne acquisition | — | | | 54,800 | | | — | | | 54,800 | |
| Amortization of intangibles | (137,358) | | | (52,283) | | | (15,114) | | | (204,755) | |
| Impact of foreign currency exchange | (3,570) | | | (33,052) | | | (14,530) | | | (51,152) | |
| Balance as of December 31, 2022 | $ | 1,350,314 | | | $ | 401,407 | | | $ | 145,928 | | | $ | 1,897,649 | |
Goodwill and intangible assets which are denominated in currencies other than the U.S. Dollar are subject to foreign currency fluctuations. Our foreign currency translation gains and losses, including goodwill and intangibles, are a component of other comprehensive income and loss.
Estimated future amortization expense related to these intangibles is as follows (in thousands):
| | | | | |
| Years ending: | |
| 2023 | $ | 206,596 | |
| 2024 | 205,550 | |
| 2025 | 203,259 | |
| 2026 | 202,658 | |
| 2027 | 201,711 | |
| Thereafter | 877,875 | |
| Total | $ | 1,897,649 | |
EQUINIX, INC.
NOTES TO CONSOLIDATED FINANCIAL STATEMENTS - (Continued)
Other Assets
Other assets consisted of the following as of December 31 (in thousands):
| | | | | | | | | | | |
| 2022 | | 2021 |
| Deferred tax assets, net | $ | 44,628 | | | $ | 59,816 | |
Prepaid expenses (1) | 150,617 | | | 87,758 | |
| Debt issuance costs, net | 6,831 | | | 2,130 | |
| Deposits | 64,337 | | | 70,548 | |
| Restricted cash | 93 | | | 908 | |
| Derivative instruments | 298,899 | | | 59,917 | |
| Contract assets, non-current | 55,405 | | | 55,486 | |
| Contract costs | 371,306 | | | 325,510 | |
| Equity method investments | 348,145 | | | 245,049 | |
| Other assets | 35,876 | | | 18,944 | |
| Total other assets | $ | 1,376,137 | | | $ | 926,066 | |
(1)Prepaid expenses included $84.2 million and $46.0 million of capitalized CCA implementation costs, net as of December 31, 2022 and 2021, respectively.
Accounts Payable and Accrued Expenses
Accounts payable and accrued expenses consisted of the following as of December 31 (in thousands):
| | | | | | | | | | | |
| 2022 | | 2021 |
| Accounts payable | $ | 115,953 | | | $ | 84,084 | |
| Accrued compensation and benefits | 413,135 | | | 364,783 | |
| Accrued interest | 85,052 | | | 81,893 | |
Accrued taxes (1) | 131,376 | | | 117,061 | |
| Accrued utilities and security | 115,119 | | | 94,251 | |
| Accrued other | 144,165 | | | 137,072 | |
| Total accounts payable and accrued expenses | $ | 1,004,800 | | | $ | 879,144 | |
(1)Accrued taxes included income taxes payable of $55.2 million and $51.3 million as of December 31, 2022 and 2021, respectively.
Other Current Liabilities
Other current liabilities consisted of the following as of December 31 (in thousands):
| | | | | | | | | | | |
| 2022 | | 2021 |
| Deferred revenue, current | $ | 132,090 | | | $ | 109,736 | |
| Customer deposits | 15,896 | | | 16,380 | |
| Derivative instruments | 24,868 | | | 13,373 | |
| | | |
| Dividends payable, current | 12,302 | | | 12,027 | |
| Asset retirement obligations | 8,657 | | | 8,756 | |
| Other current liabilities | 57,533 | | | 54,247 | |
| Total other current liabilities | $ | 251,346 | | | $ | 214,519 | |
EQUINIX, INC.
NOTES TO CONSOLIDATED FINANCIAL STATEMENTS - (Continued)
Other Liabilities
Other liabilities consisted of the following as of December 31 (in thousands):
| | | | | | | | | | | |
| 2022 | | 2021 |
| Asset retirement obligations | $ | 109,508 | | | $ | 108,800 | |
| Deferred tax liabilities, net | 383,359 | | | 340,287 | |
| Deferred revenue, non-current | 155,334 | | | 87,495 | |
| | | |
| Accrued taxes | 59,806 | | | 124,032 | |
| Dividends payable, non-current | 10,446 | | | 9,750 | |
| Customer deposits | 4,998 | | | 1,534 | |
| Derivative instruments | 8,820 | | | 20,899 | |
| Other liabilities | 65,592 | | | 70,614 | |
| Total other liabilities | $ | 797,863 | | | $ | 763,411 | |
The following table summarizes the activities of our asset retirement obligation ("ARO") (in thousands):
| | | | | |
| Asset retirement obligations as of December 31, 2019 | $ | 102,415 | |
| Additions | 5,909 | |
Adjustments (1) | (4,241) | |
| Accretion expense | 6,331 | |
| Impact of foreign currency exchange | 3,355 | |
| Asset retirement obligations as of December 31, 2020 | 113,769 | |
| Additions | 7,483 | |
Adjustments (1) | (6,591) | |
| Accretion expense | 6,518 | |
| Impact of foreign currency exchange | (3,623) | |
| Asset retirement obligations as of December 31, 2021 | 117,556 | |
| Additions | 2,951 | |
Adjustments (1) | (4,281) | |
| Accretion expense | 6,431 | |
| Impact of foreign currency exchange | (4,492) | |
| Asset retirement obligations as of December 31, 2022 | $ | 118,165 | |
(1)The ARO adjustments are primarily due to lease amendments and acquisition of real estate assets, as well as other adjustments.
8. Derivatives and Hedging Instruments
Derivatives Designated as Hedging Instruments
Net Investment Hedges. We are exposed to the impact of foreign exchange rate fluctuations on the value of investments in our foreign subsidiaries whose functional currencies are other than the U.S. Dollar. In order to mitigate the impact of foreign currency exchange rates, we have entered into various foreign currency debt obligations, which are designated as hedges against our net investments in foreign subsidiaries. As of both December 31, 2022 and 2021, the total principal amounts of foreign currency debt obligations designated as net investment hedges was $1.5 billion.
We also utilize cross-currency interest rate swaps, designated as net investment hedges, which effectively convert a portion of our U.S. dollar-denominated fixed-rate debt to foreign currency-denominated fixed-rate debt, to hedge the currency exposure associated with our net investment in our foreign subsidiaries. As of December 31,
EQUINIX, INC.
NOTES TO CONSOLIDATED FINANCIAL STATEMENTS - (Continued)
2022 and 2021, the total notional amount of cross-currency interest rate swaps, designated as net investment hedges, were $3.9 billion and $4.0 billion respectively, with maturity dates ranging through 2026.
From time to time, we use foreign currency forward contracts, which are designated as net investment hedges, to hedge against the effect of foreign exchange rate fluctuations on our net investment in our foreign subsidiaries. As of December 31, 2022 and 2021, the total notional amount of foreign currency forward contracts designated as net investment hedges were $373.4 million and $375.7 million, respectively.
Certain of our customer agreements that are priced in currencies different from the functional or local currencies of the parties involved are deemed to have foreign currency forward contracts embedded in them. These embedded derivatives are separated from their host contracts and carried on our balance sheet at their fair value. The majority of these embedded derivatives arise as a result of our foreign subsidiaries pricing their customer contracts in U.S. Dollars. We use these forward contracts embedded within our customer agreements to hedge against the effect of foreign exchange rate fluctuations on our net investment in our foreign subsidiaries.
The effect of net investment hedges on accumulated other comprehensive income and the consolidated statements of operations for the years ended December 31, 2022, 2021 and 2020 was as follows (in thousands):
| | | | | | | | | | | | | | | | | | | | | | | |
| Amount of gain or (loss) recognized in accumulated other comprehensive income: | | |
| | | Years Ended December 31, |
| | | 2022 | | 2021 | | 2020 |
| Foreign currency debt | | $ | 160,286 | | | $ | 93,945 | | | $ | (208,281) | |
Cross-currency interest rate swaps (included component) (1) | | 276,350 | | | 282,935 | | | (218,843) | |
Cross-currency interest rate swaps (excluded component) (2) | | (35,723) | | | (52,517) | | | (347) | |
Foreign currency forward contracts (included component) (1) | | 27,323 | | | 2,621 | | | (17,115) | |
Foreign currency forward contracts (excluded component) (3) | | (2,535) | | | (2) | | | 32 | |
| Total | | $ | 425,701 | | | $ | 326,982 | | | $ | (444,554) | |
| | | | | | | |
| Amount of gain or (loss) recognized in earnings: | | |
| Location of gain or (loss) | | Years Ended December 31, |
| | 2022 | | 2021 | | 2020 |
Cross-currency interest rate swaps (excluded component) (2) | Interest expense | | $ | 50,188 | | | $ | 44,933 | | | $ | 27,196 | |
Foreign currency forward contracts (excluded component) (3) | Interest expense | | (469) | | | 242 | | | 42 | |
| Total | | | $ | 49,719 | | | $ | 45,175 | | | $ | 27,238 | |
| | | | | | | |
| | |
| | | |
| | | | | | |
| | | | | | | |
| | | | | | | |
(1)Included component represents foreign exchange spot rates.
(2)Excluded component represents cross-currency basis spread and interest rates.
(3)Excluded component represents foreign currency forward points.
Cash Flow Hedges. We hedge our foreign currency transaction exposure for forecasted revenues and expenses in our EMEA region between the U.S. Dollar and the British Pound, Euro, Swedish Krona and Swiss Franc. The foreign currency forward and option contracts that we use to hedge this exposure are designated as cash flow hedges. As of December 31, 2022 and 2021, the total notional amounts of these foreign exchange contracts were $490.8 million and $831.2 million, respectively.
As of December 31, 2022, our foreign currency cash flow hedge instruments had maturity dates ranging from January 2023 to February 2024 and we had a net gain of $8.2 million recorded within accumulated other comprehensive income (loss) to be reclassified to revenues and expenses relating to these cash flow hedges as they mature in the next 12 months. As of December 31, 2021, our foreign currency cash flow hedge instruments had maturity dates ranging from January 2022 to December 2023 and we had a net gain of $13.3 million recorded within accumulated other comprehensive income (loss) to be reclassified to revenues and expenses relating to these cash flow hedges as they mature in the next 12 months.
EQUINIX, INC.
NOTES TO CONSOLIDATED FINANCIAL STATEMENTS - (Continued)
We enter into intercompany hedging instruments ("intercompany derivatives") with our wholly-owned subsidiaries in order to hedge certain forecasted revenues and expenses denominated in currencies other than the U.S. Dollar. Simultaneously, we enter into derivative contracts with unrelated third parties to externally hedge the net exposure created by such intercompany derivatives.
We hedge the interest rate exposure created by anticipated fixed rate debt issuances through the use of treasury locks and swap locks (collectively, interest rate locks), which are designated as cash flow hedges. As of December 31, 2022, we had no interest rate locks outstanding. As of December 31, 2021, the total notional amount of interest rate locks outstanding was $800.0 million. During the year ended December 31, 2022, interest rate locks with a combined aggregate notional amount of $800.0 million were settled related to the issuance of senior notes during the year. When interest rate locks are settled, any gain or loss from the transactions is deferred and included as a component of other comprehensive income (loss) and is amortized to interest expense over the term of the forecasted hedged transaction which is equivalent to the term of the interest rate locks. As of December 31, 2022 and 2021, we had a net gain of $1.4 million and a net loss of $3.9 million, respectively, recorded within accumulated other comprehensive income (loss) to be reclassified to interest expense in the next 12 months for interest rate locks.
We also use cross-currency swaps, which are designated as cash flow hedges, to manage the foreign currency exposure associated with a portion of our foreign currency-denominated debt. As of December 31, 2022 and 2021, the total notional amount of cross-currency interest rate swaps, designated as cash flow hedges, were $280.3 million and $0, respectively.
The effect of cash flow hedges on accumulated other comprehensive income and the consolidated statements of operations for the years ended December 31, 2022, 2021 and 2020 was as follows (in thousands):
| | | | | | | | | | | | | | | | | | | | | | | |
| Amount of gain or (loss) recognized in accumulated other comprehensive income: | | |
| | | Years Ended December 31, |
| | | 2022 | | 2021 | | 2020 |
Foreign currency forward and option contracts (included component) (1) | | $ | (8,711) | | | $ | 67,767 | | | $ | (68,573) | |
Foreign currency option contracts (excluded component) (2) | | — | | | 151 | | | 1,655 | |
| Cross-currency interest rate swaps | | (2,386) | | | — | | | — | |
| Interest rate locks | | 49,392 | | | 9,624 | | | (30,393) | |
Total | | $ | 38,295 | | | $ | 77,542 | | | $ | (97,311) | |
|
| Amount of gain or (loss) reclassified from accumulated other comprehensive income to income: |
| | | Years Ended December 31, |
| Location of gain or (loss) | | 2022 | | 2021 | | 2020 |
Foreign currency forward contracts | Revenues | | $ | 148,100 | | | $ | (39,297) | | | $ | 37,198 | |
Foreign currency forward contracts | Costs and operating expenses | | (71,968) | | | 20,496 | | | (19,890) | |
| Interest rate locks | Interest Expense | | (26) | | | (4,056) | | | (1,204) | |
Total | | | $ | 76,106 | | | $ | (22,857) | | | $ | 16,104 | |
| | | | | | | |
| Amount of gain or (loss) excluded from effectiveness testing and included in income: |
| | | Years Ended December 31, |
| Location of gain or (loss) | | 2022 | | 2021 | | 2020 |
| | | | | | | |
Foreign currency option contracts (excluded component) (2) | Revenues | | $ | — | | | $ | (244) | | | $ | (1,761) | |
Total | | | $ | — | | | $ | (244) | | | $ | (1,761) | |
(1)Included component represents foreign exchange spot rates.
(2)Excluded component represents option's time value.
EQUINIX, INC.
NOTES TO CONSOLIDATED FINANCIAL STATEMENTS - (Continued)
Derivatives Not Designated as Hedging Instruments
Embedded Derivatives. As described above, certain of our customer agreements that are priced in currencies different from the functional or local currencies of the parties involved are deemed to have foreign currency forward contracts embedded in them..
Economic Hedges of Embedded Derivatives. We use foreign currency forward contracts to manage the foreign exchange risk associated with our customer agreements that are priced in currencies different from the functional or local currencies of the parties involved ("economic hedges of embedded derivatives"). Foreign currency forward contracts represent agreements to exchange the currency of one country for the currency of another country at an agreed-upon price on an agreed-upon settlement date.
Foreign Currency Forward Contracts. We also use foreign currency forward contracts to manage the foreign exchange risk associated with certain foreign currency-denominated monetary assets and liabilities. As a result of foreign currency fluctuations, the U.S. Dollar equivalent values of our foreign currency-denominated monetary assets and liabilities change. Gains and losses on these contracts are included in other income (expense), on a net basis, along with the foreign currency gains and losses of the related foreign currency-denominated monetary assets and liabilities associated with these foreign currency forward contracts. As of December 31, 2022 and 2021, the total notional amounts of these foreign currency contracts were $3.0 billion and $3.3 billion, respectively.
The following table presents the effect of derivatives not designated as hedging instruments in our consolidated statements of operations (in thousands):
| | | | | | | | | | | | | | | | | | | | | | | |
| Amount of gain or (loss) recognized in earnings: | | | | | | |
| | | Years Ended December 31, |
| Location of gain or (loss) | | 2022 | | 2021 | | 2020 |
Embedded derivatives | Revenues | | $ | (568) | | | $ | 3,503 | | | $ | (3,043) | |
Economic hedge of embedded derivatives | Revenues | | (984) | | | (5,937) | | | 2,142 | |
Foreign currency forward contracts | Other income (expense) | | 137,633 | | | 129,496 | | | (127,648) | |
Total | | | $ | 136,081 | | | $ | 127,062 | | | $ | (128,549) | |
EQUINIX, INC.
NOTES TO CONSOLIDATED FINANCIAL STATEMENTS - (Continued)
Fair Value of Derivative Instruments
The following table presents the fair value of derivative instruments recognized in our consolidated balance sheets as of December 31, 2022 and 2021 (in thousands):
| | | | | | | | | | | | | | | | | | | | | | | |
| December 31, 2022 | | December 31, 2021 |
| Assets (1) | | Liabilities (2) | | Assets (1) | | Liabilities (2) |
| Designated as hedging instruments: | | | | | | | |
Cash flow hedges | | | | | | | |
Foreign currency forward and option contracts | $ | 27,812 | | | $ | 21,352 | | | $ | 22,866 | | | $ | 7,618 | |
| Cross-currency interest rate swaps | 19,239 | | | — | | | — | | | — | |
| Interest rate locks | — | | | — | | | 8,662 | | | — | |
Net investment hedges | | | | | | | |
Cross-currency interest rate swaps | 274,234 | | | — | | | 56,921 | | | 19,441 | |
| Foreign currency forward contracts | 25,077 | | | 4,805 | | | 156 | | | 70 | |
Total designated as hedging | 346,362 | | | 26,157 | | | 88,605 | | | 27,129 | |
| | | | | | | |
| Not designated as hedging instruments: | | | | | | | |
Embedded derivatives | — | | | — | | | 3,247 | | | 652 | |
Economic hedges of embedded derivatives | — | | | — | | | 2,232 | | | 637 | |
Foreign currency forward contracts | 58,230 | | | 7,531 | | | 83,265 | | | 5,854 | |
Total not designated as hedging | 58,230 | | | 7,531 | | | 88,744 | | | 7,143 | |
| Total Derivatives | $ | 404,592 | | | $ | 33,688 | | | $ | 177,349 | | | $ | 34,272 | |
(1)As presented in our consolidated balance sheets within other current assets and other assets.
(2)As presented in our consolidated balance sheets within other current liabilities and other liabilities.
Offsetting Derivative Assets and Liabilities
We enter into master netting agreements with our counterparties for transactions other than embedded derivatives to mitigate credit risk exposure to any single counterparty. Master netting agreements allow for individual derivative contracts with a single counterparty to offset in the event of default. For presentation on the consolidated balance sheets, we do not offset fair value amounts recognized for derivative instruments or the accrued interest related to cross-currency interest rate swaps under master netting arrangements. The following table presents information related to these offsetting arrangements as of December 31, 2022 and 2021 (in thousands):
| | | | | | | | | | | | | | | | | | | | | | | | | | | | | |
| Gross Amounts Offset in
Consolidated Balance Sheet | | | | |
| Gross Amounts | | Gross Amounts Offset in the Balance Sheet | | Net Amounts | | Gross Amounts not Offset in the Balance Sheet | | Net |
| December 31, 2022 | | | | | | | | | |
Derivative assets | $ | 424,516 | | | $ | — | | | $ | 424,516 | | | $ | (34,429) | | | $ | 390,087 | |
| Derivative liabilities | 39,234 | | | — | | | 39,234 | | | (34,429) | | | 4,805 | |
| | | | | | | | | |
| December 31, 2021 | | | | | | | | | |
Derivative assets | $ | 207,037 | | | $ | — | | | $ | 207,037 | | | $ | (47,538) | | | $ | 159,499 | |
| Derivative liabilities | 49,326 | | | — | | | 49,326 | | | (47,538) | | | 1,788 | |
EQUINIX, INC.
NOTES TO CONSOLIDATED FINANCIAL STATEMENTS - (Continued)
9. Fair Value Measurements
Valuation Methods
Fair value estimates are made as of a specific point in time based on methods using the market approach valuation method which uses prices and other relevant information generated by market transactions involving identical or comparable assets or liabilities or other valuation techniques. These techniques involve uncertainties and are affected by the assumptions used and the judgments made regarding risk characteristics of various financial instruments, discount rates, estimates of future cash flows, future expected loss experience and other factors.
Cash Equivalents. The fair value of our investments in money market funds approximates their face value. Such instruments are included in cash equivalents. Our money market funds are classified within Level 1 of the fair value hierarchy because they are valued using quoted prices for identical instruments in active markets. The fair value of our other investments, including certificates of deposit, approximates their face value. The fair value of these investments is priced based on the quoted market price for similar instruments or nonbinding market prices that are corroborated by observable market data. We determine the fair values of our Level 2 investments by using inputs such as actual trade data, benchmark yields, broker/dealer quotes and other similar data, which are obtained from quoted market prices, custody bank, third-party pricing vendors or other sources. We use such pricing data as the primary input to make its assessments and determinations as to the ultimate valuation of our investment portfolio and has not made, during the periods presented, any material adjustments to such inputs. We are responsible for our consolidated financial statements and underlying estimates.
We use the specific identification method in computing realized gains and losses. Realized gains and losses from the sale of investments are included within other income (expense) in our consolidated statements of operations. Our investments in publicly traded equity securities are carried at fair value. Unrealized gains and losses on publicly traded equity securities are reported within other income (expense) in our consolidated statements of operations.
Derivative Assets and Liabilities. Inputs used for valuations of derivatives are based upon quoted prices for similar instruments in active markets, quoted prices for identical or similar instruments in markets that are not active, and model-based valuation techniques for which all significant inputs are observable in the market or can be corroborated by observable market data. The significant inputs used include spot currency rates and forward points, interest rate curves, and published credit default swap rates of its foreign exchange trading counterparties and other comparable companies. We have determined that the inputs used to value its derivatives fall within Level 2 of the fair value hierarchy, therefore the derivatives are categorized as Level 2.
Other than the assets and liabilities that were classified as held for sale as described in Note 5 above, we did not have any nonfinancial assets or liabilities measured at fair value on a recurring basis during the years ended December 31, 2022 and 2021.
Our financial assets and liabilities measured at fair value on a recurring basis as of December 31, 2022 were as follows (in thousands):
| | | | | | | | | | | | | | | | | |
| Fair Value at December 31, 2022 | | Fair Value
Measurement Using |
| | Level 1 | | Level 2 |
| Assets: | | | | | |
| Money market and deposit accounts | $ | 764,628 | | | $ | 764,628 | | | $ | — | |
| | | | | |
| | | | | |
Derivative instruments (1) | 404,592 | | | — | | | 404,592 | |
| $ | 1,169,220 | | | $ | 764,628 | | | $ | 404,592 | |
| Liabilities: | | | | | |
Derivative instruments (1) | $ | 33,688 | | | $ | — | | | $ | 33,688 | |
(1)Amounts are included within other current assets, other assets, other current liabilities and other liabilities in the consolidated balance sheets.
EQUINIX, INC.
NOTES TO CONSOLIDATED FINANCIAL STATEMENTS - (Continued)
Our financial assets and liabilities measured at fair value on a recurring basis at December 31, 2021 were as follows (in thousands):
| | | | | | | | | | | | | | | | | |
| Fair Value at
December 31, | | Fair Value
Measurement Using |
| 2021 | | Level 1 | | Level 2 |
| Assets: | | | | | |
| Money market and deposit accounts | $ | 585,681 | | | $ | 585,681 | | | $ | — | |
| | | | | |
| | | | | |
Derivative instruments (1) | 177,349 | | | — | | | 177,349 | |
| $ | 763,030 | | | $ | 585,681 | | | $ | 177,349 | |
| Liabilities: | | | | | |
Derivative instruments (1) | $ | 34,272 | | | $ | — | | | $ | 34,272 | |
(1)Amounts are included within other current assets, other assets, other current liabilities and other liabilities in the consolidated balance sheets.
We did not have any Level 3 financial assets or financial liabilities during the years ended December 31, 2022 and 2021.
10. Leases
Significant Lease Transactions
The following table summarizes the significant lease transactions during the year ended December 31, 2022 (in thousands):
| | | | | | | | | | | | | | | | | | | | | | | | | | | | | | | | | | | | | | | | |
| | | | | | | | Renewal/Termination Options Excluded (1) | | | | Net Incremental (1) |
| Lease | | Quarter | | Transaction | | | | | Lease Classification | | ROU assets | | ROU liabilities |
Atlanta 1 ("AT1") data center lease extended & expansion (2) | | Q1 | | Extended lease term by 12 years with additional three 10-year renewal options | | | | Two 10-year renewal options | | Finance Lease | | $71,994 | | $72,549 |
| | | | | | Operating Lease | | (1,836) | | (2,391) |
| Hong Kong 6 ("HK6") new land and building construction site | | Q2 | | New lease with a 15 year term | | | | 5-year renewal option | | Operating Lease | | 195,245 | | 195,245 |
| |
| Hong Kong 2 ("HK2") data center lease renewal | | Q2 | | Exercised the 3-year renewal option for Phase 1 & 2 (3) | | | | Two 3-year renewal option | | Operating Lease | | 81,504 | | 81,504 |
|
| New York 3 ("NY3") data center lease amendment | | Q4 | | 26 year lease term after modification to remove early termination option | | | | One 20-year renewal option and one 5-year renewal option | | Finance Lease | | 140,215 | | 140,215 |
(1) The net incremental amounts represent the adjustments to the right of use ("ROU") assets and liabilities recorded during the quarter that the transactions were entered.
(2) This lease had components previously classified as operating leases.
(3) The incremental balance includes the impact of reassessing lease terms of complementary leases within HK2, resulting in new lease end dates ranging from June 2030 to October 2031 from including renewal options that are reasonably certain to be exercised.
EQUINIX, INC.
NOTES TO CONSOLIDATED FINANCIAL STATEMENTS - (Continued)
Lease Expenses
The components of lease expenses are as follows (in thousands):
| | | | | | | | | | | |
| Years Ended December 31, |
| 2022 | | 2021 |
| Finance lease cost | | | |
Amortization of right-of-use assets (1) | $ | 161,061 | | | $ | 157,057 | |
Interest on lease liabilities | 112,518 | | | 117,896 | |
Total finance lease cost | 273,579 | | | 274,953 | |
| | | |
| Operating lease cost | 213,619 | | | 221,776 | |
| Variable lease cost | 41,237 | | | 33,066 | |
| Total lease cost | $ | 528,435 | | | $ | 529,795 | |
(1) Amortization of right-of-use assets is included within depreciation expense, and is recorded within cost of revenues, sales and marketing and general and administrative expenses in the consolidated statements of operations.
Other Information
Other information related to leases is as follows (in thousands, except years and percent):
| | | | | | | | | | | |
| Years Ended December 31, |
| 2022 | | 2021 |
| Cash paid for amounts included in the measurement of lease liabilities: | | | |
| Operating cash flows from finance leases | $ | 109,514 | | | $ | 113,571 | |
| Operating cash flows from operating leases | 197,356 | | | 258,719 | |
| Financing cash flows from finance leases | 134,202 | | | 165,539 | |
| | | |
Right-of-use assets obtained in exchange for lease obligations: (1) | | | |
| Finance leases | $ | 293,858 | | | $ | 412,214 | |
| Operating leases | 355,040 | | | 10,446 | |
| | | |
| As of December 31, |
| 2022 | | 2021 |
Weighted-average remaining lease term - finance leases (2) | 15 years | | 14 years |
Weighted-average remaining lease term - operating leases (2) | 12 years | | 12 years |
| Weighted-average discount rate - finance leases | 6 | % | | 7 | % |
| Weighted-average discount rate - operating leases | 4 | % | | 4 | % |
Finance lease ROU assets (3) | $ | 2,018,070 | | | $ | 1,875,696 | |
(1) Represents all non-cash changes in ROU assets.
(2) Includes lease renewal options that are reasonably certain to be exercised.
(3) As of December 31, 2022 and 2021, we recorded accumulated amortization of finance lease assets of $840.0 million and $726.4 million, respectively. Finance lease assets are recorded within property, plant and equipment, net on the consolidated balance sheets.
EQUINIX, INC.
NOTES TO CONSOLIDATED FINANCIAL STATEMENTS - (Continued)
Maturities of Lease Liabilities
Maturities of lease liabilities as of December 31, 2022 are as follows (in thousands):
| | | | | | | | | | | | | | | | | | | | |
| Year ended December 31, | | Operating Leases | | Finance Leases | | Total |
| 2023 | | $ | 181,461 | | | $ | 263,052 | | | $ | 444,513 | |
| 2024 | | 190,939 | | | 257,457 | | | 448,396 | |
| 2025 | | 185,430 | | | 276,825 | | | 462,255 | |
| 2026 | | 182,117 | | | 245,798 | | | 427,915 | |
| 2027 | | 158,465 | | | 248,767 | | | 407,232 | |
| Thereafter | | 1,010,606 | | | 2,191,044 | | | 3,201,650 | |
| Total lease payments | | 1,909,018 | | | 3,482,943 | | | 5,391,961 | |
| | | | | | |
| Less imputed interest | | (496,668) | | | (1,187,833) | | | (1,684,501) | |
| Total | | $ | 1,412,350 | | | $ | 2,295,110 | | | $ | 3,707,460 | |
We entered into agreements with various landlords primarily to lease data center spaces and ground leases which have not yet commenced as of December 31, 2022. These leases will commence between year 2023 and 2025, with lease terms of 2 to 26 years and total lease commitments of approximately $424.7 million.
11. Debt Facilities
Mortgage and Loans Payable
As of December 31, 2022 and 2021, our mortgage and loans payable consisted of the following (in thousands):
| | | | | | | | | | | |
| 2022 | | 2021 |
| Term loans | $ | 619,090 | | | $ | 549,697 | |
| Mortgage payable and loans payable | 34,527 | | | 68,691 | |
| 653,617 | | | 618,388 | |
| Less amount representing unamortized debt discount and debt issuance cost | (1,062) | | | (354) | |
| Add amount representing unamortized mortgage premium | — | | | 1,630 | |
| 652,555 | | | 619,664 | |
| Less current portion | (9,847) | | | (33,087) | |
| $ | 642,708 | | | $ | 586,577 | |
Senior Credit Facility and Refinancing
In 2017, we entered into a credit agreement (the "2017 Credit Agreement") with a group of lenders for a $3.0 billion credit facility (the "2017 Credit Facilities"), comprised of a $2.0 billion senior unsecured multicurrency revolving credit facility (the "2017 Revolving Facility") and an approximately $1.0 billion senior unsecured multicurrency term loan facility (the "2017 Term Loan Facility"). The credit agreement was subsequently amended to provide an additional senior unsecured term loan in Japanese Yen for approximately $424.7 million at the exchange rate effective on the transaction date.
EQUINIX, INC.
NOTES TO CONSOLIDATED FINANCIAL STATEMENTS - (Continued)
On May 17, 2021, we repaid our outstanding term loans in Swedish Krona and Japanese Yen under the 2017 Term Loan Facility for $285.4 million and $374.5 million in U.S. Dollars, respectively, at the exchange rates in effect on May 17, 2021 using a portion of the cash proceeds from the 2026 Notes, 2028 Notes, 2031 Notes, and 2052 Notes issuances as described below.
On January 7, 2022, we entered into a credit agreement (the "2022 Credit Agreement") with a group of lenders for a senior unsecured credit facility, comprised of a $4.0 billion senior unsecured multicurrency revolving credit facility (the "2022 Revolving Facility") and a £500.0 million senior unsecured term loan facility (the "2022 Term Loan Facility" and, together with the 2022 Revolving Facility, collectively, the "2022 Credit Facilities"). The total debt issuance costs for the 2022 Revolving Facility and 2022 Term Loan Facility are $6.5 million and $0.8 million, respectively. We borrowed the full £500.0 million available under the 2022 Term Loan Facility, or approximately $676.9 million at the exchange rates in effect on that date. On that same day, using a portion of the proceeds from the 2022 Term Loan Facility, we prepaid in full all of the $549.6 million of indebtedness outstanding under the 2017 Term Loan Facility, at the exchange rates in effect on January 7, 2022 and terminated the 2017 Credit Agreement. In connection with the repayment and termination, we incurred an insignificant amount of loss on debt extinguishment. The remaining unamortized debt issuance costs of the 2017 Credit Facilities will continue to be amortized over the contract terms of the 2022 Credit Facilities.
The 2022 Credit Facilities have a maturity date of January 7, 2027. We may borrow, repay and reborrow amounts under the 2022 Revolving Facility until the Maturity Date, at which time all amounts outstanding under the 2022 Revolving Facility must be repaid in full. The term loan made under the 2022 Term Loan Facility has no scheduled principal amortization and must be repaid in full on the maturity date. The 2022 Revolving Credit Facility provides for extensions of credit in U.S. Dollars as well as certain other foreign currencies. Borrowings under the 2022 Revolving Facility bear interest at a rate based on the daily Secured Overnight Financing Rate ("SOFR"), term SOFR, an alternative currency daily rate, or an alternative currency term rate plus a spread adjustment, plus a margin that can vary from 0.555% to 1.200%. Borrowings under the 2022 Term Loan Facility bear interest at a rate based on the daily Sterling Overnight Index Average ("SONIA"), plus a spread adjustment, plus a margin that can vary from 0.625% to 1.450%. We are also required to pay a quarterly letter of credit fee on the face amount of each letter of credit, which fee is based on the same margin that applies from time to time to SOFR-indexed borrowings under the revolving credit line. The margin is dependent on either our consolidated net leverage ratio or our credit ratings. We are also required to pay a quarterly facility fee ranging from 0.07% to 0.25% per annum. The 2022 Credit Agreement contains customary covenants, including financial ratio covenants that are required to be maintained as of each quarter end.
As of December 31, 2022 and 2021, the total amounts outstanding under the 2022 Term Loan Facility and 2017 Term Loan Facility, net of debt issuance costs, were $603.0 million and $549.3 million, respectively.
As of December 31, 2022, we had 60 irrevocable letters of credit totaling $84.7 million issued and outstanding under the 2022 Revolving Facility, with approximately $3.9 billion remaining available to borrow under the 2022 Revolving Facility.
EQUINIX, INC.
NOTES TO CONSOLIDATED FINANCIAL STATEMENTS - (Continued)
Senior Notes
Our senior notes consisted of the following as of December 31 (in thousands):
| | | | | | | | | | | | | | | | | | | | | | | | | | | | | | | | | | | | | | |
| | | | | | 2022 | | 2021 |
| Senior Notes | | Issuance Date | | Maturity Date | | Amount | | Effective Rate | | Amount | | Effective Rate |
2.625% Senior Notes due 2024 | | November 2019 | | November 2024 | | $ | 1,000,000 | | | 2.79 | % | | $ | 1,000,000 | | | 2.79 | % |
1.250% Senior Notes due 2025 | | June 2020 | | July 2025 | | 500,000 | | | 1.46 | % | | 500,000 | | | 1.46 | % |
1.000% Senior Notes due 2025 | | October 2020 | | September 2025 | | 700,000 | | | 1.18 | % | | 700,000 | | | 1.18 | % |
2.900% Senior Notes due 2026 | | November 2019 | | November 2026 | | 600,000 | | | 3.04 | % | | 600,000 | | | 3.04 | % |
1.450% Senior Notes due 2026 | | May 2021 | | May 2026 | | 700,000 | | | 1.64 | % | | 700,000 | | | 1.64 | % |
0.250% Euro Senior Notes due 2027 | | March 2021 | | March 2027 | | 534,950 | | | 0.45 | % | | 569,150 | | | 0.45 | % |
1.800% Senior Notes due 2027 | | June 2020 | | July 2027 | | 500,000 | | | 1.96 | % | | 500,000 | | | 1.96 | % |
1.550% Senior Notes due 2028 | | October 2020 | | March 2028 | | 650,000 | | | 1.67 | % | | 650,000 | | | 1.67 | % |
2.000% Senior Notes due 2028 | | May 2021 | | May 2028 | | 400,000 | | | 2.21 | % | | 400,000 | | | 2.21 | % |
3.200% Senior Notes due 2029 | | November 2019 | | November 2029 | | 1,200,000 | | | 3.30 | % | | 1,200,000 | | | 3.30 | % |
2.150% Senior Notes due 2030 | | June 2020 | | July 2030 | | 1,100,000 | | | 2.27 | % | | 1,100,000 | | | 2.27 | % |
2.500% Senior Notes due 2031 | | May 2021 | | May 2031 | | 1,000,000 | | | 2.65 | % | | 1,000,000 | | | 2.65 | % |
3.900% Senior Notes due 2032 | | April 2022 | | April 2032 | | 1,200,000 | | | 4.07 | % | | — | | | — | % |
1.000% Euro Senior Notes due 2033 | | March 2021 | | March 2033 | | 641,940 | | | 1.18 | % | | 682,980 | | | 1.18 | % |
3.000% Senior Notes due 2050 | | June 2020 | | July 2050 | | 500,000 | | | 3.09 | % | | 500,000 | | | 3.09 | % |
2.950% Senior Notes due 2051 | | October 2020 | | September 2051 | | 500,000 | | | 3.00 | % | | 500,000 | | | 3.00 | % |
3.400% Senior Notes due 2052 | | May 2021 | | February 2052 | | 500,000 | | | 3.50 | % | | 500,000 | | | 3.50 | % |
| | | | | | 12,226,890 | | | | | 11,102,130 | | | |
| Less amount representing unamortized debt discount and debt issuance cost | | (117,351) | | | | | (117,986) | | | |
| | | | | | 12,109,539 | | | | | 10,984,144 | | | |
| Less current portion | | | | | | — | | | | | — | | | |
| | | | | | $ | 12,109,539 | | | | | $ | 10,984,144 | | | |
0.250% Euro Senior Notes due 2027 and 1.000% Euro Senior Notes due 2033
On March 10, 2021, we issued €500.0 million, or approximately $594.9 million in U.S. dollars, at the exchange rate in effect on March 10, 2021, aggregate principal amount of 0.250% senior notes due March 15, 2027 (the "2027 Euro Notes") and €600.0 million, or approximately $713.8 million in U.S. dollars, at the exchange rate in effect on March 10, 2021, aggregate principal amount of 1.000% senior notes due March 15, 2033 (the "2033 Euro Notes").
Interest on the notes is payable annually in arrears on March 15 of each year, commencing on March 15, 2022. Total debt issuance costs and debt discounts related to the 2027 Euro Notes and the 2033 Euro Notes were $7.0 million and $14.1 million, respectively.
Redemption of 2.875% Euro Senior Notes due 2026
On March 24, 2021, using a portion of the net cash proceeds from the 2027 Euro Senior Notes and 2033 Euro Senior Notes, we redeemed the remaining outstanding 2.875% Euro Senior Notes due 2026 for $590.7 million in U.S. dollars, at the exchange rate in effect on March 24, 2021. In connection with the redemption, we incurred $13.2 million of loss on debt extinguishment, including $8.5 million in redemption premium that was paid in cash and $4.7 million related to the write-off of unamortized debt issuance costs, during the year ended December 31, 2021.
1.450% Senior Notes due 2026, 2.000% Senior Notes due 2028, 2.500% Senior Notes due 2031 and 3.400% Senior Notes due 2052
EQUINIX, INC.
NOTES TO CONSOLIDATED FINANCIAL STATEMENTS - (Continued)
On May 17, 2021, we issued $700.0 million aggregate principal amount of 1.450% senior notes due 2026 (the "2026 Notes"), $400.0 million aggregate principal amount of 2.000% senior notes due 2028 (the "2028 Notes"), $1.0 billion aggregate principal amount of 2.500% senior notes due 2031 (the "2031 Notes"), and $500.0 million aggregate principal amount of 3.400% senior notes due 2052 (the "2052 Notes").
Interest on the 2026, 2028 and 2031 notes are payable semi-annually on May 15 and November 15 of each year, commencing on November 15, 2021. Interest on the 2052 notes are payable semi-annually on February 15 and August 15 of each year, commencing on February 15, 2022. Total debt issuance costs and debt discounts related to the 2026 Notes, 2028 Notes, 2031 Notes and 2052 Notes were $6.4 million, $5.3 million, $13.0 million and $9.3 million, respectively.
Redemption of 5.375% Senior Notes due 2027
On June 2, 2021, we redeemed all outstanding principal amount under the 5.375% Senior Notes due 2027 with a portion of the net cash proceeds from the issuance of the 2026 Notes, 2028 Notes, 2031 Notes, and 2052 Notes as described above. In connection with the redemption, we incurred $100.6 million of loss on debt extinguishment, including $90.7 million redemption premium that was paid in cash and $9.9 million related to the write-off of unamortized debt issuance costs.
3.900% Senior Notes due 2032
On April 5, 2022, we issued $1.2 billion aggregate principal amount of 3.900% Senior Notes due 2032 (the "2032 Notes"). Interest on the 2032 Notes is payable semi-annually on April 15 and October 15 of each year, commencing on October 15, 2022. Debt issuance costs and debt discounts related to the 2032 Notes were $16.3 million.
All of our senior notes are unsecured and rank equal in right of payment to our existing or future senior indebtedness and senior in right of payment to our existing and future subordinated indebtedness. Interest on the senior notes is paid semi-annually in arrears, with the exception of our Euro senior notes which is paid annually in arrears. The senior notes are effectively subordinated to all of the existing and future secured debt, including debt outstanding under any bank facility or secured by any mortgage, to the extent of the assets securing such debt. They are also structurally subordinated to any existing and future indebtedness and other liabilities (including trade payables) of any of our subsidiaries.
Each series of senior notes is governed by an indenture and a supplemental indenture between us and U.S. Bank National Association, as trustee. These supplemental indentures contain covenants that limit our ability and the ability of our subsidiaries to, among other things:
•incur liens;
•enter into sale-leaseback transactions; and
•merge or consolidate with any other person.
As of December 31, 2022, we are in compliance with all covenants. Subject to compliance with the limitations described above, we may issue an unlimited principal amount of additional notes at later dates under the same indenture as the senior notes.
We are not required to make any mandatory redemption with respect to the senior notes; however, upon the event of a change in control, we may be required to offer to purchase the senior notes.
Optional Redemption
With respect to the rest of the Notes listed below, we may redeem at our election, at any time or from time to time, some or all of the notes of any series before they mature. The redemption price will equal the sum of (1) an amount equal to one hundred percent (100%) of the principal amount of the notes being redeemed plus accrued and unpaid interest up to, but not including, the redemption date and (2) a make-whole premium. If the Notes are
EQUINIX, INC.
NOTES TO CONSOLIDATED FINANCIAL STATEMENTS - (Continued)
redeemed on or after the First Par Call Date listed in the table below, the redemption price will not include a make-whole premium for the applicable notes.
| | | | | | | |
| Senior Notes Description | First Par Call Date | | |
2.625% Senior Notes due 2024 | October 18, 2024 | | |
1.250% Senior Notes due 2025 | June 15, 2025 | | |
1.000% Senior Notes due 2025 | August 15, 2025 | | |
1.450% Senior Notes due 2026 | April 15, 2026 | | |
2.900% Senior Notes due 2026 | September 18, 2026 | | |
0.250% Euro Senior Notes due 2027 | January 15, 2027 | | |
1.800% Senior Notes due 2027 | May 15, 2027 | | |
1.550% Senior Notes due 2028 | January 15, 2028 | | |
2.000% Senior Notes due 2028 | March 15, 2028 | | |
3.200% Senior Notes due 2029 | August 18, 2029 | | |
2.150% Senior Notes due 2030 | April 15, 2030 | | |
2.500% Senior Notes due 2031 | February 15, 2031 | | |
3.900% Senior Notes due 2032 | January 15, 2032 | | |
1.000% Euro Senior Notes due 2033 | December 15, 2032 | | |
3.000% Senior Notes due 2050 | January 15, 2050 | | |
2.950% Senior Notes due 2051 | March 15, 2051 | | |
3.400% Senior Notes due 2052 | August 15, 2051 | | |
Maturities of Debt Instruments
The following table sets forth maturities of our debt, including mortgage and loans payable, and senior notes, gross of debt issuance costs, debt discounts and debt premiums, as of December 31, 2022 (in thousands):
| | | | | |
| Years ending: | |
| 2023 | $ | 9,847 | |
| 2024 | 1,009,469 | |
| 2025 | 1,208,077 | |
| 2026 | 1,307,656 | |
| 2027 | 1,644,202 | |
| Thereafter | 7,701,256 | |
| $ | 12,880,507 | |
Fair Value of Debt Instruments
The following table sets forth the estimated fair values of our mortgage and loans payable and senior notes, including current maturities, as of December 31 (in thousands):
| | | | | | | | | | | |
| 2022 | | 2021 |
| Mortgage and loans payable | $ | 666,387 | | | $ | 621,051 | |
| | | |
| Senior notes | 10,196,933 | | | 11,049,834 | |
| | | |
The fair values of the mortgage and loans payable, which are not publicly traded, were estimated by considering our credit rating, current rates available to us for debt of the same remaining maturities and terms of the debt (Level
EQUINIX, INC.
NOTES TO CONSOLIDATED FINANCIAL STATEMENTS - (Continued)
2). The fair value of the senior notes, which are traded in the public debt market, was based on quoted market prices (Level 1).
Interest Charges
The following table sets forth total interest costs incurred, and total interest costs capitalized for the years ended December 31 (in thousands):
| | | | | | | | | | | | | | | | | |
| 2022 | | 2021 | | 2020 |
| Interest expense | $ | 356,337 | | | $ | 336,082 | | | $ | 406,466 | |
| Interest capitalized | 18,152 | | | 24,505 | | | 26,750 | |
| Interest charges incurred | $ | 374,489 | | | $ | 360,587 | | | $ | 433,216 | |
Total interest paid in cash, net of capitalized interest, during the years ended December 31, 2022, 2021 and 2020 was $412.1 million, $401.9 million and $471.7 million, respectively.
12. Stockholders' Equity
Our authorized share capital is 300,000,000 shares of common stock and 100,000,000 shares of preferred stock, of which 25,000,000 is designated Series A, 25,000,000 is designated as Series A-1 and 50,000,000 is undesignated. As of December 31, 2022 and 2021, we had no preferred stock issued and outstanding.
Common Stock
In May 2020, we issued and sold 2,587,500 shares of common stock in a public offering pursuant to a registration statement and a related prospectus and prospectus supplement. We received net proceeds of approximately $1.7 billion, net of underwriting discounts, commissions and offering expenses.
In October 2020, we established an "at the market" equity offering program (the "2020 ATM Program"), under which we could, from time to time, offer and sell shares of our common stock to or through sales agents up to an aggregate of $1.5 billion. In February 2022, we entered into a forward sale amendment to the 2020 ATM Program, under which we could, from time to time, offer and sell shares under the equity distribution agreement pursuant to forward sale transactions (the "Equity Forward Amendment"). In November 2022, we established a successor ATM program, also with substantially the same terms as the Equity Forward Amendment noted above, under which we may, from time to time, offer and sell on a spot or forward basis up to an aggregate of $1.5 billion of our common stock to or through sales agents in "at the market" transactions (the "2022 ATM Program"). The forward sale agreements provide three settlement alternatives to us: physical settlement, cash settlement or net share settlement. In accordance with ASC 815, the forward sale agreements are classified as equity for balance sheet purposes. During the first half of the year, we executed five forward sale agreements under the 2020 ATM Program to sell 579,873 shares of our common stock. On August 3, 2022, we physically settled these forward sale shares for approximately $393.6 million, net of payment of commissions to sales agents and other offering expenses, at an aggregate weighted-average forward sale price of $678.72 per share. In the fourth quarter of 2022, we executed three additional forward sale agreements to sell 458,459 shares of our common stock with maturity dates ranging from February 2023 to November 2023. Of this amount, 308,875 shares were executed under the 2020 ATM Program and the remaining 149,584 shares were executed under the 2022 ATM Program. The future net settlement value for these forward sale agreements is approximately $301.6 million at an aggregate weighted-average forward sale price of $657.75 per share.
For the year ended December 31, 2022, we sold an additional 580,833 shares, excluding the forward sale transactions noted above, for approximately $403.6 million, net of payment of commissions to sales agents and other offering expenses, under the 2020 ATM Program. As of December 31, 2022, after giving effect to the unsettled forward sale transactions noted above, no shares remained available for sale under the 2020 ATM Program. For the year ended December 31, 2021, we sold 637,617 shares for approximately $497.9 million, net of payment of commissions to sales agents and other offering expenses, under the 2020 ATM Program. For the year ended December 31, 2020, we sold 415,512 shares for approximately $298.3 million, net of payment of commissions to sales agents and other offering expenses under the 2018 ATM Program.
EQUINIX, INC.
NOTES TO CONSOLIDATED FINANCIAL STATEMENTS - (Continued)
As of December 31, 2022, we had $1.4 billion of common stock available for sale under the 2022 ATM Program, which amount gives effect to the unsettled forward sale transaction noted above. For the year ended December 31, 2022, no shares were issued under the 2022 ATM Program.
As of December 31, 2022, we had reserved the following authorized but unissued shares of common stock for future issuances:
| | | | | |
| Common stock options and restricted stock units | 4,658,781 | |
| Common stock employee purchase plans | 2,497,134 | |
| Total | 7,155,915 | |
Accumulated Other Comprehensive Loss
The changes in accumulated other comprehensive loss, net of tax, by components are as follows (in thousands):
| | | | | | | | | | | | | | | | | | | | | | | | | | | | | | | | | | | | | | | | | | | |
| December 31, 2019 | | Net
Change | | December 31, 2020 | | Net
Change | | December 31, 2021 | | Net
Change | | | | December 31, 2022 |
Foreign currency translation adjustment ("CTA") gain (loss) | $ | (1,056,918) | | | $ | 548,503 | | | $ | (508,415) | | | $ | (559,984) | | | $ | (1,068,399) | | | $ | (769,838) | | | | | $ | (1,838,237) | |
Unrealized gain (loss) on cash flow hedges (1) | 15,638 | | | (82,790) | | | (67,152) | | | 60,562 | | | (6,590) | | | 40,543 | | | | | 33,953 | |
Net investment hedge CTA gain (loss) (1) | 107,619 | | | (444,553) | | | (336,934) | | | 326,982 | | | (9,952) | | | 425,701 | | | | | 415,749 | |
| | | | | | | | | | | | | | | |
Net actuarial gain (loss) on defined benefit plans (2) | (952) | | | 85 | | | (867) | | | 57 | | | (810) | | | (101) | | | | | (911) | |
| $ | (934,613) | | | $ | 21,245 | | | $ | (913,368) | | | $ | (172,383) | | | $ | (1,085,751) | | | $ | (303,695) | | | | | $ | (1,389,446) | |
(1)Refer to Note 8 for a discussion of the amounts reclassified from accumulated other comprehensive loss to net income.
(2)We have a defined benefit pension plan covering all employees in two countries where such plans are mandated by law. We do not have any defined benefit plans in any other countries. The unamortized gain (loss) on defined benefit plans includes gains or losses resulting from a change in the value of either the projected benefit obligation or the plan assets resulting from a change in an actuarial assumption, net of amortization.
Changes in foreign currencies can have a significant impact to our consolidated balance sheets (as evidenced above in our foreign currency translation loss), as well as its consolidated results of operations, as amounts in foreign currencies are generally translated into more U.S. dollars when the U.S. dollar weakens or less U.S. dollars when the U.S. dollar strengthens. As of December 31, 2022, the U.S. dollar was generally stronger relative to certain of the currencies of the foreign countries in which we operate as compared to December 31, 2021. Because of this, the U.S. dollar had an overall unfavorable impact on our consolidated financial position because the foreign denominations translated into fewer U.S. dollars as evidenced by an increase in foreign currency translation loss for the year ended December 31, 2022 as reflected in the above table. The volatility of the U.S. dollar as compared to the other currencies in which we operate could have a significant impact on our consolidated financial position and results of operations including the amount of revenue that we report in future periods.
EQUINIX, INC.
NOTES TO CONSOLIDATED FINANCIAL STATEMENTS - (Continued)
Dividends
During the years ended December 31, 2022, 2021 and 2020, our Board of Directors declared quarterly dividends whose treatment for federal income tax purposes were as follows:
| | | | | | | | | | | | | | | | | | | | | | | | | | | | | | | | | | | | |
| Declaration Date | | Record Date | | Payment Date | | Total Distribution (1) | | Nonqualified Ordinary Dividend (2) | | Total Distribution Amount | | | | |
| | | | | | (per share) | | (in thousands) | | | | |
| Fiscal 2022 | | | | | | | | | | | | | | |
| 2/16/2022 | | 3/7/2022 | | 3/23/2022 | | $ | 3.100000 | | | $ | 3.100000 | | | $ | 282,031 | | | | | |
| 4/27/2022 | | 5/18/2022 | | 6/15/2022 | | 3.100000 | | | 3.100000 | | | 282,168 | | | | | |
| 7/27/2022 | | 8/17/2022 | | 9/21/2022 | | 3.100000 | | | 3.100000 | | | 286,136 | | | | | |
| 11/2/2022 | | 11/16/2022 | | 12/14/2022 | | 3.100000 | | | 3.100000 | | | 286,868 | | | | | |
Total | | | | | | $ | 12.400000 | | | $ | 12.400000 | | | $ | 1,137,203 | | | | | |
| | | | | | | | | | | | | | |
| Fiscal 2021 | | | | | | | | | | | | | | |
| 2/10/2021 | | 2/24/2021 | | 3/17/2021 | | $ | 2.870000 | | | $ | 2.870000 | | | $ | 256,321 | | | | | |
| 4/28/2021 | | 5/19/2021 | | 6/16/2021 | | 2.870000 | | | 2.870000 | | | 257,199 | | | | | |
| 7/28/2021 | | 8/18/2021 | | 9/22/2021 | | 2.870000 | | | 2.870000 | | | 257,769 | | | | | |
| 11/3/2021 | | 11/17/2021 | | 12/15/2021 | | 2.870000 | | | 2.870000 | | | 258,716 | | | | | |
Total | | | | | | $ | 11.480000 | | | $ | 11.480000 | | | $ | 1,030,005 | | | | | |
| | | | | | | | | | | | | | |
| Fiscal 2020 | | | | | | | | | | | | | | |
| 2/12/2020 | | 2/26/2020 | | 3/18/2020 | | $ | 2.660000 | | | $ | 2.660000 | | | $ | 227,386 | | | | | |
| 5/6/2020 | | 5/20/2020 | | 6/17/2020 | | 2.660000 | | | 2.660000 | | | 235,449 | | | | | |
| 7/29/2020 | | 8/19/2020 | | 9/23/2020 | | 2.660000 | | | 2.660000 | | | 236,424 | | | | | |
| 10/28/2020 | | 11/18/2020 | | 12/9/2020 | | 2.660000 | | | 2.660000 | | | 237,010 | | | | | |
Total | | | | | | $ | 10.640000 | | | $ | 10.640000 | | | $ | 936,269 | | | | | |
(1)Common stock dividends are characterized for federal income tax purposes as nonqualified ordinary dividend, qualified ordinary dividend, capital gains or return of capital. During the years ended December 31, 2022, 2021 and 2020, we did not classify any portion of the distributions as qualified ordinary dividend, capital gains or return of capital.
(2)All nonqualified ordinary dividends are eligible for the 20% deduction generally allowable to non-corporate shareholders under Internal Revenue Code Section 199A.
In addition, as of December 31, 2022, for dividends and special distributions attributed to the RSUs, we recorded a short-term dividend payable of $12.3 million and a long-term dividend payable of $10.4 million for the RSUs that have not yet vested. As of December 31, 2021, for dividends and special distributions attributed to the RSUs, we recorded a short-term dividend payable of $12.0 million and a long-term dividend payable of $9.7 million for the RSUs that have not yet vested.
13. Stock-Based Compensation
Equity Compensation Plans
As of December 31, 2022, our equity compensation plans included:
•2004 Employee Stock Purchase Plan (the "2004 Purchase Plan"): The 2004 Purchase Plan permits eligible employees to purchase common stock on favorable terms via payroll deductions of up to 15% of the employee's cash compensation, subject to certain share and statutory dollar limits. Two overlapping offering periods commence during each calendar year, on each February 15 and August 15 or such other periods or dates as determined by the Compensation Committee from time to time, and the offering periods last up to 24 months with a purchase date every 6 months. The price of each share purchased is 85% of the lower of
EQUINIX, INC.
NOTES TO CONSOLIDATED FINANCIAL STATEMENTS - (Continued)
a) the fair value per share of common stock on the last trading day before the commencement of the applicable offering period or b) the fair value per share of common stock on the purchase date.
•2020 Equity Incentive Plan: In 2020, both our Board of Directors and our stockholders approved the 2020 Equity Plan, which provides for the grant of stock options, including incentive stock options and non-qualified stock options, stock appreciation rights, RSAs, RSUs, other stock-based incentive awards, dividend equivalents, and cash-based incentive awards. The 2020 Equity Plan's awards may be granted to employees, non-employee members of the Board and consultants. Equity awards granted under the 2020 Equity Incentive Plan generally vest over four years. The maximum numbers of shares of our common stock available for issuance under the 2020 Equity Plan is equal to the sum of 4.0 million shares and the shares transferred from the 2000 Equity Incentive Plan.
The Equity compensation plans are administered by the Talent, Culture and Compensation Committee of the Board of Directors (the "Compensation Committee"), and the Compensation Committee may terminate or amend these plans, with approval of the stockholders as may be required by applicable law, at any time. As of December 31, 2022, shares reserved and available for issuance under the equity compensation plans are as follows:
| | | | | | | | | | | |
| Shares reserved | | Shares available for grant |
| | | |
| | | |
| 2004 Purchase Plan | 5,392,206 | | | 2,497,134 | |
| 2020 Equity Incentive Plan | 4,403,832 | | | 3,213,089 | |
Restricted Stock Units
Since 2008, we primarily grant RSUs to our employees, including executives and non-employee directors, in lieu of stock options. We generally grant RSUs that have a service condition only or have both a service and performance condition. Each RSU is not considered issued and outstanding and does not have voting rights until it is converted into one share of our common stock upon vesting. RSUs activity is summarized as follows:
| | | | | | | | | | | | | | | | | | | | | | | |
| Number of Shares Outstanding | | Weighted Average Grant Date Fair Value per Share | | Weighted Average Remaining Contractual Life (Years) | | Aggregate Intrinsic Value (1) (Dollars in Thousands) |
| RSUs outstanding, December 31, 2019 | 1,312,725 | | | $ | 411.99 | | | | | |
| RSUs granted | 695,383 | | | 596.80 | | | | | |
| | | | | | | |
| RSUs released, vested | (606,250) | | | 426.03 | | | | | |
| Special distribution shares released | (722) | | | 264.57 | | | | | |
| RSUs canceled | (63,502) | | | 457.91 | | | | | |
| | | | | | | |
| RSUs outstanding, December 31, 2020 | 1,337,634 | | | 499.60 | | | | | |
| RSUs granted | 776,628 | | | 679.59 | | | | | |
| | | | | | | |
| RSUs released, vested | (633,466) | | | 505.40 | | | | | |
| Special distribution shares released | (34) | | | 297.03 | | | | | |
| RSUs canceled | (123,168) | | | 561.34 | | | | | |
| | | | | | | |
| RSUs outstanding, December 31, 2021 | 1,357,594 | | | 594.27 | | | | | |
| RSUs granted | 912,249 | | | 661.43 | | | | | |
| | | | | | | |
| RSUs released, vested | (668,733) | | | 576.62 | | | | | |
| | | | | | | |
| RSUs canceled | (155,418) | | | 624.98 | | | | | |
| | | | | | | |
| RSUs outstanding, December 31, 2022 | 1,445,692 | | | $ | 641.51 | | | 1.26 | | $ | 946,971 | |
(1)The intrinsic value is calculated based on the market value of the stock as of December 31, 2022.
EQUINIX, INC.
NOTES TO CONSOLIDATED FINANCIAL STATEMENTS - (Continued)
The total fair value of RSUs vested and released during the years ended December 31, 2022, 2021 and 2020 was $462.0 million, $472.9 million and $417.0 million, respectively.
Employee Stock Purchase Plan
We provide the following disclosures for the 2004 Purchase Plan as of December 31 (dollars, except shares):
| | | | | | | | | | | | | | | | | |
| 2022 | | 2021 | | 2020 |
| Weighted-average purchase price per share | $ | 568.29 | | | $ | 467.59 | | | $ | 371.71 | |
| Weighted average grant-date fair value per share of shares purchased | $ | 202.61 | | | $ | 138.80 | | | $ | 114.08 | |
| Number of shares purchased | 143,515 | | | 166,023 | | | 167,113 | |
We use the Black-Scholes option-pricing model to determine the fair value of shares under the 2004 Purchase Plan with the following assumptions during the years ended December 31:
| | | | | | | | | | | | | | | | | |
| 2022 | | 2021 | | 2020 |
| Range of dividend yield | 1.48% - 1.55% | | 1.58 - 1.77% | | 1.94 - 2.08% |
| Range of risk-free interest rate | 0.72% - 3.06% | | 0.01 - 0.21% | | 0.10 - 1.55% |
| Range of expected volatility | 25.73% - 37.20% | | 25.54 - 41.24% | | 19.28 - 51.93% |
| Weighted-average expected volatility | 30.34 | % | | 34.08 | % | | 32.94 | % |
| Weighted average expected life (in years) | 1.06 | | 1.18 | | 1.36 |
Stock-Based Compensation
The following table presents, by operating expense, our stock-based compensation expense recognized in our consolidated statement of operations for the years ended December 31 (in thousands):
| | | | | | | | | | | | | | | | | |
| 2022 | | 2021 | | 2020 |
| Cost of revenues | $ | 45,028 | | | $ | 38,438 | | | $ | 32,893 | |
| Sales and marketing | 82,794 | | | 79,144 | | | 72,895 | |
| General and administrative | 276,161 | | | 246,192 | | | 205,232 | |
| Total | $ | 403,983 | | | $ | 363,774 | | | $ | 311,020 | |
Our stock-based compensation recognized in the consolidated statement of operations was comprised of the following types of equity awards for the years ended December 31 (in thousands):
| | | | | | | | | | | | | | | | | |
| 2022 | | 2021 | | 2020 |
| | | | | |
| RSUs | $ | 359,952 | | | $ | 330,077 | | | $ | 289,426 | |
RSAs(1) | 9,793 | | | 10,067 | | | 8,289 | |
| Employee stock purchase plan | 34,238 | | | 23,630 | | | 13,305 | |
| Total | $ | 403,983 | | | $ | 363,774 | | | $ | 311,020 | |
(1) During the year ended December 31, 2020, we awarded 48,799 shares of RSAs. See Note 1 for further discussion.
During the years ended December 31, 2022, 2021 and 2020, we capitalized $46.3 million, $27.7 million and $20.3 million, respectively, of stock-based compensation expense as construction in progress in property, plant and equipment.
As of December 31, 2022, the total stock-based compensation cost related to unvested equity awards not yet recognized, net of estimated forfeitures, totaled $694.7 million which is expected to be recognized over a weighted-average period of 2.18 years.
EQUINIX, INC.
NOTES TO CONSOLIDATED FINANCIAL STATEMENTS - (Continued)
14. Income Taxes
Income before income taxes is attributable to the following geographic locations for the years ended December 31, (in thousands):
| | | | | | | | | | | | | | | | | |
| 2022 | | 2021 | | 2020 |
| Domestic | $ | 334,486 | | | $ | 137,492 | | | $ | 18,395 | |
| Foreign | 494,883 | | | 471,460 | | | 497,830 | |
Income before income taxes | $ | 829,369 | | | $ | 608,952 | | | $ | 516,225 | |
The tax benefit (expenses) for income taxes consisted of the following components for the years ended December 31, (in thousands):
| | | | | | | | | | | | | | | | | |
| 2022 | | 2021 | | 2020 |
| Current: | | | | | |
| Federal | $ | 1,679 | | | $ | 7,753 | | | $ | 4,552 | |
| State and local | (892) | | | (156) | | | 1,597 | |
| Foreign | (83,210) | | | (76,450) | | | (171,092) | |
Subtotal | (82,423) | | | (68,853) | | | (164,943) | |
| Deferred: | | | | | |
| Federal | (16,284) | | | 11,060 | | | 16,553 | |
| State and local | (5,024) | | | (1,411) | | | 704 | |
| Foreign | (21,061) | | | (50,020) | | | 1,535 | |
Subtotal | (42,369) | | | (40,371) | | | 18,792 | |
Income tax expense | $ | (124,792) | | | $ | (109,224) | | | $ | (146,151) | |
State and foreign taxes not based on income are included in general and administrative expenses and the aggregate amounts were not significant for the years ended December 31, 2022, 2021 and 2020.
The fiscal 2022, 2021, and 2020 income tax benefit (expenses) differed from the amounts computed by applying the U.S. federal income tax rate of 21% to pre-tax income as a result of the following for the years ended December 31 (in thousands):
| | | | | | | | | | | | | | | | | |
| 2022 | | 2021 | | 2020 |
| Federal tax at statutory rate | $ | (174,168) | | | $ | (127,880) | | | $ | (109,906) | |
| State and local tax (expense) benefit | (5,916) | | | (1,513) | | | 2,071 | |
| Deferred tax assets generated in current year not benefited | (39,196) | | | (19,703) | | | (12,852) | |
| Foreign income tax rate differential | (12,379) | | | (18,918) | | | (16,364) | |
| Non-deductible expenses | (5,995) | | | (10,579) | | | (4,427) | |
| Stock-based compensation expense | (8,321) | | | (1,385) | | | (954) | |
| Change in valuation allowance | (19,793) | | | (595) | | | 390 | |
| Foreign financing activities | (5,519) | | | (4,805) | | | (11,743) | |
| | | | | |
| Uncertain tax positions reserve | 45,317 | | | 50,059 | | | (38,014) | |
| Tax adjustments related to REIT | 107,312 | | | 39,164 | | | 50,107 | |
| Change in deferred tax adjustments | (239) | | | (1,251) | | | (136) | |
| Effect of tax rate change on deferred tax assets | (3,126) | | | (12,297) | | | — | |
| Other, net | (2,769) | | | 479 | | | (4,323) | |
Total income tax expense | $ | (124,792) | | | $ | (109,224) | | | $ | (146,151) | |
Of the unrecognized tax benefits being realized in the years ended December 31, 2022 and 2021, approximately $2.0 million and $32.0 million, respectively, are related to the uncertain tax position inherited from the
EQUINIX, INC.
NOTES TO CONSOLIDATED FINANCIAL STATEMENTS - (Continued)
acquisition of Metronode in 2018. The uncertain tax position was covered by an indemnification agreement with the Seller. As such, the realization of the unrecognized tax benefit resulted in an impairment of the indemnification asset for the same amount, which has been included in Other Income (Expense) on the Consolidated Statements of Operations for the years ended December 31, 2022 and 2021.
Our accounting policy is to treat any tax on Global Intangible Low-Taxed Income ("GILTI") inclusions as a current period cost included in the tax expense in the year incurred. We believe the GILTI inclusion provision will result in no material financial statement impact provided we satisfy our REIT distribution requirement with respect to the GILTI inclusions.
As a result of our conversion to a REIT effective January 1, 2015, it is no longer our intent to indefinitely reinvest undistributed foreign earnings. However, no deferred tax liability has been recognized to account for this change because the expected recovery of the basis difference will not result in material U.S. taxes in the post-REIT conversion periods due to the fact that the majority of our foreign subsidiaries are either QRSs or owned directly by our REIT and QRSs, and the foreign withholding tax effect would be immaterial. We continue to assess the foreign withholding tax impact of our current policy and do not believe the distribution of our foreign earnings would trigger any significant foreign withholding taxes, as the majority of the foreign jurisdictions where we operate do not impose withholding taxes on dividend distributions to a corporate U.S. parent.
The types of temporary differences that give rise to significant portions of our deferred tax assets and liabilities are set out below as of December 31 (in thousands):
| | | | | | | | | | | |
| 2022 | | 2021(1) |
| Deferred tax assets: | | | |
| Stock-based compensation expense | $ | 9,002 | | | $ | 9,057 | |
| Net unrealized losses | 3,988 | | | — | |
| Operating lease liabilities | 253,005 | | | 225,261 | |
| Capital lease liabilities | — | | | 13,927 | |
| Deferred revenue | 13,887 | | | 14,429 | |
| Goodwill | 20,511 | | | 30,842 | |
| Loss carryforwards and tax credits | 142,270 | | | 201,132 | |
| Others, net | 32,543 | | | 7,257 | |
Gross deferred tax assets | 475,206 | | | 501,905 | |
Valuation allowance | (166,594) | | | (100,746) | |
Total deferred tax assets, net | 308,612 | | | 401,159 | |
| Deferred tax liabilities: | | | |
| Net unrealized gains | — | | | (1,462) | |
| Capital lease liabilities | (8,033) | | | — | |
| Property, plant and equipment | (221,343) | | | (262,532) | |
| Right-of-use assets | (256,837) | | | (233,199) | |
| Deferred income | (28,314) | | | (33,052) | |
| Intangible assets | (132,816) | | | (151,385) | |
Total deferred tax liabilities | (647,343) | | | (681,630) | |
| Net deferred tax liabilities | $ | (338,731) | | | $ | (280,471) | |
(1) The prior year amounts presented in the table above have been reclassified to conform with the current year presentation.
The tax basis of REIT assets, excluding investments in TRSs, is greater than the amounts reported for such assets in the accompanying consolidated balance sheet by approximately $2.5 billion as of December 31, 2022.
EQUINIX, INC.
NOTES TO CONSOLIDATED FINANCIAL STATEMENTS - (Continued)
Our accounting for deferred taxes involves weighing positive and negative evidence concerning the realizability of our deferred tax assets in each taxing jurisdiction. After considering evidence such as the nature, frequency and severity of current and cumulative financial reporting losses, the sources of future taxable income, taxable income in carryback years permitted by the tax laws and tax planning strategies, we concluded that valuation allowances were required in certain jurisdictions. The operations in most of the jurisdictions for which a valuation allowance has been established have a history of significant losses as of December 31, 2022. As such, we do not believe these operations have established a sustained history of profitability and that a valuation allowance is, therefore, necessary. We also provided a valuation allowance against certain gross deferred tax assets in certain taxing jurisdictions as these deferred tax assets are not expected to be realizable in the foreseeable future.
Changes in the valuation allowance for deferred tax assets for the years ended December 31, 2022, 2021 and 2020 are as follows (in thousands):
| | | | | | | | | | | | | | | | | |
| 2022 | | 2021 | | 2020 |
| Beginning balance | $ | 100,746 | | | $ | 82,344 | | | $ | 57,812 | |
Amounts from acquisitions | 13,458 | | | 964 | | | 5,777 | |
| | | | | |
Amounts recognized into income | 22,905 | | | 595 | | | (390) | |
| Current increase | 36,513 | | | 19,539 | | | 15,044 | |
Impact of foreign currency exchange | (7,028) | | | (2,696) | | | 4,101 | |
| Ending balance | $ | 166,594 | | | $ | 100,746 | | | $ | 82,344 | |
Our NOL carryforwards for federal, state and foreign tax purposes which expire, if not utilized, at various intervals from 2023, are outlined below (in thousands):
| | | | | | | | | | | | | | | | | | | | | | | | | | |
| Expiration Date | | Federal (1) | | State (1) | | Foreign (2) (3) | | Total |
| 2023 | | $ | 17,395 | | | $ | — | | | $ | 2,083 | | | $ | 19,478 | |
| 2024 to 2026 | | 15,564 | | | — | | | 33,722 | | | 49,286 | |
| 2027 to 2029 | | 6,065 | | | — | | | 28,046 | | | 34,111 | |
| 2030 to 2032 | | — | | | 767 | | | 5,457 | | | 6,224 | |
| 2033 to 2035 | | 1,838 | | | 1,339 | | | 11,692 | | | 14,869 | |
| 2036 to 2038 | | 5,294 | | | 3,636 | | | 20,143 | | | 29,073 | |
| Thereafter | | 147,010 | | | 74,416 | | | 452,303 | | | 673,729 | |
| | $ | 193,166 | | | $ | 80,158 | | | $ | 553,446 | | | $ | 826,770 | |
(1)The total amount of NOL carryforwards that will not be available to offset our future taxable income after the dividends paid deduction due to Section 382 limitations was $36.7 million for federal and $22.7 million for state.
(2)In certain jurisdictions, the net operating loss carryforwards can only be used to offset a percentage of taxable income in a given year.
(3)If certain substantial changes in the entity's ownership occur or have determined to have occurred, there may be a limitation on the amount of the carryforwards that can be utilized.
EQUINIX, INC.
NOTES TO CONSOLIDATED FINANCIAL STATEMENTS - (Continued)
As of December 31, 2022, we had tax credit carryforwards of $6.2 million, which expire, if not utilized, from 2023 to 2031. We also had capital losses of $7.2 million, which can be carried forward indefinitely.
The beginning and ending balances of our unrecognized tax benefits are reconciled below for the years ended December 31 (in thousands):
| | | | | | | | | | | | | | | | | |
| 2022 | | 2021 | | 2020 |
| Beginning balance | $ | 148,300 | | | $ | 207,759 | | | $ | 173,726 | |
Gross increases related to prior year tax positions | 1,401 | | | 4,547 | | | 14,732 | |
Gross decreases related to prior year tax positions | (43,575) | | | (58,356) | | | — | |
Gross increases related to current year tax positions | 7,004 | | | 10,000 | | | 29,149 | |
Decreases resulting from expiration of statute of limitation | (11,969) | | | (10,561) | | | (6,518) | |
Decreases resulting from settlements | (11,924) | | | (5,089) | | | (3,330) | |
| Ending balance | $ | 89,237 | | | $ | 148,300 | | | $ | 207,759 | |
We recognize interest and penalties related to unrecognized tax benefits within income tax expense in the consolidated statements of operations. We accrued $6.5 million, $13.6 million, and $21.3 million for interest and penalties as of December 31, 2022, 2021 and 2020, respectively.
The unrecognized tax benefits of $89.2 million as of December 31, 2022, if subsequently recognized, will affect our effective tax rate favorably at the time when such a benefit is recognized.
Due to various tax years open for examination and the ongoing tax audits and inquiries by the tax authorities in different jurisdictions, it is reasonably possible that the balance of unrecognized tax benefits could significantly increase or decrease over the next 12 months as we may be subject to either examination by tax authorities, tax audit settlements, or a lapse in statute of limitations. We are currently unable to estimate the range of possible adjustments to the balance of unrecognized tax benefits.
In general, our income tax returns for the years from 2019 through the current year remain open to examination by federal and state taxing authorities. In addition, our tax years of 2005 through current year remain open and subject to examination by local tax authorities in certain foreign jurisdictions in which we have major operations.
15. Commitments and Contingencies
Purchase Commitments
As a result of our various IBX data center expansion projects, as of December 31, 2022, we were contractually committed for approximately $1.6 billion of unaccrued capital expenditures, primarily for IBX infrastructure equipment not yet delivered and labor not yet provided, in connection with the work necessary to open these IBX data centers and make them available to our customers for installation. We also had numerous other, non-capital purchase commitments in place as of December 31, 2022, such as commitments to purchase power in select locations through 2023 and thereafter, and other open purchase orders for goods, or services to be delivered or provided during 2023 and thereafter. Such other miscellaneous purchase commitments totaled approximately $1.8 billion as of December 31, 2022. For further information on our equity method investments contribution commitments and lease commitments, see Notes 6 and Note 10, respectively, above.
Contingent Liabilities
We estimate our exposure on certain liabilities, such as indirect and property taxes, based on the best information available at the time of determination. With respect to real and personal property taxes, we record what we can reasonably estimate based on prior payment history, assessed value by the assessor's office, current landlord estimates or estimates based on current or changing fixed asset values in each specific municipality, as applicable. However, there are circumstances beyond our control whereby the underlying value of the property or basis for which the tax is calculated on the property may change, such as a landlord selling the underlying property of one of our IBX data center leases or a municipality changing the assessment value in a jurisdiction and, as a result, our property tax obligations may vary from period to period. Based upon the most current facts and circumstances, we make the necessary property tax accruals for each of our reporting periods. However, revisions
EQUINIX, INC.
NOTES TO CONSOLIDATED FINANCIAL STATEMENTS - (Continued)
in our estimates of the potential or actual liability could materially impact our financial position, results of operations or cash flows.
Our indirect and property tax filings in various jurisdictions are subject to examination by local tax authorities. Although we believe that we have adequately assessed and accounted for our potential tax liabilities, and that our tax estimates are reasonable, there can be no certainty that additional taxes will not be due upon audit of our tax returns or as a result of further changes to the tax laws and interpretations thereof. For example, we are currently undergoing an audit and appealing the tentative assessment in Brazil. The final settlement of the audit and the outcomes of the appeal are uncertain and may not be resolved in our favor. We regularly assess the likelihood of adverse outcomes resulting from these examinations and appeals that would affect the adequacy of our tax accruals for each of the reporting periods. If any issues arising from the tax examinations and appeals are resolved in a manner inconsistent with our expectations, the revision of the estimates of the potential or actual liabilities could materially impact our financial position, results of operations, or cash flows.
From time to time, we may have certain contingent liabilities that arise in the ordinary course of our business activities. Contingent liabilities are accrued when it is probable that future expenditures will be made and such expenditures can be reasonably estimated. In the opinion of management, there are no pending claims for which the outcome is expected to result in a material adverse effect in the financial position, results of operations or cash flows.
Employment Agreements
We have entered into a severance agreement with certain of our executive officers that provides for a severance payment equal to 100% of the executive officer's annual base salary and maximum bonus in the event his or her employment is terminated for any reason other than cause or he or she voluntarily resigns under certain circumstances as described in the agreement, or 200% of the executive officer's annual base salary and maximum bonus in the event this occurs after a change-in-control of our company. For certain other executive officers, these benefits are only triggered after a change-in-control of our company, in which case the officer is entitled to 200% of the executive officer's annual base salary and maximum bonus. In addition, under these agreements, the executive officer is entitled to the payment of his or her monthly health care premiums under the Consolidated Omnibus Budget Reconciliation Act for up to 24 months.
Indemnification and Guarantor Arrangements
As permitted under Delaware law, we have agreements whereby we indemnify our officers and directors for certain events or occurrences while the officer or director is, or was serving, at our request in such capacity. The term of the indemnification period is for the officer's or director's lifetime. The maximum potential amount of future payments we could be required to make under these indemnification agreements is unlimited; however, we have a director and officer insurance policy that could limit our exposure and enable us to recover a portion of any future amounts paid. As a result of our insurance policy that could limit our exposure and enable us to recover some or all of amounts paid, our estimated fair value of these indemnification agreements is minimal. We have no liabilities recorded for these agreements as of December 31, 2022.
We enter into standard indemnification agreements in the ordinary course of business. Pursuant to these agreements, we may agree to indemnify, hold harmless, and reimburse the indemnified party for losses suffered or incurred by the indemnified party, generally a business partner or a customer, in connection matters such as any U.S. patent, or any copyright or other intellectual property infringement claim by any third party with respect to our offerings; a breach of confidentiality obligations and certain other contractual warranties; our gross negligence, willful misconduct, fraud, misrepresentation, or violation of law; and/or if we cause tangible property damage, personal injury or death. The term of any such indemnification agreement is generally perpetual after execution of the agreement. The maximum potential amount of future payments we could be required to make under these indemnification agreements is unlimited; however, we have never incurred material costs to defend lawsuits or settle claims related to these indemnification agreements. As a result, our estimated fair value of these agreements is minimal. We do not have significant liabilities recorded for these agreements as of December 31, 2022.
We enter into arrangements with certain business partners, whereby the business partner agrees to provide services as a subcontractor for our installations. Accordingly, we enter into standard indemnification agreements
EQUINIX, INC.
NOTES TO CONSOLIDATED FINANCIAL STATEMENTS - (Continued)
with our customers, whereby we indemnify them for certain acts, such as personal property damage, by our subcontractors. The maximum potential amount of future payments we could be required to make under these indemnification agreements is unlimited; however, we have general and umbrella insurance policies that could enable us to recover a portion of any amounts paid. We have never incurred material costs to defend lawsuits or settle claims related to these indemnification agreements. As a result, our estimated fair value of these agreements is minimal. We do not have significant liabilities recorded for these agreements as of December 31, 2022.
We have service level commitment obligations to certain of our customers. As a result, service interruptions or significant equipment damage in our IBX data centers, whether or not within our control, could result in obligations to these customers. Our liability insurance may not be adequate to cover those expenses. In addition, any loss of service, equipment damage or inability to meet our service level commitment obligations could reduce the confidence our customers have in us, and could consequently impair our ability to obtain and retain customers, which would adversely affect both our ability to generate revenues and our operating results. We generally have the ability to determine such service level credits prior to the associated revenue being recognized. We do not have significant liabilities in connection with service level credits as of December 31, 2022.
Concurrent with the closing of the EMEA 2 Joint Venture, the EMEA 2 Joint Venture entered into credit facility agreements with a group of lenders under which it could borrow up to approximately $1.4 billion in total at the exchange rate in effect on December 31, 2022, with such facilities maturing in 2025 and 2026. In connection with our 20% equity investment in the EMEA 2 Joint Venture, we provided the lenders with guarantees covering 20% of all payments of principal and interest due and payable by the EMEA 2 Joint Venture under these credit facilities, up to a limit of $292.1 million in total at the exchange rate in effect on December 31, 2022. As of December 31, 2022, the maximum potential amount of our future payments under these guarantees was approximately $89.3 million, at the exchange rates in effect on that date. Our estimated fair value of these guarantees is minimal as the likelihood of making a payout under the guarantees is low.
16. Related Party Transactions
Joint Venture Related Party Transactions
We have lease arrangements and provide various services to the EMEA 1 Joint Venture and the VIE Joint Ventures (the "Joint Ventures") through multiple agreements, including sales and marketing, development management, facilities management, and asset management services. These transactions are generally considered to have been negotiated at arm's length. The following table presents the revenues and expenses from these arrangements with the Joint Ventures in our consolidated statements of operations (in thousands):
| | | | | | | | | | | | | | | | | | | | | | | | | | |
| | | | Years Ended December 31, |
| Related Party | | Nature of Transaction | | 2022 | | 2021 | | 2020 |
| EMEA 1 Joint Venture | | Revenues | | $ | 39,065 | | | $ | 42,387 | | | $ | 21,306 | |
| EMEA 1 Joint Venture | | Expenses (1) | | 7,686 | | | 8,303 | | | 14,935 | |
| VIE Joint Ventures | | Revenues | | 40,284 | | | 28,320 | | | 588 | |
(1)Balances primarily consist of rent expenses for a 15 year sub-lease agreement with the EMEA 1 Joint Venture for a London data center.
The following table presents the assets and liabilities from related party transactions with the Joint Ventures in our consolidated balance sheets (in thousands):
EQUINIX, INC.
NOTES TO CONSOLIDATED FINANCIAL STATEMENTS - (Continued)
| | | | | | | | | | | | | | | | | | | | | | | | | | | | | | | | |
| | | | | | | | As of December 31, |
| Related Party | | Balance Sheet Line Item | | 2022 | | 2021 |
| EMEA 1 Joint Venture | | Receivables | | $ | 73,929 | | | $ | 32,077 | |
| Contract Assets (1) | | 7,261 | | | 54,503 | |
| Finance Lease Right of Use Assets | | 100,968 | | | 118,817 | |
| Other Liabilities and Payables | | 1,193 | | | 2,483 | |
| Other Liabilities and Payables - Construction Obligation (2) | | 18,967 | | | 39,382 | |
| Deferred Revenue | | 15,470 | | | 16,886 | |
| Finance Lease Right of Use Liabilities | | 108,603 | | | 124,918 | |
| VIE Joint Ventures | | Receivables | | 19,935 | | | 29,077 | |
| Contract Assets | | 5,281 | | | 1,492 | |
| Payables | | — | | | 1,876 | |
(1)A portion of the contract asset balance relates to commitments to complete a residual portion of the Paris 9 data center sold to the EMEA 1 Joint Venture, which is reimbursable in full upon completion.
(2)The balance primarily relates to the obligation to pay for future construction for certain sites sold as a part of the EMEA 1 Joint Venture transaction.
We have also sold certain data center facilities to our Joint Ventures and recognized gains or losses on asset sales; for more information refer to Note 5 above.
Other Related Party Transactions
We have several significant stockholders and other related parties that are also customers and/or vendors. Our activity of other related party transactions was as follows (in thousands):
| | | | | | | | | | | | | | | | | |
| Years ended December 31, |
| 2022 | | 2021 | | 2020 |
| Revenues | $ | 236,464 | | | $ | 140,947 | | | $ | 95,264 | |
| Costs and services | 58,932 | | | 5,337 | | | 10,849 | |
| | | | | | | | | | | |
| As of December 31, |
| 2022 | | 2021 |
| Accounts receivable | $ | 25,990 | | | $ | 27,997 | |
| Accounts payable | 665 | | | 20 | |
17. Segment Information
While we have one primary line of business, which is the design, build-out and operation of IBX data centers, we have determined that we have three reportable segments comprised of our Americas, EMEA and Asia-Pacific geographic regions. Our chief operating decision-maker evaluates performance, makes operating decisions and allocates resources based on our revenues and adjusted EBITDA performance both on a consolidated basis and based on these three reportable segments. Intercompany transactions between segments are excluded for management reporting purposes.
EQUINIX, INC.
NOTES TO CONSOLIDATED FINANCIAL STATEMENTS - (Continued)
The following tables present revenue information disaggregated by product lines and geographic areas (in thousands):
| | | | | | | | | | | | | | | | | | | | | | | |
| Year Ended December 31, 2022 |
| Americas | | EMEA | | Asia-Pacific | | Total |
Colocation (1) | $ | 2,187,751 | | | $ | 1,744,121 | | | $ | 1,150,738 | | | $ | 5,082,610 | |
| Interconnection | 756,214 | | | 268,398 | | | 243,664 | | | 1,268,276 | |
| Managed infrastructure | 218,499 | | | 119,361 | | | 77,646 | | | 415,506 | |
Other (1) | 20,727 | | | 75,449 | | | 8,719 | | | 104,895 | |
| Recurring revenues | 3,183,191 | | | 2,207,329 | | | 1,480,767 | | | 6,871,287 | |
| Non-recurring revenues | 166,026 | | | 135,875 | | | 89,917 | | | 391,818 | |
| Total | $ | 3,349,217 | | | $ | 2,343,204 | | | $ | 1,570,684 | | | $ | 7,263,105 | |
(1) Includes some leasing and hedging activities.
| | | | | | | | | | | | | | | | | | | | | | | |
| Year Ended December 31, 2021 |
| Americas | | EMEA | | Asia-Pacific | | Total |
Colocation (1) | $ | 2,002,253 | | | $ | 1,597,830 | | | $ | 1,042,131 | | | $ | 4,642,214 | |
| Interconnection | 678,677 | | | 259,538 | | | 223,287 | | | 1,161,502 | |
| Managed infrastructure | 168,577 | | | 124,937 | | | 87,343 | | | 380,857 | |
Other (1) | 12,430 | | | 19,626 | | | 3,856 | | | 35,912 | |
| Recurring revenues | 2,861,937 | | | 2,001,931 | | | 1,356,617 | | | 6,220,485 | |
| Non-recurring revenues | 159,814 | | | 153,285 | | | 101,953 | | | 415,052 | |
| Total | $ | 3,021,751 | | | $ | 2,155,216 | | | $ | 1,458,570 | | | $ | 6,635,537 | |
(1) Includes some leasing and hedging activities.
| | | | | | | | | | | | | | | | | | | | | | | |
| Year Ended December 31, 2020 |
| Americas | | EMEA | | Asia-Pacific | | Total |
Colocation (1) | $ | 1,820,709 | | | $ | 1,504,770 | | | $ | 933,522 | | | $ | 4,259,001 | |
| Interconnection | 622,327 | | | 213,490 | | | 187,441 | | | 1,023,258 | |
| Managed infrastructure | 120,159 | | | 127,722 | | | 89,464 | | | 337,345 | |
Other (1) | 19,605 | | | 18,738 | | | 83 | | | 38,426 | |
| Recurring revenues | 2,582,800 | | | 1,864,720 | | | 1,210,510 | | | 5,658,030 | |
| Non-recurring revenues | 124,958 | | | 131,669 | | | 83,888 | | | 340,515 | |
| Total | $ | 2,707,758 | | | $ | 1,996,389 | | | $ | 1,294,398 | | | $ | 5,998,545 | |
(1) Includes some leasing and hedging activities.
EQUINIX, INC.
NOTES TO CONSOLIDATED FINANCIAL STATEMENTS - (Continued)
Total revenues attributed to the U.S. were $2.9 billion, $2.6 billion and $2.5 billion for the year ended December 31, 2022, 2021, and 2020, respectively. There is no country outside of the U.S. from which we derived revenues that exceeded 10% of our total revenues during any of these periods. No single customer accounted for 10% or greater of our accounts receivable or revenues for the years ended December 31, 2022, 2021, and 2020.
We define adjusted EBITDA as net income excluding income tax expense, interest income, interest expense, other income or expense, gain or loss on debt extinguishment, depreciation, amortization, accretion, stock-based compensation expense, restructuring charges, impairment charges, transaction costs and gain or loss on asset sales as presented below for the years ended December 31 (in thousands):
| | | | | | | | | | | | | | | | | |
| 2022 | | 2021 | | 2020 |
| Adjusted EBITDA: | | | | | |
Americas | $ | 1,521,775 | | | $ | 1,326,460 | | | $ | 1,186,022 | |
EMEA | 1,109,502 | | | 1,033,333 | | | 974,246 | |
Asia-Pacific | 738,423 | | | 784,591 | | | 692,630 | |
Total adjusted EBITDA | 3,369,700 | | | 3,144,384 | | | 2,852,898 | |
| Depreciation, amortization and accretion expense | (1,739,374) | | | (1,660,524) | | | (1,427,010) | |
| Stock-based compensation expense | (403,983) | | | (363,774) | | | (311,020) | |
| Transaction costs | (21,839) | | | (22,769) | | | (55,935) | |
| Impairment charges | — | | | — | | | (7,306) | |
| Gain (loss) on asset sales | (3,976) | | | 10,845 | | | 1,301 | |
| Interest income | 36,268 | | | 2,644 | | | 8,654 | |
| Interest expense | (356,337) | | | (336,082) | | | (406,466) | |
| Other income (expense) | (51,417) | | | (50,647) | | | 6,913 | |
| Gain (loss) on debt extinguishment | 327 | | | (115,125) | | | (145,804) | |
| Income before income taxes | $ | 829,369 | | | $ | 608,952 | | | $ | 516,225 | |
We also provide the following segment disclosures related to our operations as follows for the years ended December 31 (in thousands):
| | | | | | | | | | | | | | | | | |
| 2022 | | 2021 | | 2020 |
| Depreciation and amortization: | | | | | |
Americas | $ | 931,357 | | | $ | 865,910 | | | $ | 729,611 | |
EMEA | 458,156 | | | 455,651 | | | 389,332 | |
Asia-Pacific | 346,695 | | | 334,729 | | | 304,426 | |
| Total | $ | 1,736,208 | | | $ | 1,656,290 | | | $ | 1,423,369 | |
| | | | | |
| Capital expenditures: | | | | | |
Americas | $ | 1,139,309 | | | $ | 970,217 | | | $ | 866,989 | |
EMEA | 750,569 | | | 1,049,279 | | | 888,239 | |
Asia-Pacific | 388,126 | | | 732,016 | | | 527,276 | |
| Total | $ | 2,278,004 | | | $ | 2,751,512 | | | $ | 2,282,504 | |
EQUINIX, INC.
NOTES TO CONSOLIDATED FINANCIAL STATEMENTS - (Continued)
Our long-lived assets, including property, plant and equipment, net and operating lease right-of-use assets, are located in the following geographic areas as of December 31 (in thousands):
| | | | | | | | | | | |
| 2022 | | 2021 |
Americas (1) | $ | 7,532,125 | | | $ | 6,777,174 | |
| EMEA | 5,577,498 | | | 5,125,341 | |
| Asia-Pacific | 3,539,911 | | | 3,543,260 | |
| Total Property, plant and equipment, net | $ | 16,649,534 | | | $ | 15,445,775 | |
(1)Includes $6.0 billion and $5.4 billion, respectively, of property, plant and equipment, net attributed to the U.S. as of December 31, 2022 and 2021.
| | | | | | | | | | | |
| 2022 | | 2021 |
Americas (1) | $ | 263,148 | | | $ | 297,300 | |
| EMEA | 440,139 | | | 470,330 | |
| Asia-Pacific | 724,663 | | | 514,788 | |
| Total Operating lease right-of-use assets | $ | 1,427,950 | | | $ | 1,282,418 | |
(1)Includes $244.7 million and $271.0 million of operating lease ROU assets attributed to the U.S. as of December 31, 2022 and 2021, respectively.
18. Subsequent Events
Declaration of dividends
On February 15, 2023, we declared a quarterly cash dividend of $3.41 per share, which is payable on March 22, 2023 to our common stockholders of record as of the close of business on March 7, 2023.
Issuance of JPY Senior Notes
On February 7, 2023, we entered into an agreement to sell ¥77.28 billion in principal amount of new unsecured senior notes. On February 16, 2023, we settled ¥10.0 billion of such notes, or approximately $74.7 million based on the exchange rate on that date, with the remainder of the notes expected to be settled later in the first quarter of 2023.
EQUINIX INC.
SCHEDULE III - SCHEDULE OF REAL ESTATE AND ACCUMULATED DEPRECIATION
DECEMBER 31, 2022
(Dollars in Thousands)
| | | | | | | | | | | | | | | | | | | | | | | | | | | | | | | | | | | | | | | | | | | | | | | | | | | | | | | |
| Initial Costs to Company (1) | | Costs Capitalized Subsequent to Acquisition or Lease | | Total Costs | | |
| Encumbrances | | Land | | Buildings and Improvements (2) | | Land | | Buildings and Improvements (2) | | Land | | Buildings and Improvements (2) | | Accumulated Depreciation (3) | | | | Date of Acquisition or Lease (4) |
| Americas: | | | | | | | | | | | | | | | | | | | |
| AT1 ATLANTA (METRO) | $— | | $— | | $— | | $— | | $283,927 | | $— | | $283,927 | | $(92,710) | | | | 2010 |
| AT2 ATLANTA (METRO) | — | | — | | — | | — | | 38,767 | | — | | 38,767 | | (32,030) | | | | 2010 |
| AT3 ATLANTA (METRO) | — | | — | | — | | — | | 4,388 | | — | | 4,388 | | (3,692) | | | | 2010 |
| AT4 ATLANTA (METRO) | — | | 5,400 | | 20,209 | | — | | 25,690 | | 5,400 | | 45,899 | | (15,817) | | | | 2017 |
| AT5 ATLANTA (METRO) | — | | — | | 5,011 | | — | | 2,028 | | — | | 7,039 | | (5,802) | | | | 2017 |
| BG1 BOGOTÁ (METRO), COLOMBIA | — | | — | | 8,779 | | 617 | | 3,673 | | 617 | | 12,452 | | (5,167) | | | | 2017 |
| BG2 BOGOTÁ (METRO), COLOMBIA | — | | 3,970 | | — | | — | | 25,210 | | 3,970 | | 25,210 | | (7) | | | | 2021 |
| BO2 BOSTON (METRO) | — | | 2,500 | | 30,383 | | — | | 37,485 | | 2,500 | | 67,868 | | (19,283) | | | | 2017 |
| CH1 CHICAGO (METRO) | — | | — | | — | | — | | 166,595 | | — | | 166,595 | | (115,407) | | | | 1999 |
| CH2 CHICAGO (METRO) | — | | — | | — | | — | | 120,460 | | — | | 120,460 | | (69,470) | | | | 2005 |
| CH3 CHICAGO (METRO) | — | | 9,759 | | — | | 351 | | 344,529 | | 10,110 | | 344,529 | | (156,159) | | | | 2006 |
| CH4 CHICAGO (METRO) | — | | — | | — | | — | | 22,924 | | — | | 22,924 | | (16,086) | | | | 2009 |
| CH7 CHICAGO (METRO) | — | | 670 | | 10,564 | | — | | 9,215 | | 670 | | 19,779 | | (6,936) | | | | 2017 |
| CL1 CALGARY (METRO), CANADA | — | | — | | 11,572 | | — | | 2,901 | | — | | 14,473 | | (5,639) | | | | 2020 |
| CL2 CALGARY (METRO), CANADA | — | | — | | 14,145 | | — | | 5,494 | | — | | 19,639 | | (6,782) | | | | 2020 |
| CL3 CALGARY (METRO), CANADA | — | | 7,747 | | 69,334 | | — | | 40,574 | | 7,747 | | 109,908 | | (13,069) | | | | 2020 |
| CU1 CULPEPER (METRO) | — | | 1,019 | | 37,581 | | — | | 5,708 | | 1,019 | | 43,289 | | (20,420) | | | | 2017 |
| CU2 CULPEPER (METRO) | — | | 1,244 | | 48,000 | | — | | 12,433 | | 1,244 | | 60,433 | | (21,599) | | | | 2017 |
| CU3 CULPEPER (METRO) | — | | 1,088 | | 37,387 | | — | | 15,016 | | 1,088 | | 52,403 | | (16,157) | | | | 2017 |
| CU4 CULPEPER (METRO) | — | | 1,372 | | 27,832 | | — | | 35,273 | | 1,372 | | 63,105 | | (15,482) | | | | 2017 |
| DA1 DALLAS (METRO) | — | | — | | — | | — | | 70,827 | | — | | 70,827 | | (43,070) | | | | 2000 |
| DA2 DALLAS (METRO) | — | | — | | — | | — | | 82,118 | | — | | 82,118 | | (37,387) | | | | 2010 |
| DA3 DALLAS (METRO) | — | | — | | — | | — | | 97,579 | | — | | 97,579 | | (47,698) | | | | 2010 |
| DA4 DALLAS (METRO) | — | | — | | — | | — | | 16,840 | | — | | 16,840 | | (10,500) | | | | 2010 |
| DA6 DALLAS (METRO) | — | | — | | 20,522 | | — | | 179,640 | | — | | 200,162 | | (58,551) | | | | 2012 |
| DA7 DALLAS (METRO) | — | | — | | — | | — | | 31,742 | | — | | 31,742 | | (19,321) | | | | 2015 |
| DA9 DALLAS (METRO) | — | | 610 | | 15,398 | | — | | 7,497 | | 610 | | 22,895 | | (8,599) | | | | 2017 |
| DA11 DALLAS (METRO) | — | | — | | — | | — | | 207,407 | | — | | 207,407 | | (26,487) | | | | 2018 |
| INFOMART BUILDING DALLAS (METRO) | — | | 24,380 | | 337,643 | | 3,293 | | 27,438 | | 27,673 | | 365,081 | | (52,990) | | | | 2018 |
| DC1 WASHINGTON, DC (METRO) | — | | — | | — | | — | | 5,780 | | — | | 5,780 | | (2,765) | | | | 1999 |
| DC2 WASHINGTON, DC (METRO) | — | | — | | — | | 5,047 | | 128,494 | | 5,047 | | 128,494 | | (98,592) | | | | 1999 |
| DC3 WASHINGTON, DC (METRO) | — | | — | | 37,451 | | — | | 52,183 | | — | | 89,634 | | (57,467) | | | | 2004 |
| DC4 WASHINGTON, DC (METRO) | — | | 1,906 | | 7,272 | | — | | 60,164 | | 1,906 | | 67,436 | | (46,836) | | | | 2005 |
| | | | | | | | | | | | | | | | | | | | | | | | | | | | | | | | | | | | | | | | | | | | | | | | | | | | | | | |
| Initial Costs to Company (1) | | Costs Capitalized Subsequent to Acquisition or Lease | | Total Costs | | |
| Encumbrances | | Land | | Buildings and Improvements (2) | | Land | | Buildings and Improvements (2) | | Land | | Buildings and Improvements (2) | | Accumulated Depreciation (3) | | | | Date of Acquisition or Lease (4) |
| DC5 WASHINGTON, DC (METRO) | — | | 1,429 | | 4,983 | | — | | 94,941 | | 1,429 | | 99,924 | | (73,905) | | | | 2005 |
| DC6 WASHINGTON, DC (METRO) | — | | 1,429 | | 5,082 | | — | | 94,521 | | 1,429 | | 99,603 | | (59,605) | | | | 2005 |
| DC7 WASHINGTON, DC (METRO) | — | | — | | — | | — | | 19,152 | | — | | 19,152 | | (15,565) | | | | 2010 |
| DC10 WASHINGTON, DC (METRO) | — | | — | | 44,601 | | — | | 90,071 | | — | | 134,672 | | (114,185) | | | | 2011 |
| DC11 WASHINGTON, DC (METRO) | — | | 1,429 | | 5,082 | | — | | 190,744 | | 1,429 | | 195,826 | | (82,458) | | | | 2005 |
| DC12 WASHINGTON, DC (METRO) | — | | — | | 101,783 | | — | | 82,863 | | — | | 184,646 | | (47,708) | | | | 2017 |
| DC13 WASHINGTON, DC (METRO) | — | | 5,500 | | 25,423 | | — | | 28,280 | | 5,500 | | 53,703 | | (19,950) | | | | 2017 |
| DC14 WASHINGTON, DC (METRO) | — | | 2,560 | | 33,511 | | — | | 15,026 | | 2,560 | | 48,537 | | (15,739) | | | | 2017 |
| DC15 WASHINGTON, DC (METRO) | — | | 1,965 | | — | | 1,964 | | 186,190 | | 3,929 | | 186,190 | | (23,019) | | | | 2018 |
| DC16 WASHINGTON, DC (METRO) | — | | — | | — | | — | | 139,800 | | — | | 139,800 | | — | | | | 2022 |
| DC21 WASHINGTON, DC (METRO) | — | | 1,507 | | — | | — | | 146,045 | | 1,507 | | 146,045 | | (13,291) | | | | 2019 |
| DC97 WASHINGTON, DC (METRO) | — | | — | | 2,021 | | — | | 1,944 | | — | | 3,965 | | (1,858) | | | | 2017 |
| DE1 DENVER (METRO) | — | | — | | — | | — | | 9,897 | | — | | 9,897 | | (9,002) | | | | 2010 |
| DE2 DENVER (METRO) | — | | 5,240 | | 23,053 | | — | | 32,706 | | 5,240 | | 55,759 | | (20,195) | | | | 2017 |
| HO1 HOUSTON (METRO) | — | | 1,440 | | 23,780 | | — | | 33,390 | | 1,440 | | 57,170 | | (20,311) | | | | 2017 |
| KA1 KAMLOOPS (METRO), CANADA | — | | 2,929 | | 46,983 | | — | | 16,510 | | 2,929 | | 63,493 | | (8,325) | | | | 2020 |
| LA1 LOS ANGELES (METRO) | — | | — | | — | | — | | 111,522 | | — | | 111,522 | | (79,280) | | | | 1999 |
| LA2 LOS ANGELES (METRO) | — | | — | | — | | — | | 10,610 | | — | | 10,610 | | (9,633) | | | | 2000 |
| LA3 LOS ANGELES (METRO) | — | | — | | 34,727 | | 3,959 | | 18,240 | | 3,959 | | 52,967 | | (43,819) | | | | 2005 |
| LA4 LOS ANGELES (METRO) | — | | 19,333 | | 137,630 | | — | | 80,458 | | 19,333 | | 218,088 | | (111,121) | | | | 2009 |
| LA7 LOS ANGELES (METRO) | — | | 7,800 | | 33,621 | | — | | 56,645 | | 7,800 | | 90,266 | | (20,968) | | | | 2017 |
| LM1 LIMA (METRO), PERU | — | | 4,589 | | 8,835 | | 106 | | 204 | | 4,695 | | 9,039 | | (347) | | | | 2022 |
| MI1 MIAMI (METRO) | — | | 18,920 | | 127,194 | | — | | 143,088 | | 18,920 | | 270,282 | | (89,270) | | | | 2017 |
| MI2 MIAMI (METRO) | — | | — | | — | | — | | 22,766 | | — | | 22,766 | | (16,253) | | | | 2010 |
| MI3 MIAMI (METRO) | — | | — | | — | | — | | 34,149 | | — | | 34,149 | | (22,588) | | | | 2012 |
| MI6 MIAMI (METRO) | — | | 4,750 | | 23,017 | | — | | 9,926 | | 4,750 | | 32,943 | | (14,906) | | | | 2017 |
| MO1 MONTERREY (METRO), MEXICO | — | | — | | 2,572 | | — | | 8,350 | | — | | 10,922 | | (1,673) | | | | 2020 |
| MT1 MONTREAL (METRO), CANADA | — | | — | | 76,932 | | — | | 17,721 | | — | | 94,653 | | (20,049) | | | | 2020 |
| MT2 MONTREAL (METRO), CANADA | — | | 2,800 | | 58,183 | | — | | — | | 2,800 | | 58,183 | | (4,457) | | | | 2022 |
| MX1 MEXICO CITY (METRO), MEXICO | — | | 1,090 | | 53,980 | | — | | 35,934 | | 1,090 | | 89,914 | | (13,119) | | | | 2020 |
| MX2 MEXICO CITY (METRO), MEXICO | — | | 1,090 | | 16,061 | | — | | 73,338 | | 1,090 | | 89,399 | | (4,446) | | | | 2020 |
| NY1 NEW YORK (METRO) | — | | — | | — | | — | | 71,417 | | — | | 71,417 | | (50,233) | | | | 1999 |
| NY2 NEW YORK (METRO) | — | | — | | — | | 17,859 | | 205,266 | | 17,859 | | 205,266 | | (136,262) | | | | 2000 |
| NY3 NEW YORK (METRO) | | | — | | — | | 38,484 | | 146,996 | | 38,484 | | 146,996 | | (459) | | | | 2022 |
| NY4 NEW YORK (METRO) | — | | — | | — | | — | | 370,970 | | — | | 370,970 | | (222,348) | | | | 2006 |
| NY5 NEW YORK (METRO) | — | | — | | — | | — | | 300,831 | | — | | 300,831 | | (113,510) | | | | 2010 |
| NY6 NEW YORK (METRO) | — | | — | | — | | — | | 99,163 | | — | | 99,163 | | (23,004) | | | | 2010 |
| NY7 NEW YORK (METRO) | — | | — | | 24,660 | | — | | 175,830 | | — | | 200,490 | | (152,800) | | | | 2010 |
| | | | | | | | | | | | | | | | | | | | | | | | | | | | | | | | | | | | | | | | | | | | | | | | | | | | | | | |
| Initial Costs to Company (1) | | Costs Capitalized Subsequent to Acquisition or Lease | | Total Costs | | |
| Encumbrances | | Land | | Buildings and Improvements (2) | | Land | | Buildings and Improvements (2) | | Land | | Buildings and Improvements (2) | | Accumulated Depreciation (3) | | | | Date of Acquisition or Lease (4) |
| NY9 NEW YORK (METRO) | — | | — | | — | | — | | 50,512 | | — | | 50,512 | | (40,850) | | | | 2010 |
| NY11 NEW YORK (METRO) | — | | 2,050 | | 58,717 | | — | | 40,862 | | 2,050 | | 99,579 | | (30,847) | | | | 2017 |
| NY13 NEW YORK (METRO) | — | | — | | 31,603 | | 8,300 | | 6,327 | | 8,300 | | 37,930 | | (20,446) | | | | 2017 |
| OT1 OTTAWA (METRO), CANADA | — | | 1,549 | | 39,128 | | — | | 1,931 | | 1,549 | | 41,059 | | (7,455) | | | | 2020 |
| PH1 PHILADELPHIA (METRO) | — | | — | | — | | — | | 44,543 | | — | | 44,543 | | (23,583) | | | | 2010 |
| RJ1 RIO DE JANEIRO (METRO), BRAZIL | — | | — | | — | | — | | 20,402 | | — | | 20,402 | | (16,387) | | | | 2011 |
| RJ2 RIO DE JANEIRO (METRO), BRAZIL | — | | — | | 2,012 | | 1,245 | | 68,500 | | 1,245 | | 70,512 | | (25,574) | | | | 2012 |
| SE2 SEATTLE (METRO) | — | | — | | — | | — | | 31,910 | | — | | 31,910 | | (26,961) | | | | 2010 |
| SE3 SEATTLE (METRO) | — | | — | | 1,760 | | — | | 101,820 | | — | | 103,580 | | (71,056) | | | | 2011 |
| SE4 SEATTLE (METRO) | — | | 4,000 | | 12,903 | | — | | 43,562 | | 4,000 | | 56,465 | | (14,506) | | | | 2017 |
| SJ1 SAINT JOHN (METRO), CANADA | — | | 159 | | 14,276 | | — | | 1,320 | | 159 | | 15,596 | | (2,612) | | | | 2020 |
| SP1 SÃO PAULO (METRO), BRAZIL | — | | — | | 10,188 | | — | | 23,290 | | — | | 33,478 | | (21,640) | | | | 2011 |
| SP2 SÃO PAULO (METRO), BRAZIL | — | | — | | — | | 3,030 | | 53,089 | | 3,030 | | 53,089 | | (38,500) | | | | 2011 |
| SP3 SÃO PAULO (METRO), BRAZIL | — | | 7,222 | | 72,997 | | 391 | | 78,637 | | 7,613 | | 151,634 | | (52,795) | | | | 2017 |
| SP4 SÃO PAULO (METRO), BRAZIL | — | | — | | 22,027 | | 6,720 | | 87,709 | | 6,720 | | 109,736 | | (26,415) | | | | 2017 |
| ST1 SANTIAGO (METRO), CHILE | — | | 2,101 | | 24,552 | | — | | 5,621 | | 2,101 | | 30,173 | | (1,471) | | | | 2022 |
| ST2 SANTIAGO (METRO), CHILE | — | | 2,101 | | 11,736 | | — | | 7,597 | | 2,101 | | 19,333 | | (694) | | | | 2022 |
| ST3 SANTIAGO (METRO), CHILE | — | | 1,520 | | 10,341 | | — | | 3,328 | | 1,520 | | 13,669 | | (834) | | | | 2022 |
| ST4 SANTIAGO (METRO), CHILE | — | | 81 | | 4,679 | | — | | 1,782 | | 81 | | 6,461 | | (375) | | | | 2022 |
| SV1 SILICON VALLEY (METRO) | — | | — | | — | | 15,545 | | 146,020 | | 15,545 | | 146,020 | | (104,313) | | | | 1999 |
| SV2 SILICON VALLEY (METRO) | — | | — | | — | | — | | 162,072 | | — | | 162,072 | | (110,329) | | | | 2003 |
| SV3 SILICON VALLEY (METRO) | — | | — | | — | | — | | 77,475 | | — | | 77,475 | | (45,246) | | | | 1999 |
| SV4 SILICON VALLEY (METRO) | — | | — | | — | | — | | 106,282 | | — | | 106,282 | | (31,327) | | | | 2005 |
| SV5 SILICON VALLEY (METRO) | — | | 6,238 | | 98,991 | | — | | 106,952 | | 6,238 | | 205,943 | | (99,928) | | | | 2010 |
| SV6 SILICON VALLEY (METRO) | — | | — | | 1,296 | | — | | — | | — | | 1,296 | | (1) | | | | 2010 |
| SV8 SILICON VALLEY (METRO) | — | | — | | — | | — | | 156,878 | | — | | 156,878 | | (48,495) | | | | 2010 |
| SV10 SILICON VALLEY (METRO) | — | | 12,646 | | 123,594 | | — | | 96,321 | | 12,646 | | 219,915 | | (54,124) | | | | 2017 |
| SV11 SILICON VALLEY (METRO) | — | | — | | — | | — | | 160,990 | | — | | 160,990 | | (9,621) | | | | 2019 |
| SV12 SILICON VALLEY (METRO) | — | | 20,313 | | — | | — | | 82,237 | | 20,313 | | 82,237 | | — | | | | 2015 |
| SV13 SILICON VALLEY (METRO) | — | | — | | 3,638 | | — | | — | | — | | 3,638 | | (3,426) | | | | 2017 |
| SV14 SILICON VALLEY (METRO) | — | | 3,638 | | 5,503 | | — | | 3,791 | | 3,638 | | 9,294 | | (3,654) | | | | 2017 |
| SV15 SILICON VALLEY (METRO) | — | | 7,651 | | 23,060 | | — | | 16,054 | | 7,651 | | 39,114 | | (14,181) | | | | 2017 |
| SV16 SILICON VALLEY (METRO) | — | | 4,271 | | 15,018 | | — | | 6,261 | | 4,271 | | 21,279 | | (8,075) | | | | 2017 |
| SV17 SILICON VALLEY (METRO) | — | | — | | 17,493 | | — | | 2,899 | | — | | 20,392 | | (16,090) | | | | 2017 |
| TR1 TORONTO (METRO), CANADA | — | | — | | — | | — | | 87,434 | | — | | 87,434 | | (39,215) | | | | 2010 |
| TR2 TORONTO (METRO), CANADA | — | | — | | 21,113 | | 99,857 | | 150,427 | | 99,857 | | 171,540 | | (37,700) | | | | 2015 |
| TR4 TORONTO (METRO), CANADA | — | | — | | 13,985 | | — | | 4,668 | | — | | 18,653 | | (8,360) | | | | 2020 |
| TR5 MARKHAM (METRO), CANADA | — | | — | | 24,913 | | — | | 1,660 | | — | | 26,573 | | (9,512) | | | | 2020 |
| | | | | | | | | | | | | | | | | | | | | | | | | | | | | | | | | | | | | | | | | | | | | | | | | | | | | | | |
| Initial Costs to Company (1) | | Costs Capitalized Subsequent to Acquisition or Lease | | Total Costs | | |
| Encumbrances | | Land | | Buildings and Improvements (2) | | Land | | Buildings and Improvements (2) | | Land | | Buildings and Improvements (2) | | Accumulated Depreciation (3) | | | | Date of Acquisition or Lease (4) |
| TR6 BRAMPTON (METRO), CANADA | — | | 9,386 | | 58,704 | | 2,463 | | 2,682 | | 11,849 | | 61,386 | | (9,036) | | | | 2020 |
| TR7 BRAMPTON (METRO), CANADA | — | | 9,193 | | 71,966 | | — | | 21,999 | | 9,193 | | 93,965 | | (18,848) | | | | 2020 |
| VA1 BURNABY (METRO), CANADA | — | | — | | 4,668 | | — | | 5,562 | | — | | 10,230 | | (1,960) | | | | 2020 |
| WI1 WINNIPEG (METRO), CANADA | — | | — | | 57,234 | | — | | 3,141 | | — | | 60,375 | | (4,284) | | | | 2020 |
OTHERS (5) | — | | 88,430 | | 50,135 | | 1,743 | | 66,789 | | 90,173 | | 116,924 | | (29,432) | | | | Various |
| | | | | | | | | | | | | | | | | | | |
| EMEA: | | | | | | | | | | | | | | | | | | | |
| AD1 ABU DHABI (METRO), UNITED ARAB EMIRATES | — | | — | | — | | — | | 75,852 | | — | | 75,852 | | (19,448) | | | | 2017 |
| AM1 AMSTERDAM (METRO), THE NETHERLANDS | — | | — | | — | | — | | 90,330 | | — | | 90,330 | | (53,551) | | | | 2008 |
| AM2 AMSTERDAM (METRO), THE NETHERLANDS | — | | — | | — | | — | | 77,337 | | — | | 77,337 | | (35,060) | | | | 2008 |
| AM3 AMSTERDAM (METRO), THE NETHERLANDS | — | | — | | 27,099 | | — | | 125,357 | | — | | 152,456 | | (72,449) | | | | 2011 |
| AM4 AMSTERDAM (METRO), THE NETHERLANDS | — | | — | | — | | — | | 210,596 | | — | | 210,596 | | (45,083) | | | | 2016 |
| AM5 AMSTERDAM (METRO), THE NETHERLANDS | — | | — | | 92,199 | | — | | 13,183 | | — | | 105,382 | | (40,602) | | | | 2016 |
| AM6 AMSTERDAM (METRO), THE NETHERLANDS | — | | 6,616 | | 50,876 | | 109 | | 99,554 | | 6,725 | | 150,430 | | (39,066) | | | | 2016 |
| AM7 AMSTERDAM (METRO), THE NETHERLANDS | — | | — | | 7,397 | | — | | 136,812 | | — | | 144,209 | | (34,628) | | | | 2016 |
| AM8 AMSTERDAM (METRO), THE NETHERLANDS | — | | — | | — | | — | | 12,367 | | — | | 12,367 | | (6,686) | | | | 2016 |
| AM11 AMSTERDAM (METRO), THE NETHERLANDS | — | | — | | 6,405 | | 391 | | 12,328 | | 391 | | 18,733 | | (4,057) | | | | 2019 |
| BA1 BARCELONA (METRO), SPAIN | — | | — | | 9,443 | | — | | 22,555 | | — | | 31,998 | | (13,323) | | | | 2017 |
| BA2 BARCELONA (METRO), SPAIN | — | | 7,808 | | — | | — | | 2,575 | | 7,808 | | 2,575 | | — | | | | 2022 |
| BX1 BORDEAUX (METRO), FRANCE | — | | 1,912 | | 3,507 | | — | | 67,388 | | 1,912 | | 70,895 | | (1,980) | | | | 2020 |
| DB1 DUBLIN (METRO), IRELAND | — | | — | | — | | — | | 5,260 | | — | | 5,260 | | (4,512) | | | | 2016 |
| DB2 DUBLIN (METRO), IRELAND | — | | — | | 12,460 | | — | | 10,785 | | — | | 23,245 | | (12,457) | | | | 2016 |
| DB3 DUBLIN (METRO), IRELAND | — | | 3,334 | | 54,387 | | 55 | | 20,401 | | 3,389 | | 74,788 | | (27,038) | | | | 2016 |
| DB4 DUBLIN (METRO), IRELAND | — | | — | | 26,875 | | — | | 17,875 | | — | | 44,750 | | (12,402) | | | | 2016 |
| DU1 DÜSSELDORF (METRO), GERMANY | — | | — | | — | | 7,740 | | 32,870 | | 7,740 | | 32,870 | | (18,822) | | | | 2000 |
| DX1 DUBAI (METRO), UNITED ARAB EMIRATES | — | | — | | — | | — | | 117,994 | | — | | 117,994 | | (50,368) | | | | 2008 |
| DX2 DUBAI (METRO), UNITED ARAB EMIRATES | — | | — | | — | | — | | 699 | | — | | 699 | | (426) | | | | 2017 |
| DX3 DUBAI (METRO), UNITED ARAB EMIRATES | — | | 6,738 | | — | | — | | 12,839 | | 6,738 | | 12,839 | | (602) | | | | 2020 |
| EN1 ENSCHEDE (METRO), THE NETHERLANDS | — | | — | | — | | — | | 36,040 | | — | | 36,040 | | (25,126) | | | | 2008 |
| | | | | | | | | | | | | | | | | | | | | | | | | | | | | | | | | | | | | | | | | | | | | | | | | | | | | | | |
| Initial Costs to Company (1) | | Costs Capitalized Subsequent to Acquisition or Lease | | Total Costs | | |
| Encumbrances | | Land | | Buildings and Improvements (2) | | Land | | Buildings and Improvements (2) | | Land | | Buildings and Improvements (2) | | Accumulated Depreciation (3) | | | | Date of Acquisition or Lease (4) |
| FR2 FRANKFURT (METRO), GERMANY | — | | — | | — | | 18,629 | | 587,688 | | 18,629 | | 587,688 | | (182,900) | | | | 2007 |
| FR4 FRANKFURT (METRO), GERMANY | — | | 11,578 | | 9,307 | | 191 | | 99,825 | | 11,769 | | 109,132 | | (42,990) | | | | 2009 |
| FR5 FRANKFURT (METRO), GERMANY | 30,310 | | — | | — | | 13,356 | | 247,177 | | 13,356 | | 247,177 | | (64,932) | | | | 2012 |
| FR6 FRANKFURT (METRO), GERMANY | — | | — | | — | | — | | 134,128 | | — | | 134,128 | | (39,491) | | | | 2016 |
| FR7 FRANKFURT (METRO), GERMANY | — | | — | | 43,634 | | — | | 42,576 | | — | | 86,210 | | (35,508) | | | | 2016 |
| FR8 FRANKFURT (METRO), GERMANY | — | | 19,202 | | 58,199 | | — | | 66,707 | | 19,202 | | 124,906 | | (6,260) | | | | 2020 |
| FR13 FRANKFURT (METRO), GERMANY | — | | — | | — | | — | | 6,319 | | — | | 6,319 | | — | | | | 2021 |
| GN1 GENOA (METRO), ITALY | — | | — | | 1,988 | | — | | 20,367 | | — | | 22,355 | | (757) | | | | 2020 |
| GV1 GENEVA (METRO), SWITZERLAND | — | | — | | — | | — | | 26,855 | | — | | 26,855 | | (13,565) | | | | 2004 |
| GV2 GENEVA (METRO), SWITZERLAND | — | | — | | — | | — | | 54,968 | | — | | 54,968 | | (24,168) | | | | 2009 |
| HE3 HELSINKI (METRO), FINLAND | — | | — | | — | | — | | 14,226 | | — | | 14,226 | | (9,835) | | | | 2016 |
| HE4 HELSINKI (METRO), FINLAND | — | | — | | 29,092 | | — | | 6,096 | | — | | 35,188 | | (22,383) | | | | 2016 |
| HE5 HELSINKI (METRO), FINLAND | — | | — | | 7,564 | | — | | 18,921 | | — | | 26,485 | | (8,621) | | | | 2016 |
| HE6 HELSINKI (METRO), FINLAND | — | | — | | 17,204 | | 1,498 | | 33,763 | | 1,498 | | 50,967 | | (17,833) | | | | 2016 |
| HE7 HELSINKI (METRO), FINLAND | — | | 7,348 | | 6,946 | | 630 | | 60,952 | | 7,978 | | 67,898 | | (8,497) | | | | 2018 |
| HH1 HAMBURG (METRO), GERMANY | | | 3,612 | | 5,360 | | 356 | | 47,517 | | 3,968 | | 52,877 | | (6,896) | | | | 2018 |
| IL2 ISTANBUL (METRO), TURKEY | — | | 14,460 | | 39,289 | | — | | 66,384 | | 14,460 | | 105,673 | | (14,167) | | | | 2017 |
| LD3 LONDON (METRO), UNITED KINGDOM | — | | — | | — | | — | | 17,307 | | — | | 17,307 | | (15,285) | | | | 2000 |
| LD4 LONDON (METRO), UNITED KINGDOM | — | | — | | 23,044 | | — | | 139,253 | | — | | 162,297 | | (65,609) | | | | 2007 |
| LD5 LONDON (METRO), UNITED KINGDOM | — | | — | | 16,412 | | — | | 174,138 | | — | | 190,550 | | (103,475) | | | | 2010 |
| LD6 LONDON (METRO), UNITED KINGDOM | — | | — | | — | | — | | 140,024 | | — | | 140,024 | | (48,378) | | | | 2013 |
| LD7 LONDON (METRO), UNITED KINGDOM | — | | — | | — | | 189,922 | | 267,217 | | 189,922 | | 267,217 | | (26,142) | | | | 2018 |
| LD8 LONDON (METRO), UNITED KINGDOM | — | | — | | 107,544 | | — | | 80,927 | | — | | 188,471 | | (61,761) | | | | 2016 |
| LD9 LONDON (METRO), UNITED KINGDOM | — | | — | | 181,431 | | — | | 170,539 | | — | | 351,970 | | (107,492) | | | | 2016 |
| LD10 LONDON (METRO), UNITED KINGDOM | — | | — | | 40,251 | | — | | 114,520 | | — | | 154,771 | | (29,023) | | | | 2017 |
| LS1 LISBON (METRO), PORTUGAL | — | | — | | 7,374 | | 3,306 | | 20,075 | | 3,306 | | 27,449 | | (5,714) | | | | 2017 |
| LAGOS 1 (METRO), PORTUGAL | — | | 1,515 | | 12,470 | | 3,432 | | 116,045 | | 4,947 | | 128,515 | | (6,436) | | | | 2022 |
| MA1 MANCHESTER (METRO), UNITED KINGDOM | — | | — | | — | | — | | 17,337 | | — | | 17,337 | | (9,286) | | | | 2016 |
| MA2 MANCHESTER (METRO), UNITED KINGDOM | — | | — | | — | | — | | 9,629 | | — | | 9,629 | | (8,655) | | | | 2016 |
| MA3 MANCHESTER (METRO), UNITED KINGDOM | — | | — | | 44,931 | | — | | 18,012 | | — | | 62,943 | | (31,669) | | | | 2016 |
| MA4 MANCHESTER (METRO), UNITED KINGDOM | — | | — | | 6,697 | | — | | 7,954 | | — | | 14,651 | | (8,161) | | | | 2016 |
| MA5 MANCHESTER (METRO), UNITED KINGDOM | — | | 3,671 | | 6,874 | | — | | 80,923 | | 3,671 | | 87,797 | | (2,124) | | | | 2020 |
| MD1 MADRID (METRO), SPAIN | — | | — | | 7,917 | | — | | 7,488 | | — | | 15,405 | | (6,637) | | | | 2017 |
| MD2 MADRID (METRO), SPAIN | — | | — | | 40,952 | | — | | 84,822 | | — | | 125,774 | | (43,837) | | | | 2017 |
| MD6 MADRID (METRO), SPAIN | — | | — | | — | | — | | 1,226 | | — | | 1,226 | | (2) | | | | 2022 |
| | | | | | | | | | | | | | | | | | | | | | | | | | | | | | | | | | | | | | | | | | | | | | | | | | | | | | | |
| Initial Costs to Company (1) | | Costs Capitalized Subsequent to Acquisition or Lease | | Total Costs | | |
| Encumbrances | | Land | | Buildings and Improvements (2) | | Land | | Buildings and Improvements (2) | | Land | | Buildings and Improvements (2) | | Accumulated Depreciation (3) | | | | Date of Acquisition or Lease (4) |
| ML2 MILAN (METRO), ITALY | — | | — | | — | | — | | 23,477 | | — | | 23,477 | | (18,642) | | | | 2016 |
| ML3 MILAN (METRO), ITALY | — | | — | | — | | 3,399 | | 43,778 | | 3,399 | | 43,778 | | (16,477) | | | | 2016 |
| ML5 MILAN (METRO), ITALY | — | | 6,479 | | 20,952 | | — | | 86,130 | | 6,479 | | 107,082 | | (5,244) | | | | 2019 |
| MU1 MUNICH (METRO), GERMANY | — | | — | | — | | — | | 35,906 | | — | | 35,906 | | (18,726) | | | | 2007 |
| MU3 MUNICH (METRO), GERMANY | — | | — | | — | | — | | 6,100 | | — | | 6,100 | | (3,048) | | | | 2010 |
| MU4 MUNICH (METRO), GERMANY | | | 11,399 | | 35,120 | | — | | 54,651 | | 11,399 | | 89,771 | | (3,558) | | | | 2020 |
| PA2 & PA3 PARIS (METRO), FRANCE | — | | — | | 29,615 | | 22,190 | | 316,306 | | 22,190 | | 345,921 | | (149,239) | | | | 2007 |
| PA4 PARIS (METRO), FRANCE | — | | 1,524 | | 9,503 | | — | | 232,040 | | 1,524 | | 241,543 | | (92,574) | | | | 2011 |
| PA5 PARIS (METRO), FRANCE | — | | — | | 16,554 | | — | | 10,310 | | — | | 26,864 | | (9,499) | | | | 2016 |
| PA6 PARIS (METRO), FRANCE | — | | — | | — | | — | | 83,383 | | — | | 83,383 | | (40,643) | | | | 2016 |
| PA7 PARIS (METRO), FRANCE | — | | — | | — | | — | | 24,547 | | — | | 24,547 | | (13,869) | | | | 2016 |
| PA10 PARIS (METRO), FRANCE | — | | — | | — | | — | | 132,736 | | — | | 132,736 | | (1,382) | | | | 2021 |
| SA1 SEVILLE (METRO), SPAIN | — | | — | | 1,567 | | — | | 1,472 | | — | | 3,039 | | (2,300) | | | | 2017 |
| SK1 STOCKHOLM, (METRO), SWEDEN | — | | — | | 15,495 | | — | | 67,721 | | — | | 83,216 | | (13,626) | | | | 2016 |
| SK2 STOCKHOLM, (METRO), SWEDEN | — | | — | | 80,148 | | 3,391 | | 65,837 | | 3,391 | | 145,985 | | (43,237) | | | | 2016 |
| SK3 STOCKHOLM, (METRO), SWEDEN | — | | — | | — | | — | | 24,507 | | — | | 24,507 | | (7,424) | | | | 2016 |
| SO1 SOFIA (METRO), BULGARIA | — | | — | | 5,236 | | — | | 4,401 | | — | | 9,637 | | (3,736) | | | | 2016 |
| SO2 SOFIA (METRO), BULGARIA | — | | 2,592 | | — | | — | | 22,529 | | 2,592 | | 22,529 | | (2,804) | | | | 2017 |
| WA1 WARSAW (METRO), POLAND | — | | — | | 5,950 | | — | | 23,184 | | — | | 29,134 | | (11,358) | | | | 2016 |
| WA2 WARSAW (METRO), POLAND | — | | — | | 4,709 | | — | | 8,588 | | — | | 13,297 | | (6,165) | | | | 2016 |
| WA3 WARSAW (METRO), POLAND | — | | 2,443 | | — | | — | | 60,513 | | 2,443 | | 60,513 | | (5,344) | | | | 2017 |
| ZH2 ZURICH (METRO), SWITZERLAND | — | | — | | — | | — | | 5,938 | | — | | 5,938 | | (4,609) | | | | 2002 |
| ZH4 ZURICH (METRO), SWITZERLAND | — | | — | | 11,284 | | — | | 46,864 | | — | | 58,148 | | (30,276) | | | | 2009 |
| ZH5 ZURICH (METRO), SWITZERLAND | — | | — | | — | | 7,971 | | 242,681 | | 7,971 | | 242,681 | | (45,823) | | | | 2009 |
| ZW1 ZWOLLE (METRO), THE NETHERLANDS | — | | — | | — | | — | | 10,186 | | — | | 10,186 | | (9,527) | | | | 2008 |
OTHERS (5) | — | | 56,430 | | 18,309 | | 35,479 | | 206,800 | | 91,909 | | 225,109 | | (53,220) | | | | Various |
| | | | | | | | | | | | | | | | | | | |
| Asia-Pacific: | | | | | | | | | | | | | | | | | | | |
| AE1 ADELAIDE (METRO), AUSTRALIA | — | | 2,574 | | 1,015 | | — | | 2,393 | | 2,574 | | 3,408 | | (1,152) | | | | 2018 |
| BR1 BRISBANE (METRO), AUSTRALIA | — | | 3,064 | | 1,053 | | — | | 3,342 | | 3,064 | | 4,395 | | (1,112) | | | | 2018 |
| CA1 CANBERRA (METRO), AUSTRALIA | — | | — | | 18,410 | | — | | 7,195 | | — | | 25,605 | | (4,237) | | | | 2018 |
| CN1 CHENNAI (METRO), INDIA | — | | — | | — | | 8,003 | | 5,415 | | 8,003 | | 5,415 | | (65) | | | | 2022 |
| HK1 HONG KONG (METRO), CHINA | — | | — | | — | | — | | 300,810 | | — | | 300,810 | | (130,874) | | | | 2003 |
| HK2 HONG KONG (METRO), CHINA | — | | — | | — | | — | | 242,921 | | — | | 242,921 | | (189,170) | | | | 2010 |
| HK3 HONG KONG (METRO), CHINA | — | | — | | — | | — | | 183,050 | | — | | 183,050 | | (101,415) | | | | 2012 |
| HK4 HONG KONG (METRO), CHINA | — | | — | | — | | — | | 97,919 | | — | | 97,919 | | (32,004) | | | | 2012 |
| HK5 HONG KONG (METRO), CHINA | — | | — | | 70,002 | | — | | 43,089 | | — | | 113,091 | | (33,571) | | | | 2017 |
| MB1 MUMBAI (METRO), INDIA | — | | 515 | | 28,457 | | — | | 2,761 | | 515 | | 31,218 | | (3,293) | | | | 2021 |
| | | | | | | | | | | | | | | | | | | | | | | | | | | | | | | | | | | | | | | | | | | | | | | | | | | | | | | |
| Initial Costs to Company (1) | | Costs Capitalized Subsequent to Acquisition or Lease | | Total Costs | | |
| Encumbrances | | Land | | Buildings and Improvements (2) | | Land | | Buildings and Improvements (2) | | Land | | Buildings and Improvements (2) | | Accumulated Depreciation (3) | | | | Date of Acquisition or Lease (4) |
| MB2 MUMBAI (METRO), INDIA | — | | — | | 54,494 | | — | | — | | — | | 54,494 | | (6,746) | | | | 2021 |
| MB3 MUMBAI (METRO), INDIA | — | | — | | — | | 28,948 | | 6,362 | | 28,948 | | 6,362 | | — | | | | 2022 |
| ME1 MELBOURNE (METRO), AUSTRALIA | — | | 14,478 | | — | | — | | 91,595 | | 14,478 | | 91,595 | | (32,366) | | | | 2013 |
| ME2 MELBOURNE (METRO), AUSTRALIA | — | | — | | — | | — | | 102,634 | | — | | 102,634 | | (11,468) | | | | 2018 |
| ME4 MELBOURNE (METRO), AUSTRALIA | — | | 3,323 | | 84,175 | | — | | 10,472 | | 3,323 | | 94,647 | | (28,739) | | | | 2018 |
| ME5 MELBOURNE (METRO), AUSTRALIA | — | | 6,455 | | 4,094 | | — | | 4,606 | | 6,455 | | 8,700 | | (3,412) | | | | 2018 |
| OS1 OSAKA (METRO), JAPAN | — | | — | | 14,876 | | — | | 94,581 | | — | | 109,457 | | (45,839) | | | | 2013 |
| OS3 OSAKA (METRO), JAPAN | — | | — | | — | | — | | 199,004 | | — | | 199,004 | | (19,415) | | | | 2020 |
| PE1 PERTH (METRO), AUSTRALIA | — | | 1,307 | | 1,337 | | — | | 2,136 | | 1,307 | | 3,473 | | (759) | | | | 2018 |
| PE2 PERTH (METRO), AUSTRALIA | — | | — | | 16,327 | | — | | 15,983 | | — | | 32,310 | | (10,059) | | | | 2018 |
| PE3 PERTH (METRO), AUSTRALIA | — | | — | | — | | — | | 56,947 | | — | | 56,947 | | (3,636) | | | | 2020 |
| SG1 SINGAPORE (METRO) | — | | — | | — | | — | | 302,976 | | — | | 302,976 | | (147,603) | | | | 2003 |
| SG2 SINGAPORE (METRO) | — | | — | | — | | — | | 346,957 | | — | | 346,957 | | (247,585) | | | | 2008 |
| SG3 SINGAPORE (METRO) | — | | — | | 34,844 | | — | | 246,729 | | — | | 281,573 | | (88,991) | | | | 2013 |
| SG4 SINGAPORE (METRO) | — | | — | | 54,602 | | — | | 160,563 | | — | | 215,165 | | (31,593) | | | | 2019 |
| SG5 SINGAPORE (METRO) | — | | — | | — | | — | | 327,608 | | — | | 327,608 | | (18,523) | | | | 2019 |
| SH2 SHANGHAI (METRO), CHINA | — | | — | | — | | — | | 7,420 | | — | | 7,420 | | (4,366) | | | | 2012 |
| SH3 SHANGHAI (METRO), CHINA | — | | — | | 7,066 | | — | | 13,555 | | — | | 20,621 | | (8,267) | | | | 2012 |
| SH5 SHANGHAI (METRO), CHINA | — | | — | | 11,284 | | — | | 23,558 | | — | | 34,842 | | (18,366) | | | | 2012 |
| SH6 SHANGHAI (METRO), CHINA | — | | — | | 16,545 | | — | | 34,902 | | — | | 51,447 | | (8,810) | | | | 2017 |
| SL1 SEOUL (METRO), SOUTH KOREA | — | | — | | 29,236 | | — | | 35,968 | | — | | 65,204 | | (19,149) | | | | 2019 |
| SY1 SYDNEY (METRO), AUSTRALIA | — | | — | | — | | 80,706 | | 38,161 | | 80,706 | | 38,161 | | (24,626) | | | | 2003 |
| SY2 SYDNEY (METRO), AUSTRALIA | — | | — | | 3,080 | | — | | 26,629 | | — | | 29,709 | | (23,913) | | | | 2008 |
| SY3 SYDNEY (METRO), AUSTRALIA | — | | — | | 8,712 | | — | | 143,068 | | — | | 151,780 | | (93,293) | | | | 2010 |
| SY4 SYDNEY (METRO), AUSTRALIA | — | | — | | — | | — | | 177,003 | | — | | 177,003 | | (64,763) | | | | 2014 |
| SY5 SYDNEY (METRO), AUSTRALIA | — | | 79,613 | | — | | — | | 246,176 | | 79,613 | | 246,176 | | (24,747) | | | | 2018 |
| SY6 SYDNEY (METRO), AUSTRALIA | — | | 8,593 | | 64,197 | | — | | 19,230 | | 8,593 | | 83,427 | | (15,713) | | | | 2018 |
| SY7 SYDNEY (METRO), AUSTRALIA | — | | 2,662 | | 47,350 | | — | | 4,531 | | 2,662 | | 51,881 | | (10,917) | | | | 2018 |
| TY1 TOKYO (METRO), JAPAN | — | | — | | — | | — | | 32,784 | | — | | 32,784 | | (21,073) | | | | 2000 |
| TY2 TOKYO (METRO), JAPAN | — | | — | | — | | — | | 89,367 | | — | | 89,367 | | (59,814) | | | | 2006 |
| TY3 TOKYO (METRO), JAPAN | — | | — | | — | | — | | 67,404 | | — | | 67,404 | | (41,572) | | | | 2010 |
| TY4 TOKYO (METRO), JAPAN | — | | — | | — | | — | | 72,430 | | — | | 72,430 | | (37,356) | | | | 2012 |
| TY5 TOKYO (METRO), JAPAN | — | | — | | 102 | | — | | 55,213 | | — | | 55,315 | | (21,862) | | | | 2014 |
| TY6 TOKYO (METRO), JAPAN | — | | — | | 37,941 | | — | | 12,852 | | — | | 50,793 | | (43,370) | | | | 2015 |
| TY7 TOKYO (METRO), JAPAN | — | | — | | 13,175 | | — | | 6,109 | | — | | 19,284 | | (14,325) | | | | 2015 |
| TY8 TOKYO (METRO), JAPAN | — | | — | | 53,848 | | — | | 8,638 | | — | | 62,486 | | (30,732) | | | | 2015 |
| TY9 TOKYO (METRO), JAPAN | — | | — | | 106,710 | | — | | 11,416 | | — | | 118,126 | | (82,849) | | | | 2015 |
| TY10 TOKYO (METRO), JAPAN | — | | — | | 69,881 | | — | | 7,226 | | — | | 77,107 | | (29,456) | | | | 2015 |
| | | | | | | | | | | | | | | | | | | | | | | | | | | | | | | | | | | | | | | | | | | | | | | | | | | | | | | |
| Initial Costs to Company (1) | | Costs Capitalized Subsequent to Acquisition or Lease | | Total Costs | | |
| Encumbrances | | Land | | Buildings and Improvements (2) | | Land | | Buildings and Improvements (2) | | Land | | Buildings and Improvements (2) | | Accumulated Depreciation (3) | | | | Date of Acquisition or Lease (4) |
| TY11 TOKYO (METRO), JAPAN | — | | — | | 22,099 | | — | | 225,851 | | — | | 247,950 | | (28,436) | | | | 2018 |
| TY15 TOKYO (METRO), JAPAN | — | | — | | — | | — | | 25,741 | | — | | 25,741 | | — | | | | 2022 |
OTHERS (5) | — | | — | | 1,733 | | — | | 70,572 | | — | | 72,305 | | (11,175) | | | | Various |
| TOTAL LOCATIONS | $30,310 | | $621,259 | | $4,697,242 | | $640,676 | | $17,844,178 | | $1,261,935 | | $22,541,420 | | $(8,094,898) | | | | |
(1) The initial cost was $0 if the lease of the respective IBX was classified as an operating lease.
(2) Building and improvements include all fixed assets except for land.
(3) Buildings and improvements are depreciated on a straight-line basis over estimated useful live as described under described in Note 1 within the Consolidated Financial Statements.
(4) Date of lease or acquisition represents the date we leased the facility or acquired the facility through purchase or acquisition.
(5) Includes various IBXs that are under initial development and costs incurred at certain central locations supporting various IBX functions.
The aggregate gross cost of our properties for federal income tax purpose approximated $31.6 billion (unaudited) as of December 31, 2022.
The following table reconciles the historical cost of our properties for financial reporting purposes for each of the years in the three-year period ended December 31, 2022 (in thousands).
Gross Fixed Assets:
| | | | | | | | | | | | | | | | | |
| 2022 | | 2021 | | 2020 |
| Balance, beginning of period | $ | 21,906,055 | | | $ | 20,161,785 | | | $ | 16,927,332 | |
| Additions (including acquisitions and improvements) | 3,250,576 | | | 2,977,992 | | | 3,110,907 | |
| Disposals | (543,545) | | | (648,516) | | | (446,864) | |
| Foreign currency transaction adjustments and others | (809,731) | | | (585,206) | | | 570,410 | |
| Balance, end of year | $ | 23,803,355 | | | $ | 21,906,055 | | | $ | 20,161,785 | |
Accumulated Depreciation:
| | | | | | | | | | | | | | | | | |
| 2022 | | 2021 | | 2020 |
| Balance, beginning of period | $ | (7,274,860) | | | $ | (6,399,477) | | | $ | (5,329,182) | |
| Additions (depreciation expense) | (1,268,177) | | | (1,224,874) | | | (1,036,452) | |
| Disposals | 230,268 | | | 149,231 | | | 109,230 | |
| Foreign currency transaction adjustments and others | 217,871 | | | 200,260 | | | (143,073) | |
| Balance, end of year | $ | (8,094,898) | | | $ | (7,274,860) | | | $ | (6,399,477) | |